U.S. Small Businesses Adapt to Shifting Economic Tides
Ksenia Bushmeneva, Economist | 416-308-7392
Date Published: May 5, 2026
- Category:
- U.S.
- Business Investment
Highlights
- Small businesses are adapting to economic uncertainty. Various surveys show firms are learning to operate in a more volatile policy and cost environment.
- Uncertainty hasn’t stopped Americans from starting new businesses, with firm starts in healthcare & social assistance, and professional & technical services leading the way last year. Applications for new businesses are also on the rise, pointing to potential upside to firm creation this year.
- Small businesses cite labor quality, taxes, and inflation as top concerns. Worries about sales and insurance costs have grown. Higher energy prices have shaken confidence most recently and will fuel inflation fears. On the upside, rising AI adoption presents new ways to address some of the cost and labor challenges.
- Looking ahead, an increase in business applications points to a potential rebound in new business creation this year, supported by business-friendly tax changes, ongoing deregulation, and increased AI adoption.
Last year brought a host of changes and disruptions for the U.S. economy, impacting businesses both large and small. Uncertainty is expected to persist this year, especially regarding international trade and, more recently, the sharp run-up in energy prices. The spike in energy prices is the latest curveball for the U.S. businesses, which dented confidence in March.
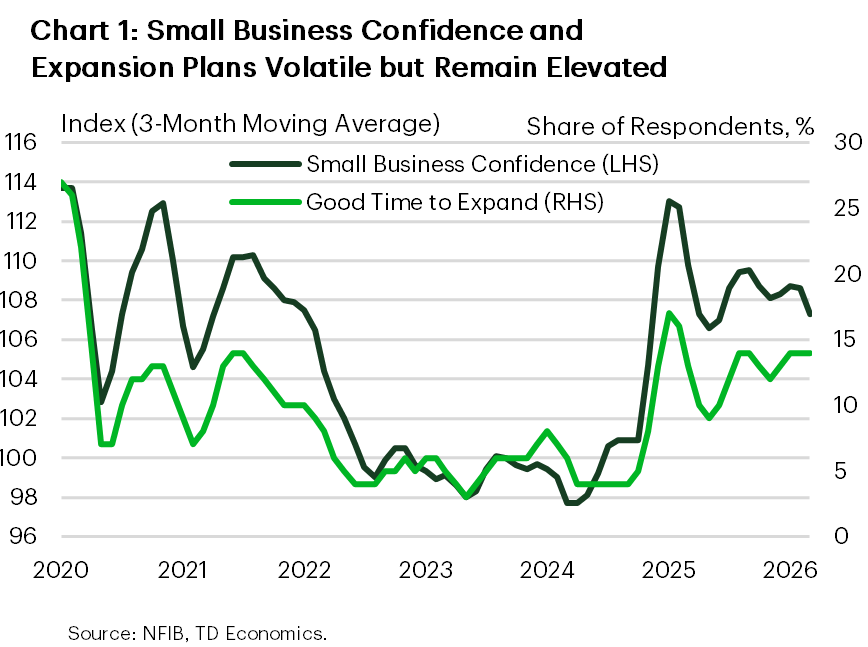
However, looking through the monthly swings, the NFIB small business confidence survey indicates that small businesses may be gradually adapting to this less predictable economic landscape. While small business optimism continues to be volatile alongside economic and policy turbulence, sentiment has improved relative to the 2023-24 period (Chart 1). A TD Bank survey of small businesses carried out in March of this year also found small business owners are optimistic about the future: 74% believe that the economic environment will improve over the next 12-18 months, up slightly from 71% in 2025.
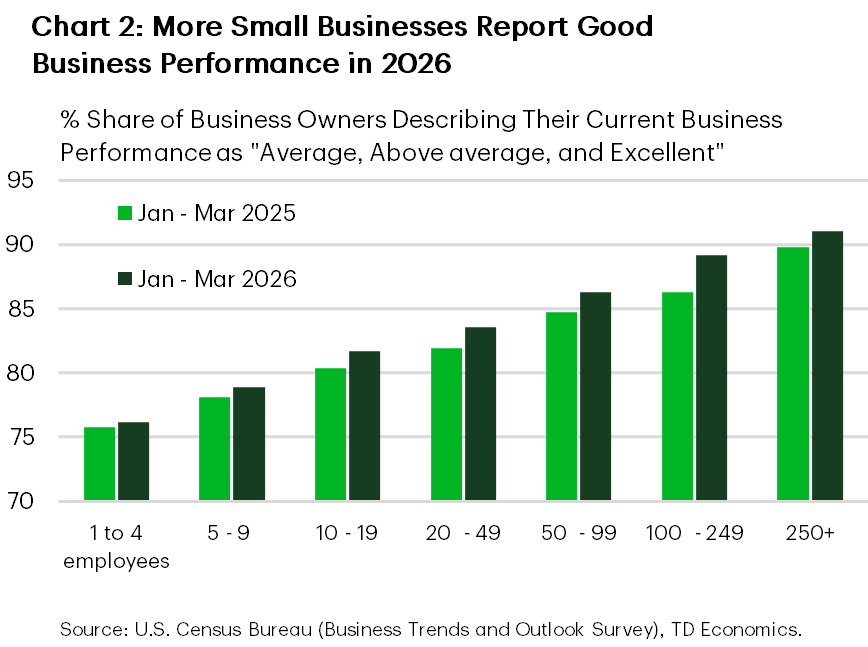
Last year, the proportion of business owners who thought that it was a good time to expand held at levels well above those seen in 2024 in the NFIB survey, with optimism about growth plans almost doubling (Chart 1). This optimism is likely rooted in robust business performance. In the opening quarter of 2026, a slightly larger share of small business owners—those employing fewer than 100 people—rated their business performance as average, above average, or even excellent relative to the same period of time last year (Chart 2), suggesting that small enterprises are holding their own in a constantly shifting economic landscape.
It also helps that despite the ups and downs, the economy continued to perform reasonably well. Economic growth averaged 2.8% in the second half of 2025 and was at 2% in the first quarter of 2026. Consumer spending also remained relatively resilient, with growth averaging 3.3% in H2 of 2025, and coming in at 1.6% in the first quarter of 2026. Reassuringly, inflation did not spike as much as initially feared when tariffs were announced, remaining at around 3%.
New Businesses Still Opening, but Tech Sector Downshifts
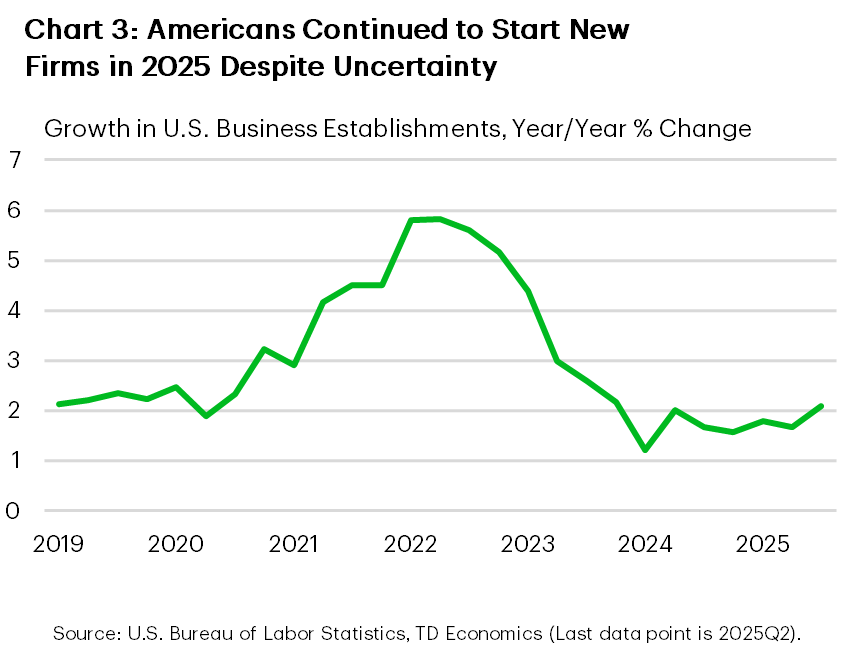
Despite uncertainty, Americans continue to launch new ventures. According to data from the third quarter of 2025, the number of business establishments increased by 250,000 (or 2.1%) compared to the same period previous year. This growth is consistent with 2024 and remains close to pre-pandemic level back in 2019, though it’s slower than the rapid expansion seen immediately after the pandemic (Chart 3). Building on this momentum, small businesses submitted more applications for Small Business Administration loans in fiscal 2025, with approved applications rising by 11% and the total approved loan amount increasing by 20% compared to the previous year.1
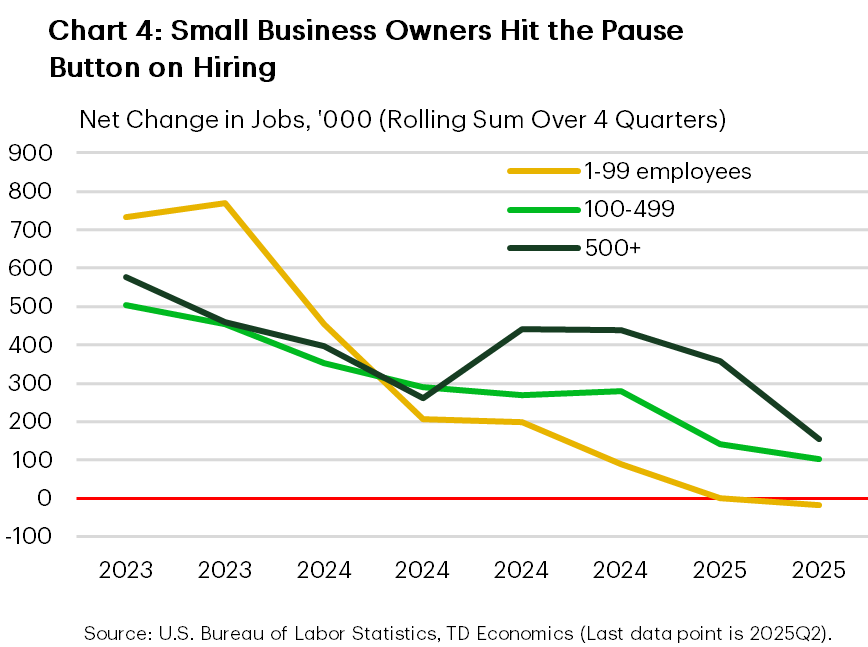
While new businesses are still being created, employment data shows that small businesses (those with fewer than 100 employees) have hit the pause button on hiring, while medium-sized and other small firms have continued to expand their workforces, although at a slower pace than before (Chart 4). Very small firms – those will less than 10 employees – have been outright reducing their payrolls. This may be because new firm creation has not kept pace with firm closures for very small firms.
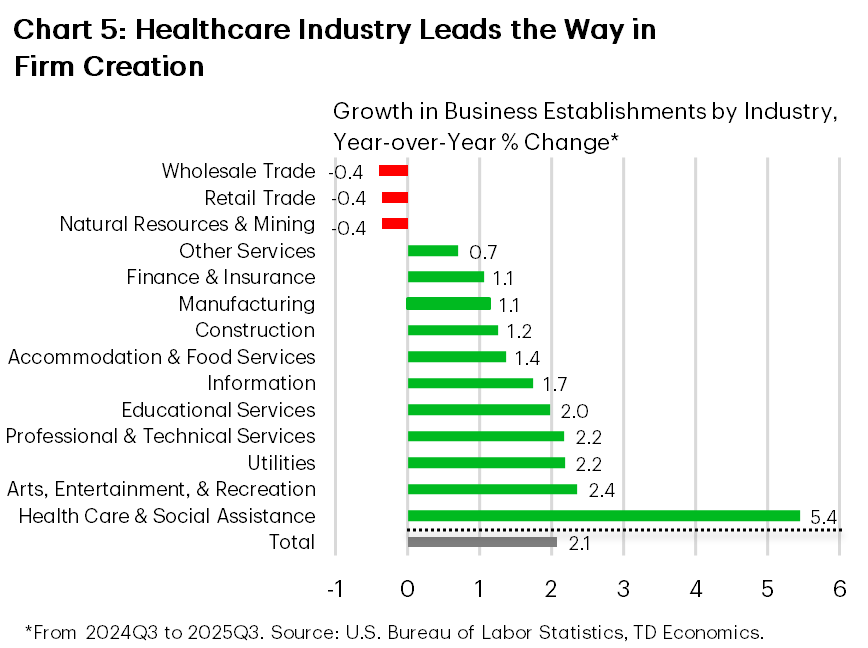
Growth in new businesses was widespread across industries. However, two industries, healthcare and professional & technical services, stand out, accounting for two-thirds of all new business establishments last year. The healthcare and social assistance industry led the way (Chart 5). The number of healthcare establishments rose by 111,000, representing nearly half of all new businesses created in the 12 months up to the third quarter of 2025. Nearly three-quarters of these new establishments were in social assistance, particularly services for the elderly. The number of Americans over the age of 75 has risen 25% since 2019, driving increased demand for support services. This growth in medical and social assistance establishments aligns with the labor market data, with the healthcare sector being responsible for most of last year’s job gains.
The broad professional & technical services category, which spans industries such as legal and accounting services, as well as software, scientific and engineering firms, was another major contributor, creating 15% of all new firms, even though it ranked fifth in growth rate. Arts & entertainment was the second fastest-growing segment, but due to its relatively small size, it contributed only 5% of new businesses created last year.
In contrast, three industries experienced increased business closures. Retail and wholesale trade, as well as natural resources & mining, saw fewer businesses operating, with firms in these industries facing various challenges ranging from tariff uncertainty to weaker consumer demand, and rising costs.
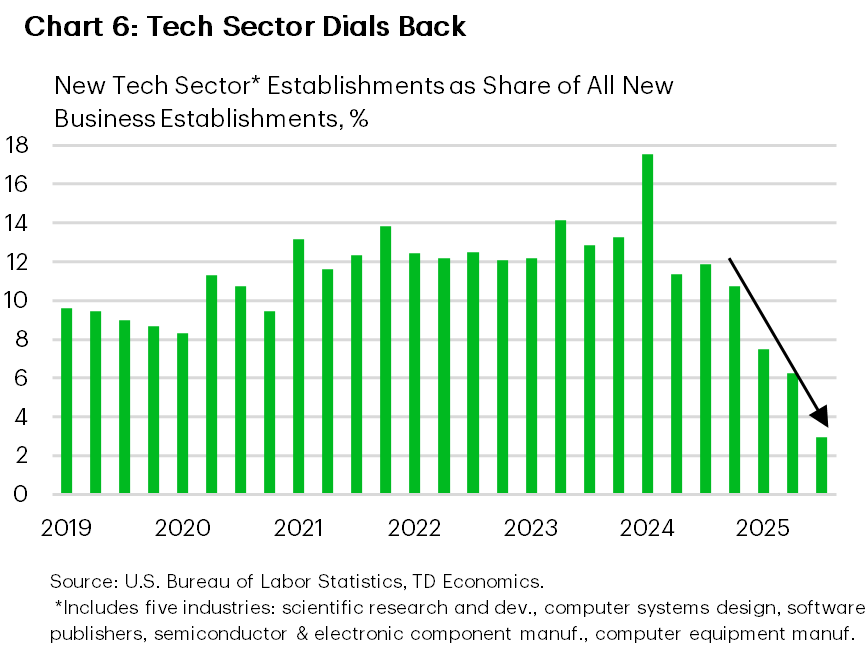
Despite dominating news headlines, the AI and tech sectors saw their contribution to new firm creation noticeably diminish last year—even though these industries continued to add new businesses. Between 2021 and 2023, AI and tech-intensive industries generated an average of 13% of all new businesses. However, their share fell to just 2.9% in the third quarter of 2025 (Chart 6).
New Year – Old Problems
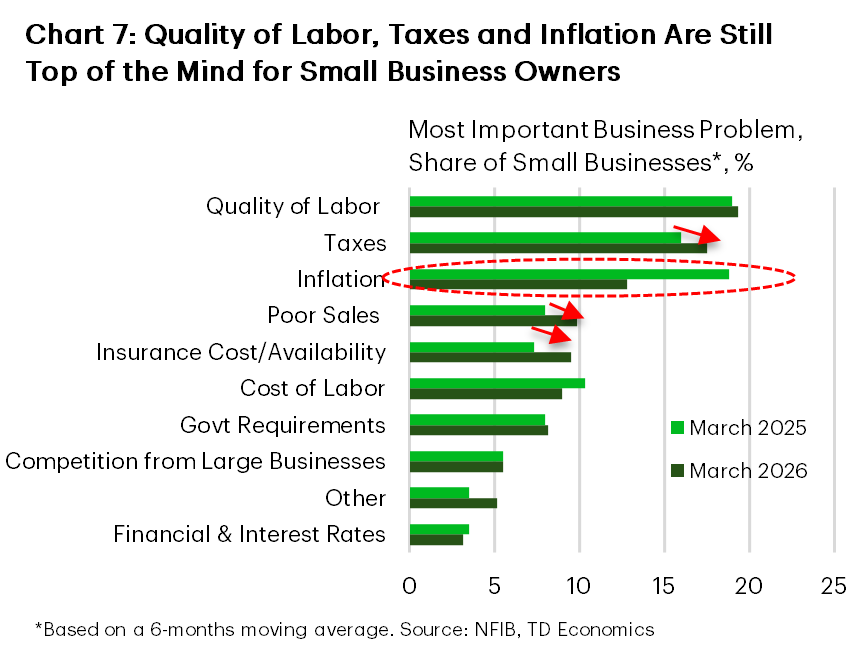
Despite all the policy uncertainty last year, the number one concern for small business was “the quality of labor”, followed by taxes and then inflation (Chart 7). Interestingly, despite higher tariffs and the potential for higher prices, worries about inflation eased noticeably over the past year, although they remained prevalent. More stable inflation and falling gas prices throughout 2025 were likely behind this change. However, the recent spike in oil prices on the back of U.S./Israel-Iran war threatens to reverse this dynamic this year. A recent NFIB survey shows that for over 80% of small businesses energy costs significantly impact their business2.
According to the latest NFIB survey, worries about poor sales as well as the cost and availability of insurance both increased compared to the previous year (Chart 7). Rising concerns about sales likely stem from slowing consumer spending amid a softening labor market and an expanding K-shaped divide in financial well-being among U.S. households. While some consumers are enjoying gains in wealth, wages, and employment, those at the lower end of the spectrum are feeling increasingly squeezed (see report).
Insurance-related worries are likely in part driven by sharply rising health insurance premiums. The New York Fed’s business survey found that health insurance was the fastest-growing cost category for regional businesses last year, surging by 13–14%3. The expiration of enhanced premium subsidies for the Affordable Care Act (ACA) marketplace—introduced in 2021 and ending last year—has further exacerbated insurance concerns among small businesses that are quite exposed to it. Research shows that nearly half of all adults enrolled in individual ACA coverage are either employed by a small business with fewer than 25 workers, are self-employed entrepreneurs, or are small business owners4. As a result, small businesses face significant exposure to the reduction in ACA subsidies this year.
The expiration of enhanced subsidies will lead to a substantial increase in health insurance premiums for these individuals, with average out-of-pocket costs projected to rise by over 75%5. This jump will be costly for self-employed workers and employees of small businesses who purchase their insurance through the marketplace. As a secondary effect, surging healthcare costs could drive workers to demand higher wages to offset medical expenses, intensifying competition with larger firms that are more likely to offer health insurance—potentially at lower costs—to their employees.
AI Brings Opportunities for Small Businesses
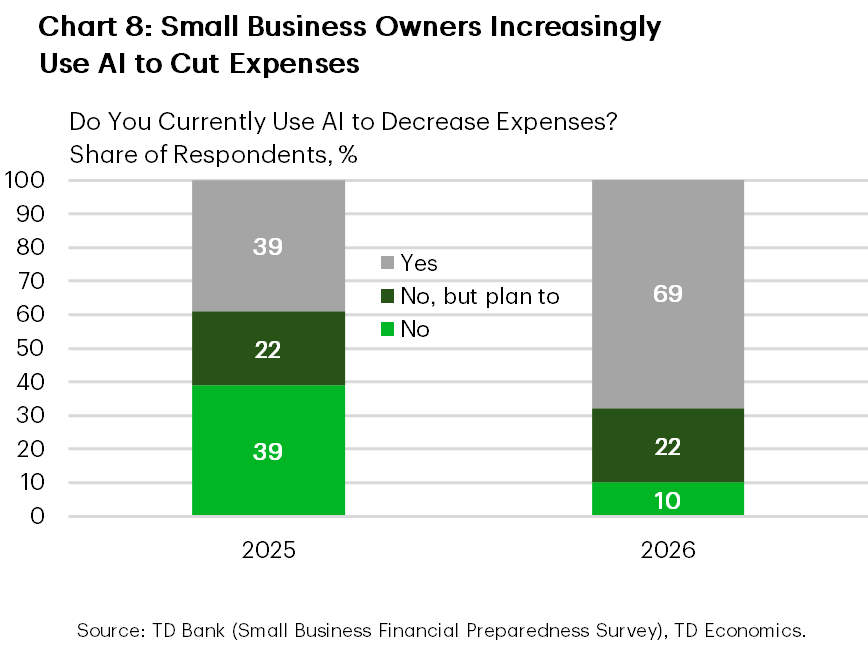
While small businesses face plenty of challenges, there are also emerging opportunities. AI technology is offering ways to address some of the most pressing pain points, such as the quality of labor, rising costs, and concerns about sales. According to the recent TD Bank survey, 69% of small business owners are using AI to decrease their business expenses this year – a notable increase from just 39% during the same period last year (Chart 8). Another report from the U.S. Department of Commerce shows that the AI usage rate among small business has more than doubled between 2023 and 2025 with 58% of small businesses reporting the use of AI in 2025, up from 23% in 2023.6
Most small businesses surveyed are also optimistic about the impact of AI on their operations, with 80% believing that AI will benefit their business in the future, a 20 percentage points increase from the previous year.7 Notably, small business owners actively using AI are seeing tangible positive results, with over 80% reporting increases in sales, profits, and payrolls. There was also a notable increase in the number of AI-using businesses who credited AI for helping them navigate supply chain difficulties and cope with inflation.
Sunnier Days Ahead?
After several years of above-average business creation in the post-pandemic period, the last two years saw the rate of firm creation return to its long-term trend of approximately 2% year-over-year (Chart 3). However, there is potential for an acceleration in both business creation and expansion, as well as increased capital investment, fueled by significant, business-friendly tax changes in the One Big Beautiful Bill Act (OBBBA), ongoing deregulatory efforts, and the rising implementation of AI across most industries.
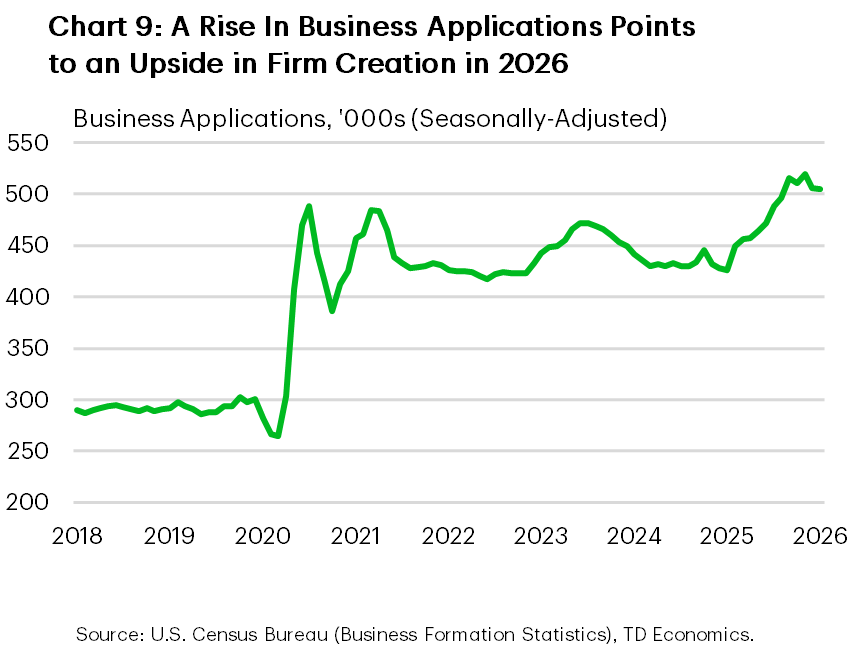
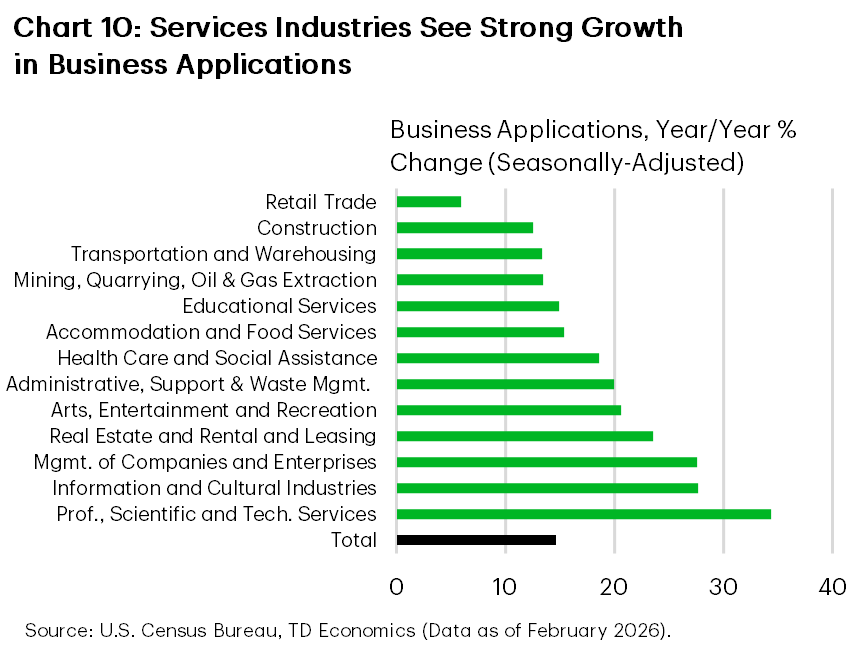
Recent business application data show a notable uptick in the second half of last year and at the start of 2026, suggesting a possible upside for firm creation this year (Chart 9). Several industries recorded impressive, double-digit growth in business applications compared to the previous year. Professional, scientific, and technical services led the pack, with applications surging by 34%, accounting for nearly one-third of the overall increase in total applications. Beyond the outsized contribution from the professional and tech sectors, numerous other service-focused industries also experienced strong growth in business applications (Chart 10).
The OBBBA contains several provisions poised to benefit small- and medium-sized business owners through substantial tax relief. One of the measures is an increase in the State and Local Tax (SALT) deduction limit from $10,000 to $40,000 until 31 December 2029. This change is especially advantageous for small businesses—such as limited liability companies, S-corporations, and partnerships, particularly those based in high-tax states, as it lowers the tax burden and frees up resources for reinvestment in their operations.
The OBBBA also brings additional tax benefits on business investment which will be broadly positive for all businesses. The permanent restoration of 100% Bonus Depreciation—which was scheduled to decrease to 20% in 2026 and expire in 2027—enables businesses to deduct the full cost of capital investments (including machinery, equipment, AI related hardware and vehicles) in the first year. This measure reduces the after-tax cost of new equipment, making automation investments more attractive for small and medium-sized enterprises.
Similarly, the Act now allows for the immediate expensing of 100% of domestic research & development (R&D) costs, rather than spreading them over five years as previously required (although this option remains available)—an important boost for R&D-intensive sectors such as technology and biotech. Additionally, the legislation makes the Qualified Business Income (QBI) deduction permanent (originally set to expire at the end of 2025), which allows businesses like limited liability companies, partnerships, and S-corporations to deduct 20% of their profits when filing taxes, thereby retaining a larger share of their earnings.
Moreover, a variety of other measures could further support small business owners. For example, the enhanced Childcare Credit enables businesses with gross receipts under $32 million to claim a credit for 50% of qualified daycare costs (up from 25% previously), helping to attract and retain talent, mitigating broader labor cost pressures, such as rising health insurance coverage.
The proposed AI Workforce Training Act—though not yet adopted—is another development to watch; if implemented, it would assist small businesses in reskilling their workforce for AI tools by providing a 30% tax credit for related training expenses, up to $2,500 per employee.
All in all, while challenges remain, the combination of targeted tax measures, ongoing deregulation, and increased adoption of AI technologies positions small- and medium-sized businesses for a more optimistic outlook and new opportunities for growth and expansion in the coming years.
Bottom Line
Small businesses are proving resilient amid ongoing economic uncertainty, leveraging new opportunities even as they contend with challenges like inflation, rising healthcare costs, and labor quality concerns. The increasing adoption of AI, alongside business-friendly tax policies, is setting the stage for renewed optimism and potential growth across sectors. While volatility remains a reality, tax policy changes and technological advancements are setting the stage for American small businesses to expand in the years ahead.
End Notes
- Small Business Administration. 7(a) & 504 Activity Reports: FY2025 Year End. https://data.sba.gov/dataset/7-a-504-activity-reports-fy2025-year-end
- Small Business Energy Survey, February 2026. NFIB. https://www.nfib.com/wp-content/uploads/2026/02/NFIB-2026-Energy-Survey.pdf
- Federal Reserve Bank of New York. Jaison R. Abel, Richard Deitz, and Nick Montalbano. “ What’s Driving Rising Business Costs?” March 4, 2026. https://libertystreeteconomics.newyorkfed.org/2026/03/whats-driving-rising-business-costs/
- Matt McGough, Gary Claxton, Matthew Rae, and Cynthia Cox. KFF. “About Half of Adults with ACA Marketplace Coverage are Small Business Owners, Employees, or Self-Employed”. September 10, 2025. https://www.kff.org/affordable-care-act/about-half-of-adults-with-aca-marketplace-coverage-are-small-business-owners-employees-or-self-employed/
- Committee for a Responsible Federal Budget. “Understanding the ACA Subsidy Discussion”. Nov 5, 2025. https://www.crfb.org/blogs/understanding-aca-subsidy-discussion
- “Empowering Small Business: The Impact of Technology on U.S. Small Business” https://www.uschamber.com/assets/documents/20251621-CTEC-Empowering-Small-Business-Report-2025-v1-r10-Digital-FINAL.pdf
- “Empowering Small Business: The Impact of Technology on U.S. Small Business” https://www.uschamber.com/assets/documents/20251621-CTEC-Empowering-Small-Business-Report-2025-v1-r10-Digital-FINAL.pdf
Disclaimer
This report is provided by TD Economics. It is for informational and educational purposes only as of the date of writing, and may not be appropriate for other purposes. The views and opinions expressed may change at any time based on market or other conditions and may not come to pass. This material is not intended to be relied upon as investment advice or recommendations, does not constitute a solicitation to buy or sell securities and should not be considered specific legal, investment or tax advice. The report does not provide material information about the business and affairs of TD Bank Group and the members of TD Economics are not spokespersons for TD Bank Group with respect to its business and affairs. The information contained in this report has been drawn from sources believed to be reliable, but is not guaranteed to be accurate or complete. This report contains economic analysis and views, including about future economic and financial markets performance. These are based on certain assumptions and other factors, and are subject to inherent risks and uncertainties. The actual outcome may be materially different. The Toronto-Dominion Bank and its affiliates and related entities that comprise the TD Bank Group are not liable for any errors or omissions in the information, analysis or views contained in this report, or for any loss or damage suffered.
Download
Share: