The Business of America Is Small Business:
Heeding the Lessons of The Pandemic
Maria Solovieva, CFA, Economist | 416-380-1195
Date Published: April 8, 2021
- Category:
- U.S.
- Business Investment
- Labor
Highlights
- The pandemic has had disproportionate impact on small businesses (fewer than 500 employees) especially the significant share concentrated in high-contact service industries.
- Support programs have helped to reduce the number of business failures and kept many businesses on financial life support. This has allowed small businesses to participate in the jobs recovery to date.
- There is still a long road ahead. Policy makers may need to continue to update the design of programs to support small enterprises once the pandemic ends.
- The American entrepreneurial spirit is alive and well. New business formation has increased throughout the pandemic as the economic disruption has created both challenges and opportunities.
- With the right policies, the health crisis could prove a watershed moment for American entrepreneurship, reigniting small business activity in the post-pandemic world and invigorating business dynamism.
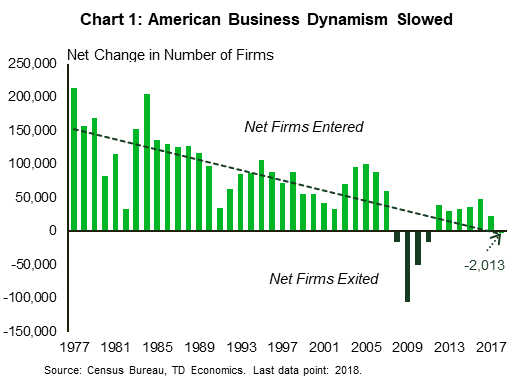
Entrepreneurship is the backbone of the American economy, fueling innovation, widening opportunity and driving job creation. Unfortunately, business dynamism has been declining over the past several decades. The trend in net business formations has been downward since the 1970s (Chart 1).
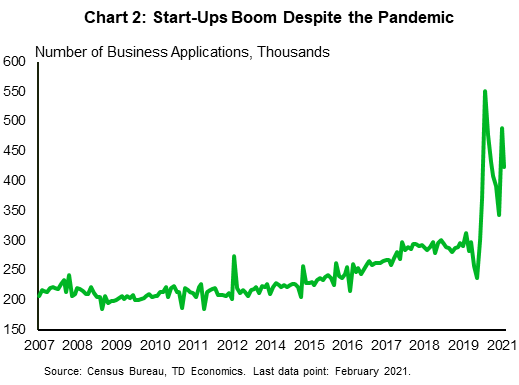
Recessions have tended to exacerbate this trend – especially the 2008-2009 financial crisis – but the COVID-19 recession has been unique and may just have bucked it. Indeed, after declining early in the pandemic period, new business startups have rebounded sharply since the summer and were up by 850,000 or 24% on average in 2020 – the highest on annual number on record (Chart 2).
Still, the pandemic has had disproportionate negative impact on small businesses concentrated in high-contact industries. Government support programs, including the U.S. Small Business Administration’s Paycheck Protection Program (PPP), have helped many of these businesses stay afloat and prevented a notable rise in business failures to date, but it is, as of yet, unclear how many of them will make it to the other side of the health crisis.
Once the pandemic eases, the profits unleashed by pent-up demand should breathe new life into entrepreneurship and kick-start rehiring, reducing the need for government support. With any luck, the strong economic recovery will lead to a new trend in business formation and dynamism in the United States
The Pandemic’s Effect on Small Businesses
When the pandemic led to widespread lockdowns in the spring of 2020, it disproportionally hit economic sectors where people work and serve customers in close proximity. To a large extent, these sectors are made up of smaller firms.1
Collectively, high-contact sectors contributed to approximately 45% of the decline in GDP at the peak of the crisis in the second quarter. Their contribution to the decline in employment was greater – around 60%. Overall, across industries, businesses with fewer than 250 employees made up 50% of the jobs lost in the first half of 2020, while businesses with fewer than 500 made up 57%. This is roughly in line with their overall share of employment.
The labor market typically takes longer to recover than GDP and healing here will ultimately determine the success of the recovery. Fortunately, there is evidence that small businesses are leading the way. According to payroll data from Automatic Data Processing (ADP), businesses with fewer than 50 employees have recovered over 70% of the jobs lost during the initial lockdown period, while businesses with fewer than 500 employees have recovered about 65%. Larger businesses (with greater than 500 employees) have lagged slightly, recovering just under 45% of the jobs shed.
The recovery in jobs is in part due to fiscal support programs. To mitigate a detrimental impact of the pandemic, the federal government introduced two major programs: the Pandemic Unemployment Assistance (PUA), which provided income replacement to sole proprietors and contractors who typically don’t qualify for unemployment insurance, and the Paycheck Protection Program (PPP) to cover labor costs for payroll businesses and net profits of sole proprietors. As of February, the PUA has provided roughly $100 billion in support, while, as of writing, the PPP has dispersed over $700 billion (see Text Box).
Access to Credit Still Harder for Small Businesses
Policy supports have been essential in preventing business failures, but access to credit has still been more of a challenge for smaller businesses relative to their larger peers. As large firms have a greater ability to provide collateral, pay more fees and negotiate flexible credit conditions, they also have greater access to credit, even in cases when the credit is, strictly speaking, a subsidy. Additionally, established corporations can tap the bond market, which has been growing strongly, thanks to accommodating capital markets and strong demand from investors following Fed interventions early on in the crisis.
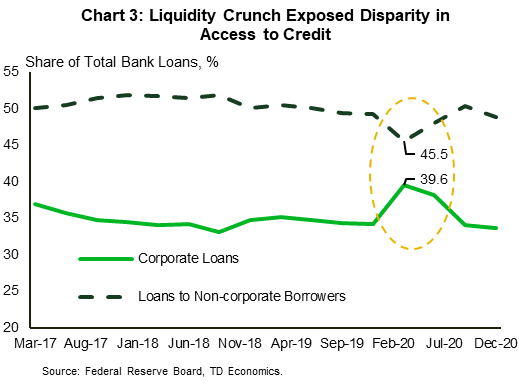
In contrast, small enterprises typically face more restricted access to credit. Research by economists at the New York Fed indicates that small firms had a harder time accessing liquidity during the COVID-19 pandemic.2 Non-corporate borrowers typically account for roughly half of all commercial and industrial lending (Chart 3). Their share declined abruptly in the first quarter of 2020 during the widespread credit and liquidity crunch, coinciding with almost one-to-one offset in the share of corporate borrowers. This suggests that corporations were able to draw on existing credit lines, while non-corporate firms had a harder time getting funding when they needed it most.
Few Signs of Financial Stress…Yet
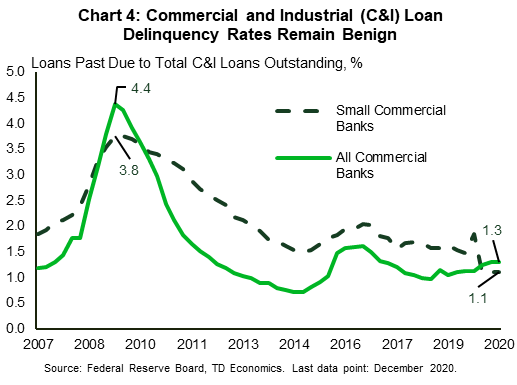
Despite these challenges, there are few immediate signs of financial scarring in the business community. Indeed, relative to 2019, total commercial bankruptcy filings are down 17%, with chapter 13 filings (used by sole proprietors who are personally responsible for both individual and business debts), down by 45%. Commercial filings under chapter 7, which are used when the company permanently closes its doors, declined 16% year-on-year. There is one fly in the ointment, however. Business bankruptcies under chapter 11 were up 29% in 2020. Still, this type of bankruptcy, which is typically more expensive, is used when companies seek to restructure current obligations while remaining operational, implying that they may become profitable in the future. Meanwhile, other credit risk indicators – commercial loan delinquency and charge-off rates for example – have been stable and even declined at smaller community banks, which tend to tailor their services to smaller businesses (Chart 4).
Indeed, on aggregate, companies were able to accelerate their debt accumulation without raising many red flags. American businesses added $1.3 trillion of debt in 2020 and reaching the historical high of $17.6 trillion in the second quarter before levelling off by the end of the year. Roughly half of new debt may be forgiven as part of PPP.
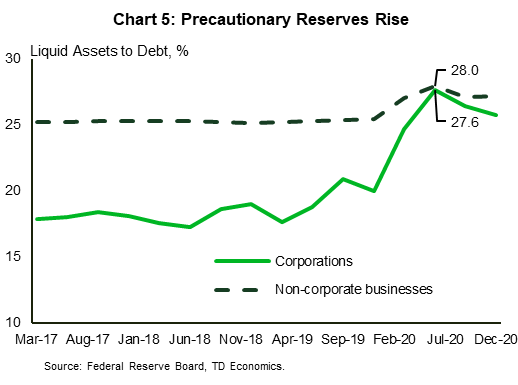
Furthermore, some of this debt was raised to build precautionary savings rather than support operations. Chart 5 demonstrates that ratios of liquid assets to debt have improved since the pandemic, especially for large corporations. Unincorporated businesses that traditionally hold more precautionary reserves, had a far more moderate improvement in liquidity, indicating that most borrowings were redeployed into operations.
Financial Challenges Exist
Even while failures have been avoided, businesses have faced financial difficulties. Indeed, according to the SBCS, 80% of small businesses owners experienced personal financial challenges. To mitigate them, 63% of owners did not draw a salary or reduce their salary, 51% paid business expenses with their personal funds and 37% borrowed against home equity, pension or from friends and family. These transactions would not be reported as non-corporate liabilities but would appear as part of household debt.
At the same time, larger corporations, which have seen the biggest increases in debt, may be vulnerable, especially if interest rates rise more than anticipated A recent note by S&P Global Ratings cautions that “excess liquidity could become problematic, as soaring debt could lead to more defaults and lower recovery rates, and ultimately a drawn-out default cycle.” They predict that U.S. speculative-grade corporate default rate could rise from 9% to 12% by September 2021, up from 6.4% in November of last year.6
Thankfully, broad government stimulus (including personal income support measures) have alleviated some of the financial burden. Our analysis suggests that without it, pandemic-related economic stress could have resulted in business loan delinquency rates reaching 6% by the second quarter of 2020, two tenths of a percentage point higher than during the Global Financial Crisis. High delinquency rates would likely have resulted in tighter business credit conditions, further worsening the downturn.
The New Normal
Emergency funding and government supports have kept many businesses from failing, but it is, as of yet, unclear how many of them will reopen fully as the pandemic comes to a close. At present, it is difficult to estimate how many businesses closed due to the pandemic. The Census Bureau data has not been released yet, while experimental high-frequency statistics do not differentiate between temporary and permanent closures. According to the website Womply.com, a high frequency data source for small businesses used by researchers to gauge the impact of the pandemic, restaurant transactions have declined by 30% since the start of the pandemic, but some of them may have temporarily shifted to food delivery platforms not captured by the data provider.7
As the economy reaches a more sustained re-opening stage, the ability of existing and new businesses to meet the pickup in demand will be an increasingly important driver of the pace of economic recovery. The food and accommodation services sector is probably the most prominent example of an industry facing considerable post-pandemic challenges. The majority (60%) of this sector consists of small businesses that generate lower-than-average gross margins. For these businesses, the prospect of operating at lower-capacity and higher-cost may not be feasible. In 2019, the accommodation and food services sector accounted for 11% of all employed, but since then, it has lost approximately 2.5 million (or 30%) of all workers. Getting these jobs back will be key to the labor market recovery.
However, there are reasons for optimism. First, the changes to the PPP-2 program may result in more rehiring in hard hit sectors such as accommodation and food services. There is evidence of progress on this front, with the sector’s share of new loans more than doubling (from 8% to 17%). Should the sector’s current share remain constant by the end of the program, accommodation and food services will receive more than $90 billion in total support. Additional $30 billion in tax-free grants that can be used for payroll expenses have just been authorized under the new Restaurant Revitalization Program (part of the American Rescue Plan). The goal of this program is to compensate restaurants and bars for reduced revenues in 2020, while prioritizing businesses owned by women, veterans, or the “socially and economically disadvantaged.”
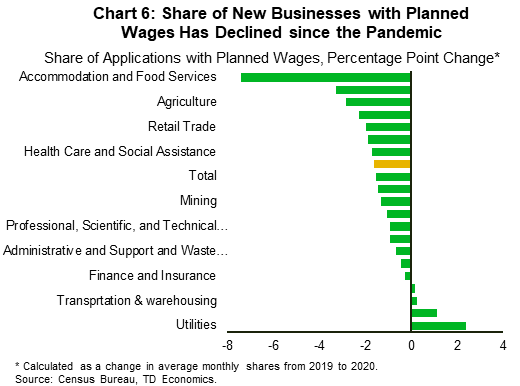
Second, startups should help to fill the existing employment gap. A recent expansion in new business entries resulted in an impressive 24% year-on-year growth. The accommodation and food services sector, which usually tends to have a high propensity of turning into employer businesses, increased by 20% last year. Still, progress may take time. The average share of businesses with planned wage expenditures fell more than seven percentage points relative to last year within this industry. This likely reflects the ability of new businesses to operate leanly during the pandemic but may also suggest that more needs to be done to help these firms become profitable enough to support employment on a more sustained level.
The reduction in the share of businesses that intend to pay wages warrants monitoring as it affected 16 out of 20 categories (Chart 6). Recent research by the U.S. Census Bureau suggests that the pandemic may have changed the composition of new business applications in favor of lower-contact industries, such as online retail, information technology, delivery services etc.8 If proved to be permanent, this compositional shift may result in a slower rate of job creation from new business formation than in the past.
Bottom Line
Pandemic-induced economic disruptions have had a devastating effect on American entrepreneurship. The fallout affected economic sectors that are predominately operated by small enterprises, making their positions more precarious. Despite unprecedented fiscal efforts, many small firms have had to rely on personal finances and alternative sources of financing to stay afloat.
The recently passed American Rescue Plan contains several elements to support small businesses, including $15 billion in grants to help the hardest hit businesses and $35 billion in equity investment to generate $175 billion in small business loans through state and local financing programs. As part of the $220 billion in state and local funding, authorities can use their discretion to allocate additional assistance to small businesses impacted most by the pandemic.
Expedient funding will help existing businesses rehire workers and restore their operational capacity for when the economy reopens fully. In the meantime, the rise in new business startups signals that the American entrepreneurial spirit is alive and well. In a booming economy, it should provide fertile ground for job growth. With the right policies, the health crisis could prove to become a watershed moment for American entrepreneurship, reigniting small business activity in the post-pandemic world and invigorating business dynamism for years to come.
Text Box: Keeping People Employed
The Paycheck Protection Program was signed into a law on April 24, 2020 and was extended with the signing of second stimulus package on December 27, 2020. The program provides loans to businesses to help cover their expenses for 24 weeks after the disbursement. The size of the loan is calculated as 2.5 times monthly average payroll up to a maximum of $2 million. No payment is required until either loan forgiveness is granted or 10 months after the 24-week covered period. To be forgiven, at minimum 60% of the loan should be used to fund payrolls, the rest can be used on operational expenses. If forgiven, the loan effectively turns into a tax-free grant.
The first round of the program, which ended in July, provided over five million loans worth more than $520 billion. The SBA did not estimate how much of this was provided to smaller enterprises, but back-of-the-envelope calculations suggest that for small businesses with employees, the maximum loan was approximately $95,000, on average.3 The SBA reported that 82% of all PPP loans were for less than $100,000, but only accounted for 21% of overall lending volume or roughly $110 billion of the total.
The program attracted criticism for providing disproportional benefits to larger businesses and firms in areas less economically hit by the pandemic. But arguably, the program’s overarching goal of keeping American workers employed was achieved. According to a preliminary evaluation of the PPP completed by the MIT Department of Economics, the program boosted employment at eligible firms by between 2% and 4.5%.4 Despite that, there is not a consensus on whether the program was successful in supporting small businesses. The Small Business Credit Survey (SBCS) conducted by the Federal Reserve suggests that 82% percent of employer firms applied for PPP loans, of which 77% received all the funding they sought. Yet, according to the research by the Opportunity Insights team, employment rates at firms with fewer than 500 employees increased by only two percentage points after the PPP was enacted.5
Some of the lack of take up may be explained by the complexity of the program. According to the SBCS, of those small businesses that did not apply, 40% thought they would not qualify for the loan or forgiveness, almost a quarter of owners were confused by the program, while roughly one fifth of firms had already laid off employees or missed the deadline.
The latest stimulus package excludes public companies and has additional small business provisions. For example, $25 billion of PPP-2 funding is allocated to firms with 10 or fewer employees, which account for approximately 6% of overall employment and 4% of private payrolls. The second round also offers a greater support to firms in Accommodation and Food Services, making them eligible for bigger loans (3.5 times monthly average payroll). Furthermore, as of February 24, the Biden administration created a competitive advantage for businesses and non-profit organizations with fewer than 20 employees by opening an exclusive 14-day PPP lending window to these firms.
These changes appear to have been successful in making the program more aligned with the share of small business’s contribution to the economy. At the time of writing, the SBA reported that 34% of all loan volumes were distributed to businesses with fewer than ten employees and 13% went to low- and moderate- income communities as well as firms with less than $250 thousand in annual sales. The second draw of the PPP provided loans with total value of over $210 billion and average loan size of $60,000 (almost half the size of an average PPP-1 loan).
End Notes
- According to the Census Bureau, there were 30.8 million small businesses in the U.S. in 2017, 99% of which employ fewer than 500 employees. Approximately 80% percent of small firms are “non-employer” businesses, the remainder provide 48% of all U.S. employment. In addition to the employment size, U.S. Small Business Administration defines small businesses by annual receipts. Standards’ type and size vary by industry. See more here: https://www.sba.gov/federal-contracting/contracting-guide/size-standards
- For example, see: https://libertystreeteconomics.newyorkfed.org/2020/10/weathering-the-storm-who-can-access-credit-in-a-pandemic.html
- Calculated using 2017 Census Bureau’s Statistics of U.S. Businesses (SUSB), adjusted for inflation. Doesn’t include non-employee firms, for which we estimate an average loan amount to be much smaller – approximately $3,000 (calculated using 2015 Internal Revenue Service’s Statistics of Income (SOI), adjusted for inflation)
- Autor, David, David Cho, Leland D Crane, Mita Goldar, Byron Lutz, Joshua Montes, William B Peterman, David Ratner, Daniel Villar, and Ahu Yildirmaz. “An Evaluation of the Paycheck Protection Program Using Administrative Payroll Microdata,” Technical report, July 22nd, 2020. http://economics.mit.edu/files/20094
- Chetty, Raj, John N Friedman, Nathaniel Hendren, Michael Stepner, and The Opportunity Insights Team, “How Did COVID-19 and Stabilization Policies Affect Spending and Employment? A New Real-Time Economic Tracker Based on Private Sector Data,” Working Paper 27431, National Bureau of Economic Research June 2020. https://www.nber.org/system/files/working_papers/w27431/w27431.pdf
- See “U.S. Corporate Credit Outlook 2021, Economic And Political Transition”, S&P Global Ratings, January 21, 2021.
- Womply.com data is also used by the Opportunity Insights index to measure small business activity.
- Dinlersoz, E, Dunne, T, Haltiwanger, J, Penciakova, V, “Business Formation: A Tale of Two Recessions”, U.S. Census Bureau, January 2021, https://www2.census.gov/ces/wp/2021/CES-WP-21-01.pdf
Disclaimer
This report is provided by TD Economics. It is for informational and educational purposes only as of the date of writing, and may not be appropriate for other purposes. The views and opinions expressed may change at any time based on market or other conditions and may not come to pass. This material is not intended to be relied upon as investment advice or recommendations, does not constitute a solicitation to buy or sell securities and should not be considered specific legal, investment or tax advice. The report does not provide material information about the business and affairs of TD Bank Group and the members of TD Economics are not spokespersons for TD Bank Group with respect to its business and affairs. The information contained in this report has been drawn from sources believed to be reliable, but is not guaranteed to be accurate or complete. This report contains economic analysis and views, including about future economic and financial markets performance. These are based on certain assumptions and other factors, and are subject to inherent risks and uncertainties. The actual outcome may be materially different. The Toronto-Dominion Bank and its affiliates and related entities that comprise the TD Bank Group are not liable for any errors or omissions in the information, analysis or views contained in this report, or for any loss or damage suffered.
Download
Share this: