Highlights
- The U.S. consumer has been a stalwart engine of growth over the past year, contributing to surprising strength and resilience of the economy. However, there has been a downside to buoyant consumer spending – growing debt and delinquency levels.
- Auto and credit card debt and delinquency in particular have surpassed their pre-pandemic levels as consumers cope with high prices in the aftermath of multi-decade high inflation. While it is clear that some consumer segments, namely younger, lower-income and lower credit score borrowers, are facing greater financial stress resulting in higher delinquency rates, the overall picture is not too troubling.
- Our analysis suggests that while credit card delinquencies are likely to rise further before coming back down, they are unlikely to rise to levels that signal cause for concern. Additionally, auto delinquencies, which have already risen quite notably, are not expected to rise too much further. As such, rising delinquencies, while they do require monitoring are not quite sounding alarm bells.
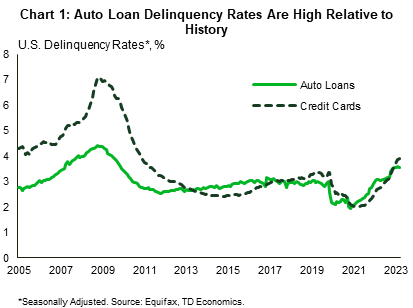
After being the key driver of U.S. economic resilience last year, some recent indicators suggest that the consumer bulwark of the U.S. economy is starting to stumble. Delinquency rates on car loans and credit cards edged above pre-pandemic levels in the third quarter (Chart 1), suggesting an increasing number of households are struggling to pay their bills. In this report we assess whether rising consumer loan balances and associated delinquencies are a foreboding bellwether for where the U.S. economy is headed, or just more hiccups as consumers adjust to the new post-pandemic reality of forbearances ending and pandemic savings drying up.
The Puzzle of Low Unemployment and Rising Delinquencies
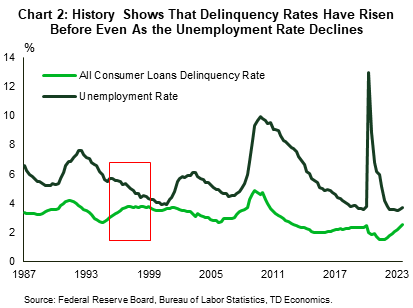
With the U.S. economy currently experiencing some of the lowest unemployment rates in over 30 years, it is somewhat surprising that consumer delinquency rates are currently on an uptrend. This is the opposite of the typical historical experience. In the available federal delinquency rate data going back to 1987, there was one period where a falling unemployment rate was accompanied by rising delinquencies (Chart 2). Between mid-1995 and the end of 2000, the unemployment rate fell from 5.7% to 3.9% while the delinquency rate for all consumer loans rose from 3% to 3.6%. While more lenient lending standards in previous years might have played a part, there was no other obvious reasons for the rise in delinquencies as economic and financial conditions during that period were generally favorable.1 This episode illustrates that there have been periods of rising delinquencies even with unemployment falling.
The current situation is also a bit atypical, given the unique circumstances stemming from the pandemic. The relationship between unemployment and delinquency rates broke down during the pandemic as fiscal stimulus programs targeted to households helped borrowers stay current on their obligations. These included temporary increases to unemployment benefits and debt payment deferral options on consumer loans such as student loans and mortgages. As these accommodations and supplementary income support measures expired, consumer loan delinquency rates began rising, despite the current low level of unemployment. What’s more, while the unemployment rate remains historically low, interest rates on consumer loans (thanks to tighter monetary policy) are historically high. Additionally, the economy is coming out of a period of rapidly rising inflation which also resulted in higher prices for most consumer items. The rising delinquencies that we are currently seeing therefore may actually more accurately reflect those factors (i.e., high rates and high prices), rather than creditors employment situation (i.e., low unemployment rates), and can be characterized for the most part as more of a dynamic related to normalization rather than an alarm bell.
The Credit Card Crunch
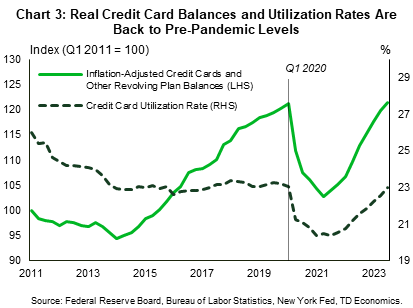
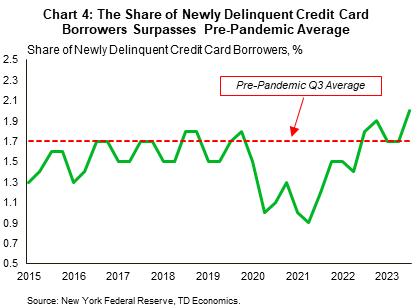
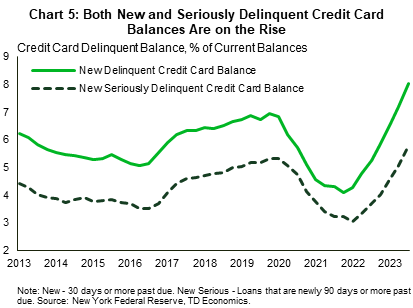
Scratching beneath the surface of headline delinquency rates shows that credit card delinquencies may have early signs of a problem. Consumers’ piggy banks of pandemic-era savings are increasingly empty (see latest economic forecast), and they are relying increasingly more on their credit cards. Meanwhile, lenders continue to tighten standards thereby restricting access. The stellar spending performance in the third quarter was reflected in climbing credit card balances, which grew 10.2% q/q (annualized) in Q3 – its largest quarterly growth for the year. Meanwhile, overall household credit grew by only 0.7% (annualized) in the third quarter of 2023 relative to the previous quarter. This in part reflects a normalization in credit card utilization, but inflation-adjusted credit card balances are also on an upswing (Chart 3). Growing balances in themselves are not problematic, but rising delinquency rates suggest that at least some borrowers are having difficulties meeting their debt obligations. New York Fed data show that the number of borrowers (as a share of all borrowers) who became newly delinquent in 2023 Q3 rose to 2% from 1.7% in the previous two quarters (Chart 4). This is also higher than the pre-pandemic average (2015-2019) of 1.7%. What’s more, after a period of historically low delinquency rates observed during the pandemic, both new and serious credit card delinquencies (as a share of total outstanding balances) have also surpassed their immediate pre-pandemic levels (Chart 5).
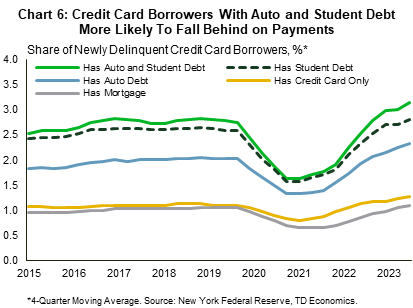
Consumers who hold multiple types of debt, but not a mortgage, are more likely to become delinquent on their credit cards than those who have credit card debt only. The share of mortgage holders who become newly delinquent on a credit card is only slightly higher than before the pandemic (1.2% vs 1.1%) as consumers with mortgages own homes and are able to tap their home equity if needed to avoid becoming delinquent. For those who hold both a student loan and auto debt, the transition rate into a new credit card delinquency is 0.6 percentage points (ppts) higher than it was prior to the pandemic (3.7% vs 3.1%) (Chart 6). With the resumption of student loan payments, the pressure on this group is only expected to mount further. Preliminary survey data from the Philadelphia Fed however is encouraging as it suggests that thus far, borrowers have largely been able to handle the resumption of student loan payments without too much additional financial stress.2
Rising Auto Delinquencies, the Result of a Perfect Storm
As shown in Chart 1, auto delinquencies have also been on the rise as a result of a combination of factors. Chief among these are the high prices for autos due to pandemic-related supply chain shortages. The value of newly originated auto loans, for example, jumped 19.1% y/y in 2021. For perspective, this is relative to 0.6% in 2020 and 1.8% in 2022. Given that the number of originations remained relatively consistent with its pre-pandemic average, the jump largely reflected the sharp increase in vehicle prices.
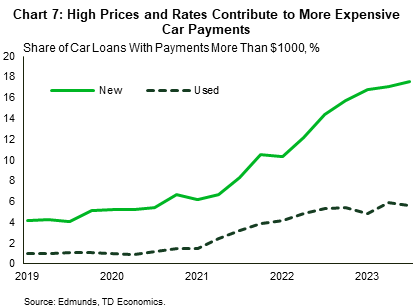
The effect of higher prices was further exacerbated by the credit score migration of borrowers due to various forbearance programs. The temporary financial relief during the pandemic improved consumers credit scores by making most delinquent borrowers current on their accounts. The New York Fed, for example, found that nearly 80% of student loan borrowers had higher credit scores by the end of 2021.3 The combination of high prices and credit score migration allowed many borrowers to access credit (which they otherwise might not have been able to) to purchase vehicles whose prices had risen significantly over a relatively short period of time. Additionally, with manufacturers focusing production on more expensive models, lower priced base models were largely unavailable, forcing some buyers to spend more than they otherwise would have out of necessity. Taken together, all these factors contributed to a perfect storm in the auto market. For those who purchased vehicles when interest rates started to rise, an already tenuous situation, was compounded further. Data from auto market data company Edmunds show that by 2023 Q3, the share of new car owners making monthly car payments in excess of $1000 rose to a new all-time high of 17.5% (Chart 7). The share surged amid rising car prices and interest rates.
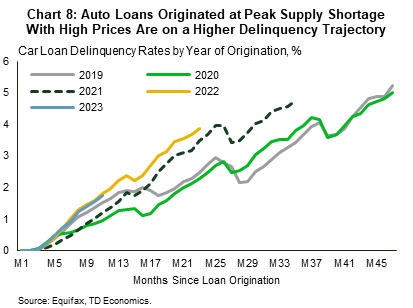
With auto prices now lower relative to the heights reached during the pandemic, and interest rates elevated, some car buyers who purchased during the pandemic now find that their vehicles are worth significantly less than is currently owed. This situation may have prompted some buyers to default, with a consequent rise in auto delinquency rates. In fact, auto loans originated at the height of the pandemic are showing greater levels of delinquency than those originated prior to it (Chart 8). Overall, as with credit cards, delinquency rates on autos fell notably during the pandemic, but since bottoming out in mid-2021 have risen significantly, with both rates surpassing their immediate pre-pandemic high. Auto delinquencies however have not only surpassed its immediate pre-pandemic high but is also high relative to its longer history. At 3.6%, auto loan delinquency rates are at levels last seen in 2010, as the economy emerged from the Great Recession (see Chart 1).
Credit Card and Auto Delinquency: The Path Ahead
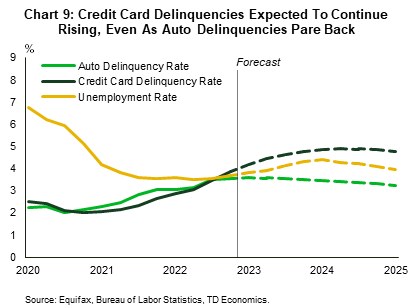
Going forward, we believe credit card and auto delinquencies will evolve differently. Credit card delinquencies are forecasted to rise further, particularly as unemployment rises, whereas auto delinquencies have likely hit their peak and are unlikely to rise further should unemployment increase. The difference stems from the possibility that the current rise in auto delinquencies may be due more to strategic defaults rather than directly related to a borrower’s ability to pay.4 Vehicles financed at relatively high prices during the pandemic may now be worth significantly less than the current loan value. As such, borrowers (some of whom may have over-extended themselves) may choose to default on the loans, rather than continuing to repay despite no change in their employment status. Given that in our forecast, the unemployment rate is expected to rise only slightly above its natural rate (i.e to a level that should not cause excessive dislocation in the labor market), the projected rise may not translate into further increases in the auto delinquency rate beyond its current level. Credit cards however are a revolving loan product consumers use for everyday purchases. As such, delinquencies are more closely tied to a borrower’s ability to repay, with any reduction in income more readily showing up in higher delinquencies. Because of the differing underlying dynamics between the two delinquency rates, we expect their response to unemployment going forward (over the next year) to also differ.
Further, auto delinquencies may be less responsive to the unemployment rate than credit card delinquencies, if people are less willing to become delinquent on their auto loans, as opposed to their credit cards should they become unemployed. A similar dynamic played out during the Global Financial Crisis, where some borrowers defaulted on their home loans, while keeping car payments current. A vehicle might be needed to acquire and attend a new job, so borrowers may be more willing to keep that account current, thereby preventing further increases to the auto delinquency rate should unemployment rise.
Using delinquency data from Equifax, our analysis, suggests that credit card delinquencies have further room to rise, while auto delinquencies likely will not. Modelling auto and credit card delinquencies as a function of their past value, the unemployment rate and a measure of income, the results suggests that the credit card delinquency rate is likely to rise to around 5% by 2024 Q4 (from its current 3.9% level as of 2023 Q3). This is also its peak before it starts declining – a path similar to our unemployment rate forecast, which also peaks at the end of 2024. The profile for auto loan delinquencies is different. Here the delinquency rate is projected to remain relatively constant, moving from the current 3.6% to 3.5% by the end of 2024, despite the projected rise in the unemployment rate (Chart 9). As discussed previously, the divergence likely has to do with differences in the underlying structure (and responsiveness to unemployment) of the auto and credit card markets.
Buy Now, Pain Later
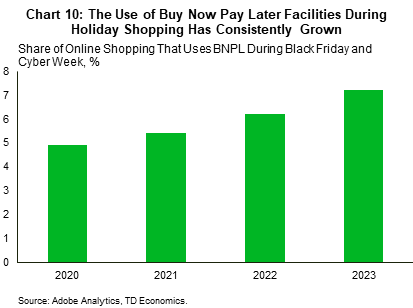
Another form of “credit” analysts are paying increasing attention to are “ Buy Now Pay Later” (BNPL) offers. These are similar to layaway plans where payments are made in installments, typically without interest (but this is changing, and borrowers incur fees if payments are missed). However, unlike layaway plans where the merchant reserves the item until payment is complete, BNPL allows the customer to take immediate possession even before completing payment. Additionally, while traditional layaway plans have been around for some time, the more recent BNPL incarnation has made the payment option more widely available via online fintech firms and for lower priced purchases. This relatively recent (and largely unregulated) segment of the U.S. consumer credit market has become an avenue through which consumers are able to increase their access to credit. In fact, data from Adobe Analytics (a market data analytics firm) shows that use of these facilities during the Thanksgiving holiday shopping period has grown consistently over the last three years (Chart 10).
Consumers are relying more on these lenders as high interest rates dent budgets and pandemic savings diminish. The Consumer Financial Protection Bureau estimates that the prevalence of these loans in the U.S. increased almost tenfold between 2019 and 2021.5 There are concerns however that consumers may overspend, when using such delayed payment methods. Additionally, since BNPL is not subject to the same reporting requirements as other more conventional consumer loan products, there may be significant stacking of debt, which can overextend the borrower’s ability to repay. The Consumer Financial Protection Bureau in a survey found that 88% of BNPL borrowers also had an open credit card, and were on average, more likely to be highly indebted, carry a balance on their credit cards, have delinquencies in traditional credit products, and use high-interest financial services. In a June 2023 survey, the New York Fed also found that BNPL usage was noticeably higher for respondents with credit scores below 620 and those who were delinquent on a loan at some point during the past year. Respondents who had a credit application rejected over the past year were also more likely to have been offered a BNPL payment option. Ultimately, the use of these facilities has contributed to the growing debt balance of the American consumer and presents a risk to their ability to remain current on all their debt obligations. The lack of time series data on these schemes however makes it difficult to assess whether they are a problem, but it is certainly an area regulators are keeping an eye on.
Bifurcation of Consumers
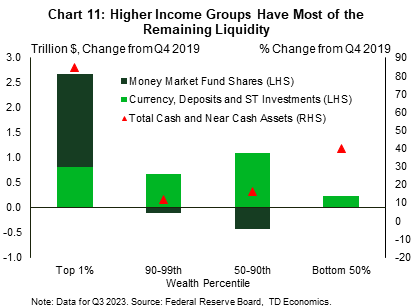
Looking at credit and delinquency trends, one theme that emerges is that different groups of consumers are on different paths. Most lower income groups have largely depleted their pandemic-era excess deposits (Chart 11) and are relying on credit to a greater degree. Minutes from the Fed’s November 2023 meeting revealed that, based on interactions with contacts in their Districts, some FOMC members were concerned about the finances of these low- and moderate-income households. These groups were coming under increasing pressure due to high prices for food and other essentials. This was compounded by tightening credit conditions, with several participants noting that delinquencies on auto loans and credit cards had risen for these households.
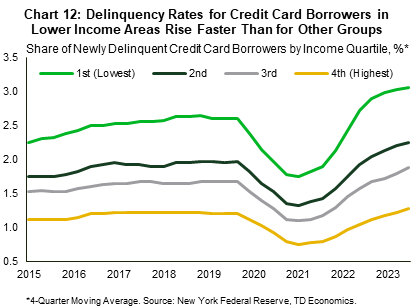
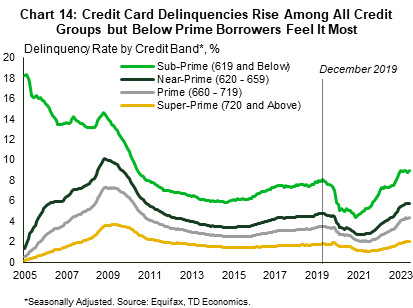
The New York Fed also showed that while credit card balances fell for all income groups during the pandemic, it fell most for high-income borrowers and by 2022 Q3 still had not risen to the level seen before the pre-pandemic. For the lowest income group however, the reduction in average balances was more modest during the pandemic and by 2022 Q3 was once again above the immediate pre-pandemic level (2019 Q4), suggesting that this group was more dependent on credit coming out of the pandemic.6 What’s more, for borrowers in the highest-income cohorts, delinquency rates remained well below historical trends, only recently (2023 Q3) edging past their pre-pandemic level (2019 Q4). For lower income groups, however, while the rates are low in comparison to levels observed during the Great Recession, there is a noticeably higher uptick in their delinquency rates, with this income group surpassing their immediate pre-pandemic level in 2022 Q3 (Chart 12).
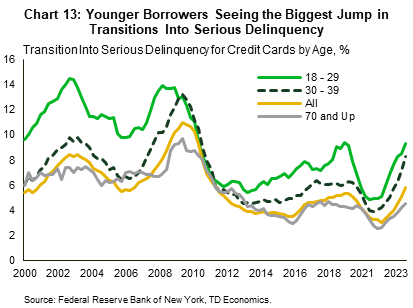
New York Fed data also shows that younger age groups are taking on more credit card debt, and their real average card balance was getting back to its pre-pandemic level. Older age groups, however, were still below that level. Additionally, younger borrowers are also experiencing the biggest jump in transitions into serious delinquency (Chart 13). This is true for the under 40 age group, whose 90 days past due delinquency transition rate blew past pre-pandemic levels in 2023 Q1 and continues to rise notably. The rates for older age groups are also rising but have largely remained at or below pre-pandemic levels.
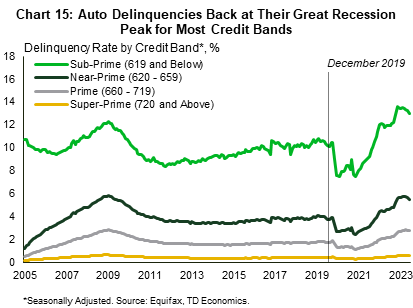
The current situation for sub-prime borrowers is also relatively worse than for other credit categories (see Charts 14 and 15). While almost all borrowers experienced an improvement in their credit situation during the pandemic, credit score migration for some may have allowed them to take on more debt than they could comfortably service under more normal conditions. According to S&P’s Global Ratings, subprime borrowers were becoming delinquent on new car loans at twice the rate as they were before the pandemic. Fitch also reported that its subprime auto ABS delinquency index rose to a new high of 6.1% in September 2023, (just marginally higher than the prior record of 6.0% in October 1996). The similar index for prime auto loans, however, was only 0.27% – still below where it had been in the years before the pandemic. Again, delinquency rates for the two credit segments are performing differently, with subprime creditors doing worse than before the pandemic and prime doing better.
As debt and delinquency rates rise, the variation in both among income levels, age groups and credit categories suggest that many households and individuals are experiencing the economy differently. While some are experiencing greater debt and delinquency, many others are thriving in a still strong economy characterized by resilient consumer demand.
The Final Balance
The U.S. economy is currently performing better than most forecasters expected a year ago, thanks in large part to a resilient consumer. However, more recently that spending is increasingly being financed by credit cards. Delinquency rates, which fell to historically low levels during the pandemic, have also started to rise despite the still low levels of unemployment.
Rising delinquencies are not problematic in and of themselves, however they do require greater attention to find out if they are likely to pose a problem in the future. Our analysis suggests that given our economic forecast, this is unlikely to be the case. For auto loans especially, the factors that contributed to the jump in delinquency rates were largely idiosyncratic to the pandemic. As vehicle prices and interest rates come down, newer vintages of car loans are expected to perform better. Even if unemployment rises, there is a high probability that remaining auto borrowers will attempt to keep their loans current, since their vehicles may be a necessity to obtain new employment. Credit card delinquencies on the other hand are expected to rise further, but not to levels that are usually associated with a recession. As such, there should not be too much disruption to the loan portfolios of most lenders and the wider economy.
Various trends do suggest that certain sub-sections of borrowers are increasingly reaching to keep pace with their spending. The next shoe to drop, so to speak, is for the student loans segment of the market. While delinquencies here are still well below pre-pandemic levels and borrowers are once again required to resume payments, creditors will have to wait until after September 30, 2024 to report delinquent accounts. This caveat aside however, it appears that most consumers are managing their finances well through this period of high rates and prices, even as some groups are experiencing greater financial stress.
End Notes
- See the Federal Reserve Board Reports on Economic and Financial Developments in 1996, 1997 and 1998.
- See Borrower Transitions into Student Loan Repayment: Evidence from Fall 2023 Consumer Survey Data
- See https://libertystreeteconomics.newyorkfed.org/2022/08/three-key-facts-from-the-center-for-microeconomic-datas-2022-student-loan-update/
- Economic theory predicts that strategic defaults will increase when the value of the collateral drops sufficiently. See Campbell, J. Y. and J. F. Cocco (2015). A model of mortgage default. The Journal of Finance 70 (4), 1495{1554}. Also, Ratnadiwakara, D. Collateral (2021). Value and Strategic Default: Evidence from Auto Loans. Journal of Financial Services Research 59, 209–240. See also Agarwal, Ambrose & Chomsisengphet (2008). Determinants of automobile loan default and prepayment. Federal Reserve Bank of Chicago
- See Consumer Use of Buy Now, Pay Later (CFPB, 2023). Also see Buy Now, Pay Later: Market trends and consumer impacts (CFPB, 2022)
- See Balances Are on the Rise—So Who Is Taking on More Credit Card Debt? (FRBNY).
Disclaimer
This report is provided by TD Economics. It is for informational and educational purposes only as of the date of writing, and may not be appropriate for other purposes. The views and opinions expressed may change at any time based on market or other conditions and may not come to pass. This material is not intended to be relied upon as investment advice or recommendations, does not constitute a solicitation to buy or sell securities and should not be considered specific legal, investment or tax advice. The report does not provide material information about the business and affairs of TD Bank Group and the members of TD Economics are not spokespersons for TD Bank Group with respect to its business and affairs. The information contained in this report has been drawn from sources believed to be reliable, but is not guaranteed to be accurate or complete. This report contains economic analysis and views, including about future economic and financial markets performance. These are based on certain assumptions and other factors, and are subject to inherent risks and uncertainties. The actual outcome may be materially different. The Toronto-Dominion Bank and its affiliates and related entities that comprise the TD Bank Group are not liable for any errors or omissions in the information, analysis or views contained in this report, or for any loss or damage suffered.
Download
Share: