Highlights
- Holiday retail sales are unlikely to top the extraordinary numbers observed in the past three years as the economy adjusted to spending shocks induced by the pandemic.
- Even so, holiday spending is likely to be propped up by the presence of pandemic-era savings, as well as a robust labor market. Higher interest rates, economic uncertainty, waning confidence, and the shifting mix of consumer spending, however, are likely to present opposing headwinds.
- All said, spending during the holidays is expected to grow 4.5% this year. While this is less than the stellar growth observed in the past three years, it remains a full percentage point above the pre-pandemic average.

The 2023 holiday shopping season is already in full swing. After the roller coaster ride experienced over the last few years, with pandemic induced distortions to spending, holiday sales are expected to make a more muted showing this year, but still post a healthier pace than the pre-pandemic average.
Despite concerns over inflation and high-interest rates, retail sales have continued to grow at a healthy clip in recent months. Looking at the headline number, the value of seasonally adjusted retail sales rose 7.1% in October on a 3-month annualized basis, keeping up September’s pace.1 Given October’s 3.2% headline consumer price inflation, it is clear households are buying higher volumes, despite the rise in prices. While consumers have been coming under mounting pressures lately (see paper) there are two supportive factors this holiday season: (1) consumers still have a stash of pandemic-era savings and (2) the labor market is still relatively strong.
In a departure from previous years, holiday retail sales will be defined as total retail sales in October, November and December excluding autos, gas and restaurants. This is more in line with the National Retail Federation’s definition, apart from our inclusion of October, since even their own survey suggests that more consumers are starting their holiday shopping then (Chart 1).2
Excess Savings and Resilient Labor Market Support Holiday Cheer
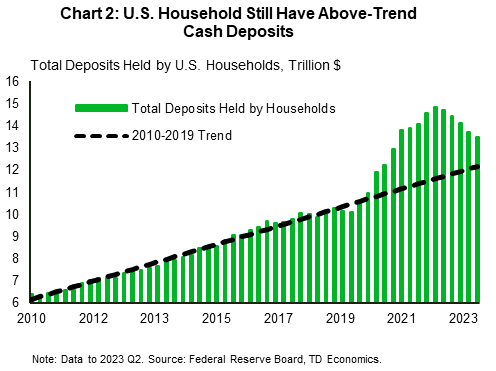
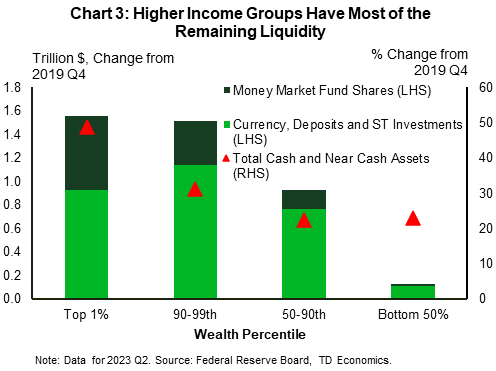
Revisions to personal income and spending data mean that estimates of “excess savings” from the pandemic are larger than assumed a few months ago. The impact on holiday retail sales could be notable. Using the personal income and savings trends to estimate excess savings, consumers have just north of $800 billion in excess savings remaining as of the third quarter of 2023. This is almost double our previous estimate of $473 billion prior to the benchmark revisions. If, instead, we estimate excess savings via bank deposits, the amount is larger at about $1.3 trillion of cash assets (Chart 2). Less supportive, however, is that most of this remaining cash is held among the higher wealth levels (Chart 3). Ultimately, whichever measure of “pandemic era” savings cushion you use, there is still some available in the economy, which can be spent by consumers looking to spread holiday cheer this season.
Income growth is the most important driver of spending, and so far, the labor market remains supportive of decent income gains for workers. Both average hourly earnings and the employment cost index (see commentary) show that workers are still receiving raises, even if not as jolly as last year. Unemployment remains very low, which should also bolster consumer’s willingness to spend. Further, surveys have indicated that consumers are preparing to spend, so as to enjoy the holidays with friends and family, in spite of higher prices.3 As such, consumers seem willing to put off playing the grinch until after the holidays.
Shift to Services Gives Holiday Retailers a Chill
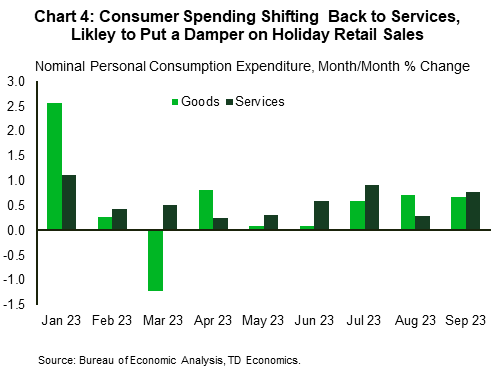
However, a shift in spending towards categories not typically included in the holiday spending tally, namely services (including restaurants) and auto parts and dealers is an opposing headwind. Services spending is once again picking up steam, with year-to-date growth in real services expenditure up 1.5% versus 1.3% for goods as consumers prioritize acquiring experiences over goods. Additionally, on a monthly basis, the change in nominal spending has been higher for services vis-à-vis goods for six out of the last nine months, suggesting that higher prices are also helping to lift the total outlay for services (Chart 4). Consumers having to fork out more to make large-scale vehicles purchases as models finally become available after months of shortages, or to keep older models running with expensive parts and repairs, will also divert spending away from the holiday categories. Consumers may also increasingly choose to celebrate the holidays out at restaurants (another category not included in holiday sales) rather than eating at home. The combination of the above shifts in spending will likely detract from the holiday spending totals.
Inflation Could be a Double Whammy for Holiday Sales This Year
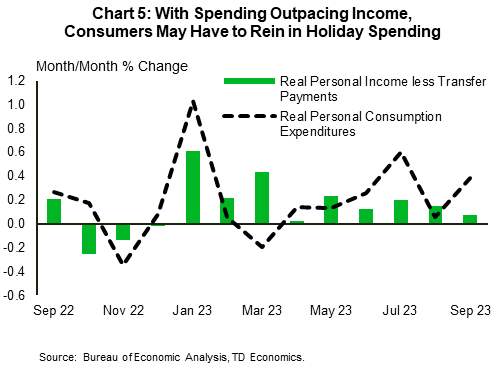
Since retail sales is reported as nominal values, inflation, which contributed greatly to the robust showing over the last two years, may be more of a drag this year. Since peaking at 9.1% year-over-year (y/y) in June 2022, overall consumer price inflation has trended down to hit 3.2% as of October. This means the total value of retail sales will grow more slowly than last year, especially if volumes do not increase sufficiently to offset lower inflation. At the same time, inflation is still relatively high in essential spending categories, such as food and housing which will divert funds away from largely discretionary holiday spending categories. In a related vein, consumer spending has also been outpacing real personal disposable income growth in recent months (Chart 5). With credit availability dwindling, consumers will need to bring spending in line with income, which may deal a blow to holiday spending.
Some Consumers Expect a Blue Christmas
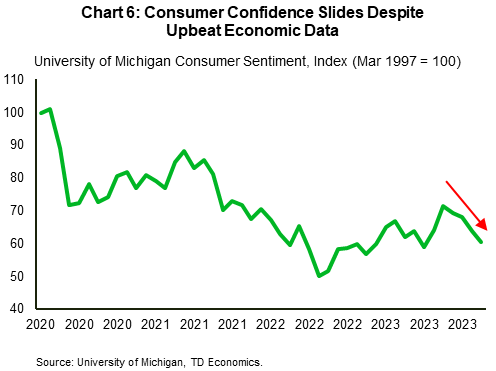
Despite low unemployment and healthy economic growth, puzzlingly, measures of consumer sentiment are down. The two main indexes, which gauge consumers’ attitudes towards current and future economic strength have slipped for four straight months, with the University of Michigan index hitting a six-month low in November (Chart 6). The long-run economic outlook is a particular drag on sentiment. This is in part due to growing concerns about the negative effects of high interest rates, as the Fed’s current “higher for longer” rhetoric increases the cost of borrowing (on credit cards for example). Consumers are also expecting overall inflation to rise in the future according to the index. What’s more, while the pace of price increases has come off the boil witnessed in 2022, prices have not fallen. The high cost of housing in particular is frustrating for some consumers, overshadowing the current buoyant economic data. Recent volatility in bond yields, another possible spike in oil prices, and ongoing wars in Gaza and Ukraine are also weighing on consumers.
Lower sentiment could stymie consumers’ willingness to spend as previous research has indicated a link between consumer spending and sentiment.4 Going forward, even tighter financial and credit conditions for both households and businesses are also likely to weigh on economic activity, hiring and inflation. The extent of these effects remains uncertain but could undermine spending on goods and services, including during the holidays.
Anything Else?
To round out the discussion there are some interesting observations worth pointing out. Firstly, December just isn’t what it used to be as holiday sales are increasingly being pulled further ahead in the season. More and more holiday sales continue to get pushed beyond the usual November-December period, as retailers compete to capture a larger share of consumers wallets. As noted previously, market surveys have shown that up to 41% of consumers expect to begin their holiday shopping in October or earlier. This trend is being driven by large retailers holding big holiday sales events in October. Consequently, October and November sales are rising, while December’s is declining. There is a limit to this tradeoff though and December will likely remain the king of the holiday shopping season, even if it loses a bit of market share.
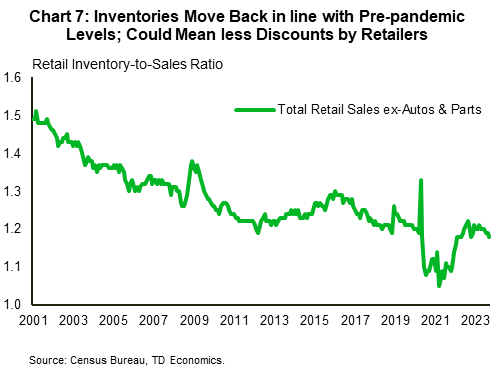
There also seems to be better retail inventory management this year, with the inventory-to-sales ratio pretty much back to pre-pandemic levels (Chart 7). This is set to benefit retailers who do not appear to be over or under stocked. While this may result in fewer discounts for consumers, retailers have found that sweet spot where they don’t have to worry about missing sales because of low inventories or needing to give deep discounts to clear too much stock.
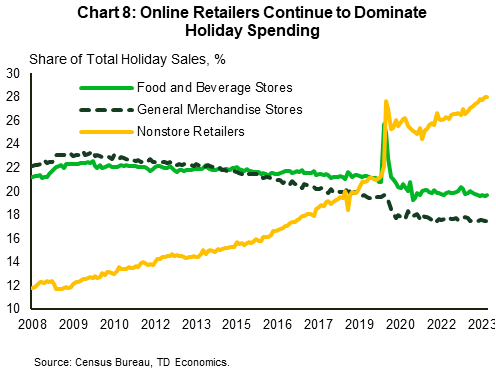
As with the past few years, online sales will continue to be a strong contender for consumers’ dollars this season. As of October, non-store retailers, which largely consists of e-commerce sales, accounted for 28% of sales in the holiday spending categories (Chart 8). This has even surpassed its former peak of 27.7% at the height of the pandemic (April 2020) and is the highest among all categories with grocery stores a distant second at 19.7%. As such, e-commerce sales are expected to lead the pack again this year as consumers search for the best deals online. All retailers however, whether strictly online or brick-and-mortar, who adapt to ever changing consumer demand and behaviors will likely be in a good position for growth this holiday season.
Wrapping it Up
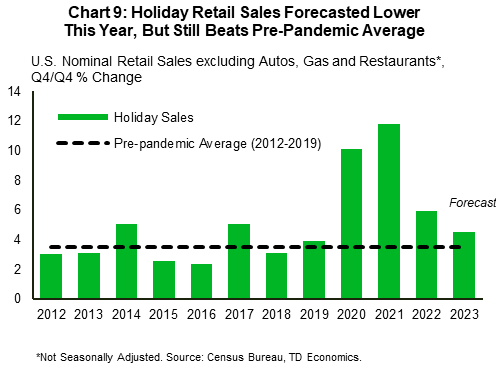
While there are reasons to spend less this year, not seasonally adjusted holiday sales are forecasted to grow 4.5% y/y in 2023 Q4, boosted by a sizeable reserve of pandemic-era savings.5 This is lower than last year’s 6%, but still above the pre-pandemic average (Chart 9). The moderation in inflation is expected to weigh on the pace of nominal sales relative to last year. Nonetheless, we anticipate that the labor market will remain strong enough during the holiday period to keep the volume of sales going for the season.
End Notes
- On a month-over-month basis, retail sales fell 1.3% (annualized) in October after six consecutive months of robust growth. Sales grew 9.2% and 11.1% (both annualized) in August and September, respectively.
- The National Retail Federation defines holiday sales as retail spending excluding automobile dealers, gasoline stations and restaurants during the months of November and December.
- https://www2.deloitte.com/us/en/insights/industry/retail-distribution/holiday-retail-sales-consumer-survey.html Consumers are willing to spend $1,652 this season (a 14% y/y increase), surpassing the pre-pandemic level for the first time.
- See Carroll, Christopher D., et al. “Does Consumer Sentiment Forecast Household Spending? If So, Why?” The American Economic Review, vol. 84, no. 5, 1994, pp. 1397–408. Also see: Ludvigson, Sydney, C. 2004. “Consumer Confidence and Consumer Spending.” Journal of Economic Perspectives, 18 (2): 29-50.
- For holiday retail sales calculations, we refer to “not seasonally adjusted” figures, since the seasonality captured in holiday shopping is precisely what the paper seeks to address.
Disclaimer
This report is provided by TD Economics. It is for informational and educational purposes only as of the date of writing, and may not be appropriate for other purposes. The views and opinions expressed may change at any time based on market or other conditions and may not come to pass. This material is not intended to be relied upon as investment advice or recommendations, does not constitute a solicitation to buy or sell securities and should not be considered specific legal, investment or tax advice. The report does not provide material information about the business and affairs of TD Bank Group and the members of TD Economics are not spokespersons for TD Bank Group with respect to its business and affairs. The information contained in this report has been drawn from sources believed to be reliable, but is not guaranteed to be accurate or complete. This report contains economic analysis and views, including about future economic and financial markets performance. These are based on certain assumptions and other factors, and are subject to inherent risks and uncertainties. The actual outcome may be materially different. The Toronto-Dominion Bank and its affiliates and related entities that comprise the TD Bank Group are not liable for any errors or omissions in the information, analysis or views contained in this report, or for any loss or damage suffered.
Download
Share this: