The Grass is Always Greener Somewhere South:
2022 U.S. Regional Population Trends
Andrew Foran, Economist | 416-350-8927
Date Published: January 24, 2023
- Category:
- US
- State & Local Analysis
Highlights
- Interstate migration was the main contributor to population changes along the East Coast in 2022. The long-standing migration trend from North-to-South strengthened relative to 2021.
- However, states which saw interstate outflows experienced a partial offset from international immigration, which rebounded to pre-pandemic levels in 2022.
- While strong interstate migration buttressed labor force gains in the South, recoveries in labor force participation rates were more closely related to within-state age demographics.
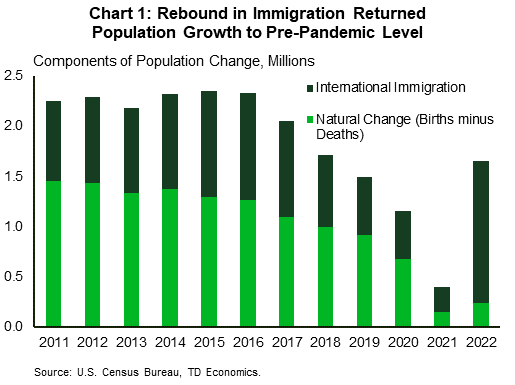
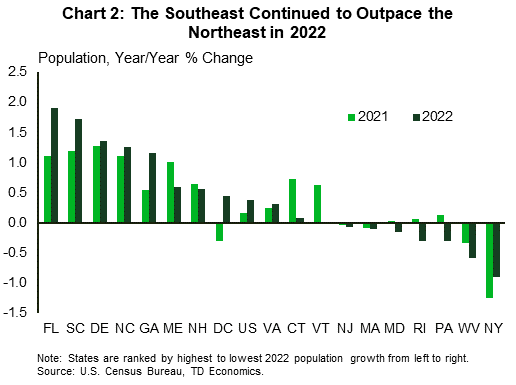
Population growth in the United States rebounded by 0.4% in 2022, double the 0.2% pace seen in 2021 thanks to a return to pre-pandemic immigration levels (Chart 1). 2022’s pace is roughly on par with the historically slow growth seen in the years prior to the pandemic. In addition to the rebound in immigration, a recovery in the birth rate also played a supporting role. At the regional level, interstate migration continued to be the central factor with the East Coast seeing even larger North-to-South flows than in 2021 (Chart 2).
New England – Immigration Helps to Offset Population Aging and Domestic Outflows
New England has long faced low rates of natural increase, thanks to its older population, and the past two years saw consecutive natural decreases with more deaths than births. The tristate area of Maine, New Hampshire, and Vermont were the main contributors to the regional decline, with the natural decrease (more deaths than births) being twice as large in Maine as in the other two states. Interestingly, New Hampshire saw the strongest growth in births in the country in 2022 and a solid decline in deaths, but still incurred negative natural population growth. This is largely due to the fact that New Hampshire and its tristate counterparts continue to record the lowest birth rates (number of births divided by total population) in the country. The larger states of Connecticut and Massachusetts recorded positive natural increases in 2022, with each seeing strong growth in births and a solid decline in deaths relative to 2021; however, the birth rate in each state still lags the national measure.
In 2022 New England gained the highest number of new residents from abroad since 2017, with many settling in Massachusetts and Connecticut. In the case of Connecticut, this was enough to make up for domestic migration outflows and create positive total population growth. Massachusetts was not as fortunate, with sizeable domestic outflows overpowering the strongest natural population and international immigration numbers in New England.
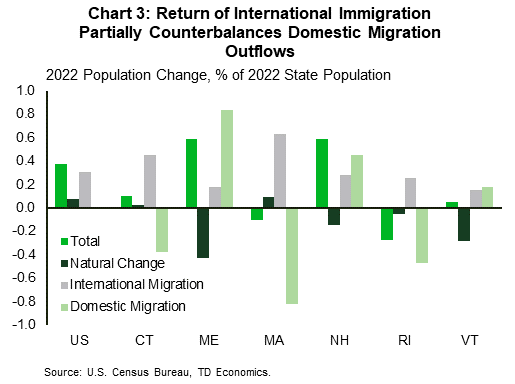
Interstate migration was a major contributor to regional population changes in New England for 2022, with the region seeing a nearly tenfold increase in per capita outflows. Massachusetts saw the lion’s share of losses, continuing the trend from 2021, followed by Connecticut and Rhode Island to a lesser extent (Chart 3). Connecticut and Rhode Island each saw greater than full reversals of the positive domestic migration inflows they recorded in 2021, meaning they have now lost more residents to other states than gained since the onset of the pandemic. The tristate area of Maine, New Hampshire, and Vermont all recorded positive, albeit smaller inflows than they saw in 2021.
Middle Atlantic – Domestic Outmigration Intensifies in 2022
The population of the Mid-Atlantic region declined by 0.5% in 2022, as massive domestic migration outflows were unable to be counterbalanced by strong natural population growth and international immigration inflows. The region saw a positive natural increase in 2022, led by New York and New Jersey. Pennsylvania was the only state of the three to see a natural decrease for the year, as deaths continued to outpace births in the state. All three states recorded fewer deaths in 2022 as the peak impact of the Covid-19 pandemic receded, but declines were more modest in Pennsylvania. Births grew the most in New Jersey, while Pennsylvania and New York saw births grow more slowly than the national average. New Jersey and New York have birth rates roughly equal to the national average, while Pennsylvania lagged slightly.
New York and New Jersey both recorded above average per capita international immigration inflows, while Pennsylvania was slightly below the national average. New Jersey actually saw more new residents from international immigration than Pennsylvania, despite the former having a population 3.7 million less than the latter. New York experienced the fourth largest inflows from international immigration in the country, commensurate with its national ranking in terms of total population. However, international immigration did not make up for the large number of New Yorkers leaving the state.
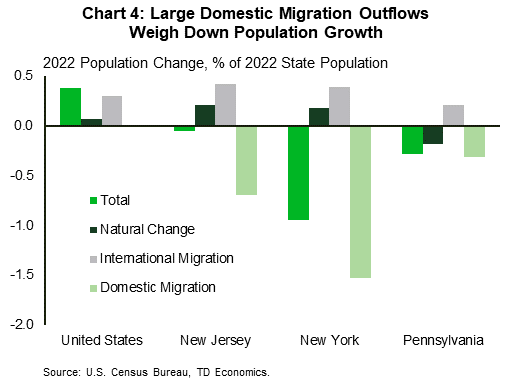
Similar to 2021, New York saw the highest per capita domestic migration outflows in the country. While New York’s outflows did slow modestly from 2021, they were still substantial, far eclipsing its solid gains from natural increase and international immigration. Domestic migration outflows from New Jersey in 2022 were more than twice what they were in 2021, while Pennsylvania saw a nearly tenfold increase in outflows relative to last year. Collectively, the Mid-Atlantic region lost the equivalent of 1% of its 2022 population to domestic outflows (Chart 4).
Upper South Atlantic – North Carolina a Magnet for Interstate Migrants
The Upper South Atlantic region was the only East Coast region which gained residents from all three categories of population growth (natural, international, and domestic migration). Natural population growth in the Upper South Atlantic region for 2022 was centered in the National Capital region (D.C, Maryland, and Virginia) and North Carolina. The National Capital region saw a per capita natural increase above the national average, while North Carolina was slightly below the nation. Delaware continued to see deaths modestly outpace births while West Virginia experienced a nearly 10% rise in deaths, which resulted in a notably large per capita natural decrease. Birth rates in the Upper South Atlantic region were roughly on par with the national average, though D.C. was notably above and West Virginia trailed slightly.
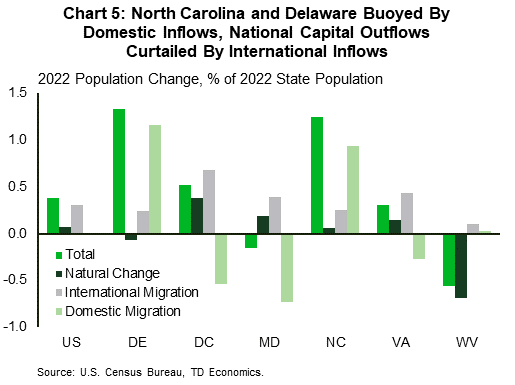
The National Capital region saw some of the highest per capita international immigration inflows in the country, led by D.C. Curiously, North Carolina recorded below average per capita inflows from abroad, after two years of impressive strength in domestic migration inflows. Delaware’s per capita international inflows were also below average (roughly equal to North Carolina’s) while West Virginia had the sixth lowest per capita inflows in the country. In total, about 62% of the Upper South Atlantic region’s aggregate population growth came from international immigration, with about two-thirds of the gains located in the National Capital region.
Interstate in-migration in the Upper South Atlantic was dominated by North Carolina and Delaware (Chart 5). North Carolina saw a 12.5% rise in domestic inflows relative to 2021, while Delaware saw a modest deceleration. The National Capital region fared far worse, with domestic outflows increasing by 40% relative to 2021. Over 60% of the domestic outflows from the National Capital region were from Maryland, while Virginia made up a little over 30% of the losses and D.C. rounded out the remaining outflows. Cumulatively, the Upper South Atlantic region saw positive domestic inflows in 2022, however they were 23% lower than in 2021.
Lower South Atlantic – Migrants Continue to Flock to the Sunshine State
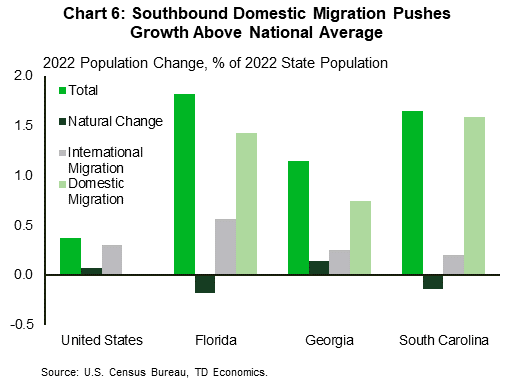
The Lower South Atlantic region registered the largest population gains on the East Coast which were solely driven by domestic and international migration inflows. Domestic inflows continued to be the crown jewel in Florida’s population growth with inflows increasing by 44% relative to 2021. This has put considerable daylight between itself and second-place Texas in the post-pandemic period. While Florida had the third highest percentage of their population which moved from another state in 2022 at 1.43%, South Carolina was first at 1.6% (Chart 6). The Palmetto State saw a 30% increase in domestic inflows relative to 2021. In Georgia, 0.75% of its residents moved from another state in 2022, slightly lagging its regional neighbors.
International immigration was the other source of population growth for Florida in 2022, with the state seeing the second largest absolute immigration inflows in the country, only marginally less than California—a state with a population 84% larger than Florida’s. In per capita terms, only Massachusetts recorded greater relative inflows from immigration. This, in addition to Florida’s sizeable domestic migration inflows, helped to give the state the fastest population growth in the country for the first time since 1957. South Carolina and Georgia saw more modest international inflows, with each lagging the national average in per capita terms.
In contrast, Florida continued to suffer from a net decline in natural population last year. This was in part due to Florida’s aging demographics and the fact that it had the ninth lowest birth rate in the country in 2022. South Carolina posted a natural population decline like Florida’s in per capita terms. Georgia fared more favorably, with per capita gains running at double the national average, though it was the only state of the three that saw deaths grow more quickly than births in 2022. Georgia and South Carolina have birth rates close to the national average, with Georgia slightly above and South Carolina slightly below.
Labor Market Implications
Regional post-pandemic recoveries, particularly when it comes to labor supply, have been highly correlated with population gains, and in particular, the pace of net domestic migration inflows. In an environment of labor shortages, stronger gains in working-age populations have in general greased the wheels of labor market participation and hiring.
International migration can also be an important driver of growth in working age populations. Interestingly, international migration inflows in the post-pandemic period (which largely occurred in 2022) have been comparatively higher in states that had seen net domestic migration outflows. However, in most cases they were not enough to fully counter the domestic migration losses seen since the onset of the pandemic, with the only exceptions being Connecticut, Pennsylvania, and Virginia.
Inflows to southern states, such as Florida, have pushed their labor forces well above pre-pandemic levels, leaving the national recovery rate of +0.3% in the dust (Table 1). However, this strong growth has not shifted labor force participation rates in most cases, with only six states in the country seeing participation rates above pre-pandemic levels. Two of these states are Florida and Texas, which did manage to record higher inflows of working age people relative to before the pandemic1.
Table 1: Labor Force (LF) Recoveries Aided by Domestic Inflows in Southeast
Table 1) Table 1 ranks the 18 East Coast states (including D.C.) from largest to smallest in terms of per capita domestic migration net inflows in the post-pandemic period. It also shows the per capita international immigration inflows for each state and their labor force recovery. Each variable column is color-coded, with green showing high growth, white showing low growth, and red showing negative growth. What sticks out in the table is that states which recorded high per capita domestic migration inflows had stronger labor force recoveries. Interestingly, it also shows that states which saw large domestic migration outflows had higher per capita inflows from international immigration.
Other states that saw sizeable domestic migration inflows, such as South Carolina, have actually posted weaker labor force participation rate recoveries due in part to the fact that its inflows skewed older. This helps illustrate the fact that while domestic inflows were advantageous, they were by no means a silver bullet. This can also be seen in Maine, which had an older population prior to the pandemic but also saw an uptick in retiree inflows from other states, resulting in a notable decline in its labor force participation rate. This lines up with recent research completed by the Federal Reserve showing that excess retirements seen in the wake of the pandemic account for a sizeable share of the shortfall in labor force participation rates2.
Employment recoveries were also highly correlated with post-pandemic domestic migration (meaning states which saw higher inflows saw stronger job growth, in part due to the greater availability of labor). Having said that, of the top ten states for per capita domestic inflows in the country, only 4 out of 10 have lower unemployment rates now than before the pandemic. Despite solid hiring gains, employment growth failed to keep up with that of the labor force growth that resulted from the domestic migration inflows (Table 2). In the Southeast, only Florida and Georgia were able to accomplish this. For many of the northern states along the east coast, labor force recoveries have been lagging employment recoveries, pressuring unemployment rates down below their 2019 levels.
Table 2: Domestic Inflow Fueled LF Growth Outpaced Job Growth in Most Southeast States
Table 2) Similar to Table 1, Table 2 ranks the 18 East Coast states (including D.C.) from largest to smallest in terms of per capita domestic migration net inflows in the post-pandemic period. In the first column it shows each state's November unemployment rate relative to its February 2020 level. It also shows another variable in the second column which is the difference between the state's post-pandemic job growth and post-pandemic labor force growth. The two columns are color-coded, with the first column being red if the state's unemployment rate is higher than in February 2020 and green if it is lower. The second column is red if the value of the variable is negative (meaning labor force growth outpaced job growth) and green if positive (meaning job growth outpaced labor force growth). The comparison shows that states which saw high domestic migration inflows had relatively higher unemployment rates due to the fact that labor force growth outpaced job growth..Bottom Line
Regional population trends in 2022 were largely explained by the domestic migration flows between states. The North-to-South trend increased in 2022, with the large Northeastern states seeing substantial departures for the South. International immigration bounced back in 2022 and provided some support to these northern states but it was unable to fully stem the interstate migration losses. Florida came out on top in terms of combined domestic and international migration inflows but fared poorly in terms of natural population growth. Other states fared better in terms of natural population changes, with most seeing notable growth in new births, although states with older populations tended to fare worse. The labor force recovery rate in each state is highly correlated with its post-pandemic per capita domestic migration inflows; however, in many cases these inflows caused labor force growth to exceed employment growth, pushing up the state’s unemployment rate. So, while on the surface the grass may seem greener down south, it is in reality more nuanced than the headlines would lead one to believe.
End Notes
- Survey data from United Van Lines. https://www.unitedvanlines.com/newsroom/movers-study-2021
- “The Great Retirement Boom”: The Pandemic-Era Surge in Retirements and Implications for Future Labor Force Participation. https://www.federalreserve.gov/econres/feds/the-great-retirement-boom.htm
Disclaimer
This report is provided by TD Economics. It is for informational and educational purposes only as of the date of writing, and may not be appropriate for other purposes. The views and opinions expressed may change at any time based on market or other conditions and may not come to pass. This material is not intended to be relied upon as investment advice or recommendations, does not constitute a solicitation to buy or sell securities and should not be considered specific legal, investment or tax advice. The report does not provide material information about the business and affairs of TD Bank Group and the members of TD Economics are not spokespersons for TD Bank Group with respect to its business and affairs. The information contained in this report has been drawn from sources believed to be reliable, but is not guaranteed to be accurate or complete. This report contains economic analysis and views, including about future economic and financial markets performance. These are based on certain assumptions and other factors, and are subject to inherent risks and uncertainties. The actual outcome may be materially different. The Toronto-Dominion Bank and its affiliates and related entities that comprise the TD Bank Group are not liable for any errors or omissions in the information, analysis or views contained in this report, or for any loss or damage suffered.
Download
Share: