The Federal Reserve indicated in September that one more rate hike this year was still in the cards. That means the end is now at hand for this rate hiking cycle...or is it?
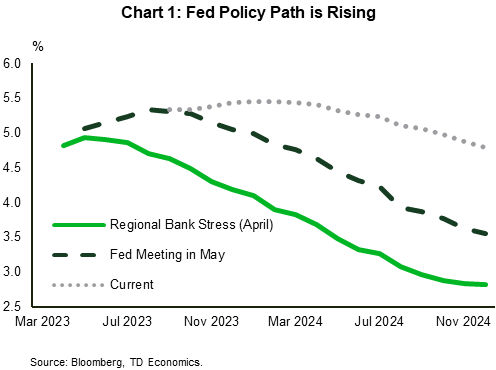
Investors have watched the Fed repeatedly revise up expectations for how high they will need to raise interest rates over the past year and a half (Chart 1) in the face of stubborn inflation and surprising economic momentum. Although interest rates are finally high enough to be in “restrictive territory”, the question of how restrictive is debatable. The answer depends on where the neutral rate is believed to rest, and that answer varies through history.
In this report, we tackle how an interest rate that’s supposed to be rooted in long-term concepts of economic fundamentals and dynamics can change by such a large magnitude, and whether that thinking is about to migrate towards a higher neutral rate.
Even a slightly higher neutral rate would imply that the current fed funds rate at 5.50% is not sufficiently restrictive to re-anchor and sustain inflation at the 2% target.
A paradigm shift in the (R-)stars

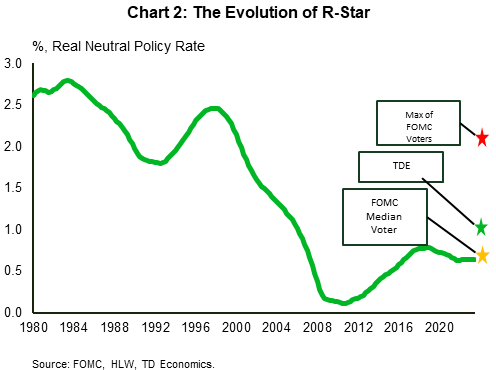
The evolution of the neutral rate of interest or, in economics jargon, R-star, is the federal funds policy rate (net of inflation) that neither stokes nor chokes off economic growth. It can also be thought of as the “clearing rate” that keeps savings and investment in equilibrium. It is in the depths of this concept where the debate on R-star estimates rage on.
Over the last 30 years, several large forces have caused analysts to mark down estimates of the neutral rate (Chart 2). Two key ones were when the tech bubble popped in 2001 and the real estate market collapse in 2008. Both caused lengthy deleveraging cycles by corporations (in the case of the tech bubble) and consumers (following the real estate bubble). The net effect of each was to restrain the willingness to spend and invest, weighing down the neutral rate.
Two other phenomena were thought to lead to a lower neutral rate: a global savings glut and secular stagnation. In 2005, former Fed Chair, Ben Bernanke, noted that the rise of developing nations with higher savings rates, led by China, in combination with oil producing countries in the Middle East and North Africa created a supply of available global savings that was not matched by investment. Simultaneously, secular stagnation pulled on many threads, including one view that the dearth of investment was accentuated by the rise of the digital economy that required less capital, leading to slower employment and output growth.
All these theories and observations pointed in the same direction: too much money chasing too few assets, leading to a fall in world interest rates. And this seemed to be true over the period of 2001 to 2020, where inflation remained anchored near the 2% mark despite an average policy rate of only 1.5%.
Now the question is how much of these conditions still hold today? The first catalyst of change is that the digital economy (and soon-to-be A.I. economy) is intersecting with government policies on clean energy and supply chain security. This has lit a fire under traditional investment in U.S. manufacturing facilities despite high interest rates.
The second catalyst is that the pandemic caused government debt (globally) to skyrocket, and many countries are keeping debt loads higher. This is causing greater competition by sovereign debt for global savings. This has the potential to crowd out private sector debt. In the case of the U.S., the Congressional Budget Office (CBO) projects that the (gross) federal debt-to-GDP ratio is slated to rise over eight percentage points by 2027 and by 22 percentage points (to 119%) by 2033. Deficits ranging between five and six percent of GDP are expected to persist – and ultimately widen. This would occur under a continual economic expansion, let alone a cycle that encompasses a downturn.
The third catalyst is that China’s contribution to the global savings glut is diminishing. Advanced countries are actively limiting supply chain exposure to China, while the country is slowing materially under the weight of aging demographics and strong structural economic forces related to their financial and property sectors. Long gone are the days of double-digit economic growth when China’s entry into the World Trade Organization propelled a rapid expansion of globalization. Economic growth is expected to trend towards 3.5% by 2028. By extension, this will slow the pace of global savings creation as the pendulum starts swinging to the other side.
Diversifying supply chains away from China should help to bring down the risk of future large economic disruptions, but it could come at the expense of productivity. Lower global productivity reduces global income and available savings in turn. Even absent productivity losses, the shift of production to countries with lower savings rates could work to thin out the global savings pool.
Ultimately the coming years could see a normalization in the flow of savings, and this can raise the marginal cost of capital…i.e. the equilibrium interest rate.
Stellar collision

This collision of forces is causing a rethink of R-star. Unfortunately, the answer is only ever known in hindsight. Even so, we think the odds lean toward it being slightly higher than the past decade. The resilience of the U.S. economy is giving some signals on this front, as laid out in Table 1. Of course, this doesn’t answer the crucial question of how high that R-star has risen. It is early days, but we think roughly a 25bps (and perhaps even as much as a 50bps) nudge is a reasonable possibility.
To help ground this perspective, we conducted a thought experiment. Applying different assumptions for R-star, we can test with our models what GDP growth would have been over the first three quarters of 2023 and through 2024 (Chart 3). If the post-Global Financial Crisis (GFC) level of R-star was maintained, the U.S. economy would have already been on a path towards recession. Instead, GDP growth over the first three quarters of 2023 reveals that R-star is tracking between 0.75% and 1.0% (compared to the Fed’s view of 0.5%). This is consistent with our recently published economic forecast.
Table 1: Drivers of R-Star
Source: TD Economics
| |
Prior Cycle |
Current Cycle |
| Productivity Growth |
Falling productivity and low investment (-) |
Supply chain investment and potential of generative AI (+) |
| Demographic Trends |
Falling birth rate, lower immigration, low labor force participation (-) |
Same as prior but notable increases in labor force participation (+) |
| Fiscal Policy/Investment |
High government borrowing offsetting consumer deleveraging (+) |
Still high government borrowing plus climate change investment (+) |
| International Flow |
Emergence of China led to significant investment (+) |
A changing world trade order may spark new investment (+) |
| Scarcity of Safe Assets |
Rising Emerging Market growth and commodity demand caused increased demand for USD and scarce USD assets (+) |
Continuation of prior trend with no alternative to the USD (+) |

Now is this enough to slow the economy down and bring inflation back to 2%? Our monetary conditions index that takes the Fed’s policy rate and adjusts it for inflation and R-star helps to answer this (Chart 4). It shows that if the Fed is right and R-star hasn’t changed since the post-GFC time period, the monetary conditions index is set to reach the same level of restrictiveness that preceded the 2001 and 2008 recessions. But if R-star has migrated higher, the current level of policy is less restrictive than the Fed thinks. Our view of R-star between 0.75% to 1.0% (nominal neutral rate of 2.75% to 3.00%) validates our view that the U.S. economy is mostly likely headed for a soft landing.
Disclaimer
This report is provided by TD Economics. It is for informational and educational purposes only as of the date of writing, and may not be appropriate for other purposes. The views and opinions expressed may change at any time based on market or other conditions and may not come to pass. This material is not intended to be relied upon as investment advice or recommendations, does not constitute a solicitation to buy or sell securities and should not be considered specific legal, investment or tax advice. The report does not provide material information about the business and affairs of TD Bank Group and the members of TD Economics are not spokespersons for TD Bank Group with respect to its business and affairs. The information contained in this report has been drawn from sources believed to be reliable, but is not guaranteed to be accurate or complete. This report contains economic analysis and views, including about future economic and financial markets performance. These are based on certain assumptions and other factors, and are subject to inherent risks and uncertainties. The actual outcome may be materially different. The Toronto-Dominion Bank and its affiliates and related entities that comprise the TD Bank Group are not liable for any errors or omissions in the information, analysis or views contained in this report, or for any loss or damage suffered.


