Highlights
- The U.S. labor market has settled into a low-hire, low-fire equilibrium, where weak hiring activity is offset by limited layoffs. This has kept the unemployment rate in a tight range of 4.3%-4.5% since mid-2025.
- At the same time, aging demographics and slower immigration are restraining labor force growth and lowering the economy’s break-even pace of employment growth to roughly 30–40k jobs per month.
- A stable labor market is giving the Fed room to stay focused on inflation and energy-driven price risks in the near term, even as structurally weaker labor supply may complicate how policymakers interpret future labor market slack.
The U.S. labor market has softened considerably over the past two years, but several factors have prevented this from leading to a commensurate economic impact. The first is that constrained hiring activity has been matched by a subdued level of layoffs, with some referring to this as a low-hire, low-fire environment. As employers have largely maintained existing headcounts, this has prevented undue upward pressure on the unemployment rate. Second, the combination of aging demographics and slower immigration inflows has resulted in slower labor force growth, which in turn has lessened the need for additional job creation to accommodate new entrants to the labor market. Cumulatively, this has lowered the break-even rate of employment – or the rate of job creation required to keep the unemployment rate stable.
These dynamics have created a favorable near-term situation for the Federal Reserve. With the unemployment rate still low and holding steady, there is little impetus for the Federal Reserve to change its stance on monetary policy, permitting the central bank to maintain its focus on the emerging risks to its inflation mandate stemming from the ongoing energy shock which is coming atop still elevated price pressures. However, over the long-run, these dynamics may complicate the Fed’s ability to evaluate the labor market reaction to economic shocks.
The State of the U.S. Labor Market: A Broad-Based Slowdown
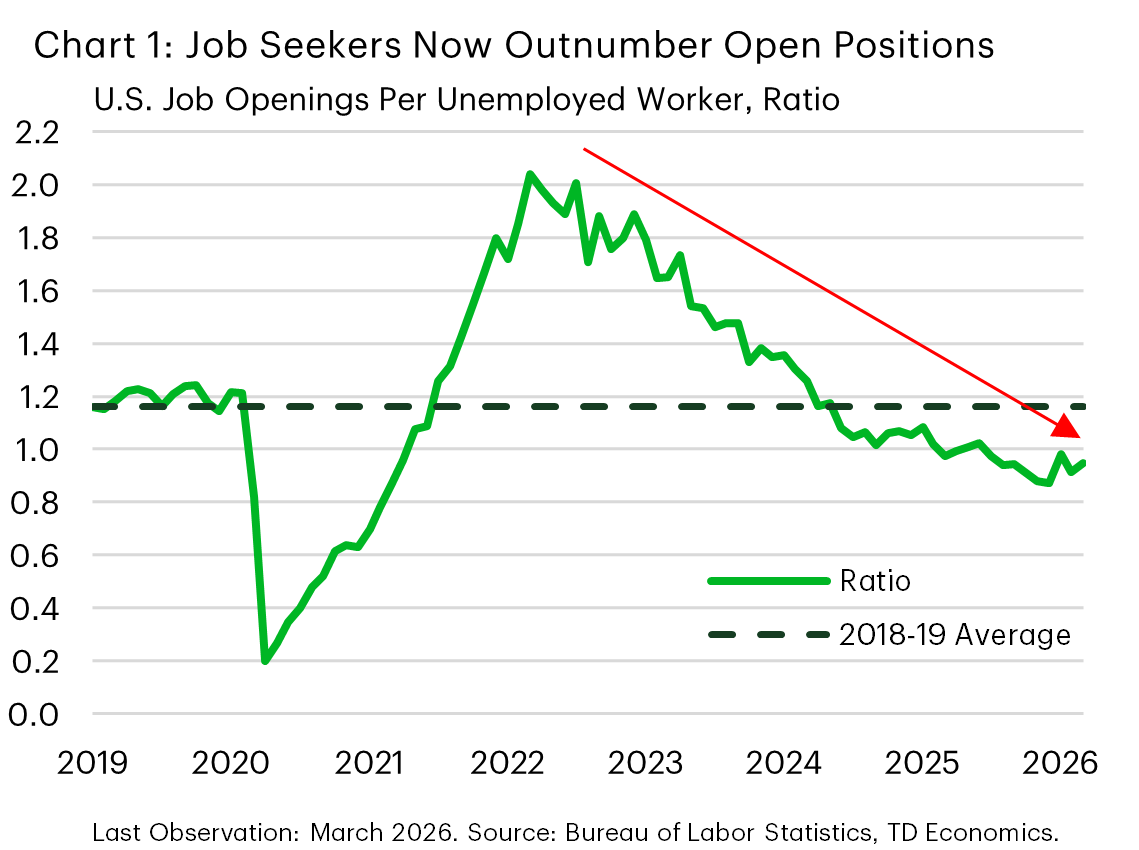
The recent slowdown in the labor market is rooted in a weaker labor demand backdrop. After soaring to unprecedented highs in the wake of the pandemic, job openings have been on a persistent downtrend, retreating to levels softer than those seen in the pre-pandemic period. The job openings-to-unemployed ratio has remained below 1.0 for nearly a year, indicating that job seekers outnumber available positions (Chart 1).
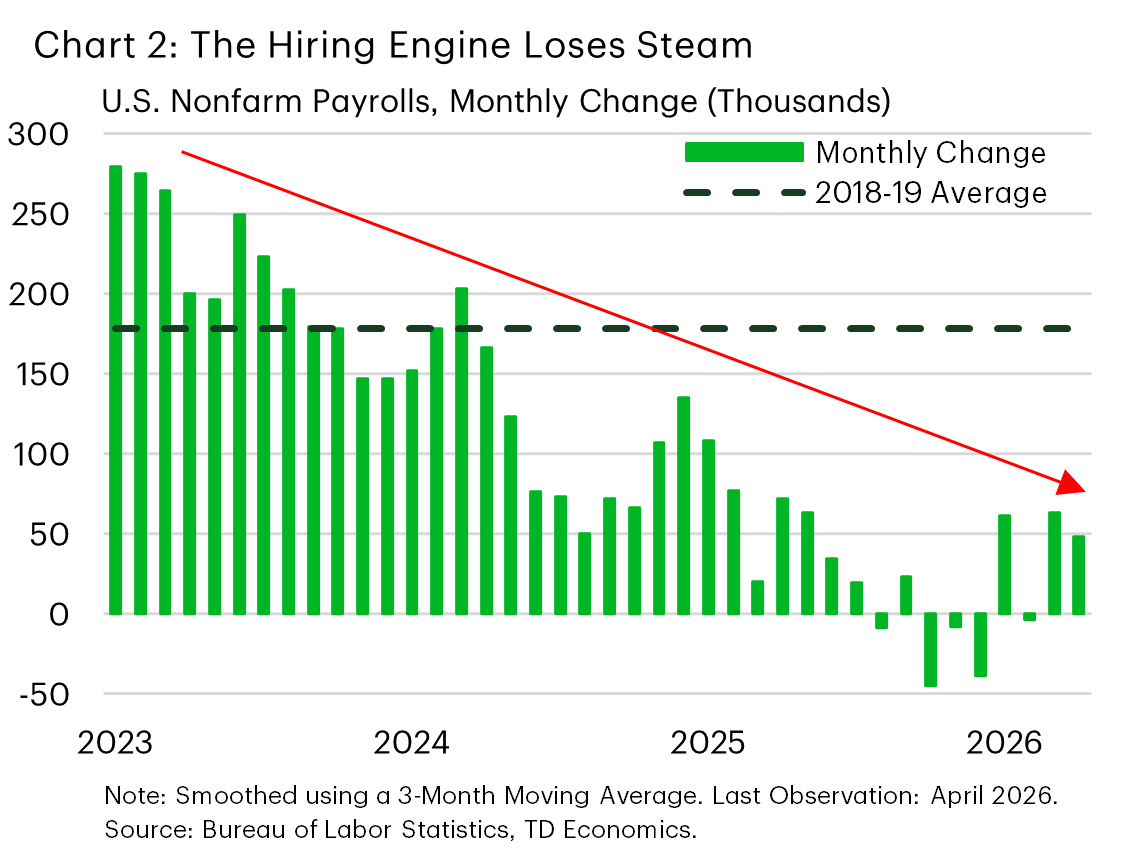
The pullback in labor demand has translated directly into a deceleration in hiring activity. Nonfarm payrolls averaged just 26.3k per month through 2025 and into early 2026, representing a stark departure from the relatively sizeable job gains observed in 2023-24, and the 2018-19 period preceding the pandemic (Chart 2). While monthly payroll readings have occasionally surprised to the upside in early 2026, these gains have been partly tied to volatility surrounding inclement weather and a strike in the healthcare sector earlier in the year. The broader trend remains one of slower job creation, with firms continuing to tap the brakes as they navigate mounting uncertainty spanning tariffs, geopolitical tensions, a higher-for-longer interest rate environment, and the rapid deployment of AI.
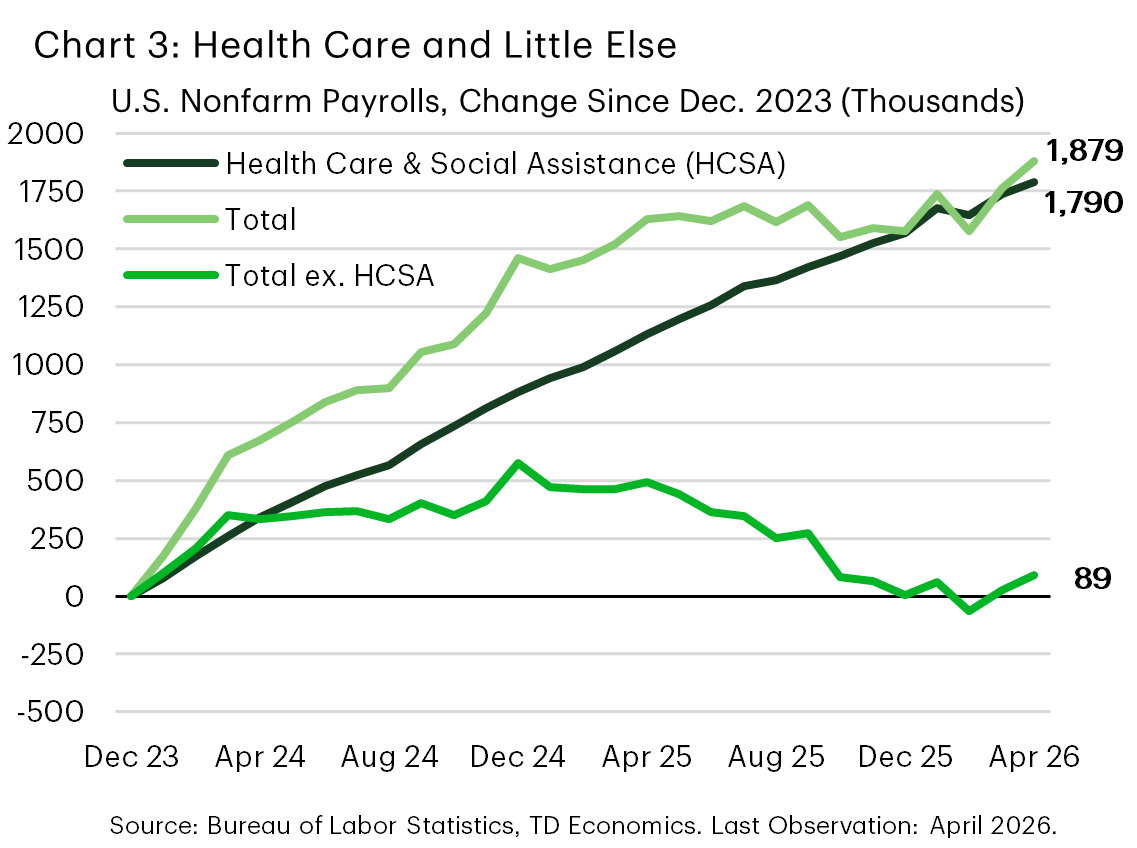
The aggregate picture, however, masks an even more troubling reality. Since the end of 2023, the U.S. economy has added 1.88 million jobs, yet despite accounting for just 15% of the total workforce, the health care and social assistance sector has been responsible for over 95% of that gain, or roughly 1.79 million jobs (Chart 3). Once that sector is removed, hiring has been essentially flat, with fewer than 90k jobs added over the same period. The current environment is not merely one of slower job growth, but of narrowly concentrated job growth, where a single sector is effectively serving as the sole pillar of U.S. hiring activity and masking broad-based weakness across the rest of the labor market.
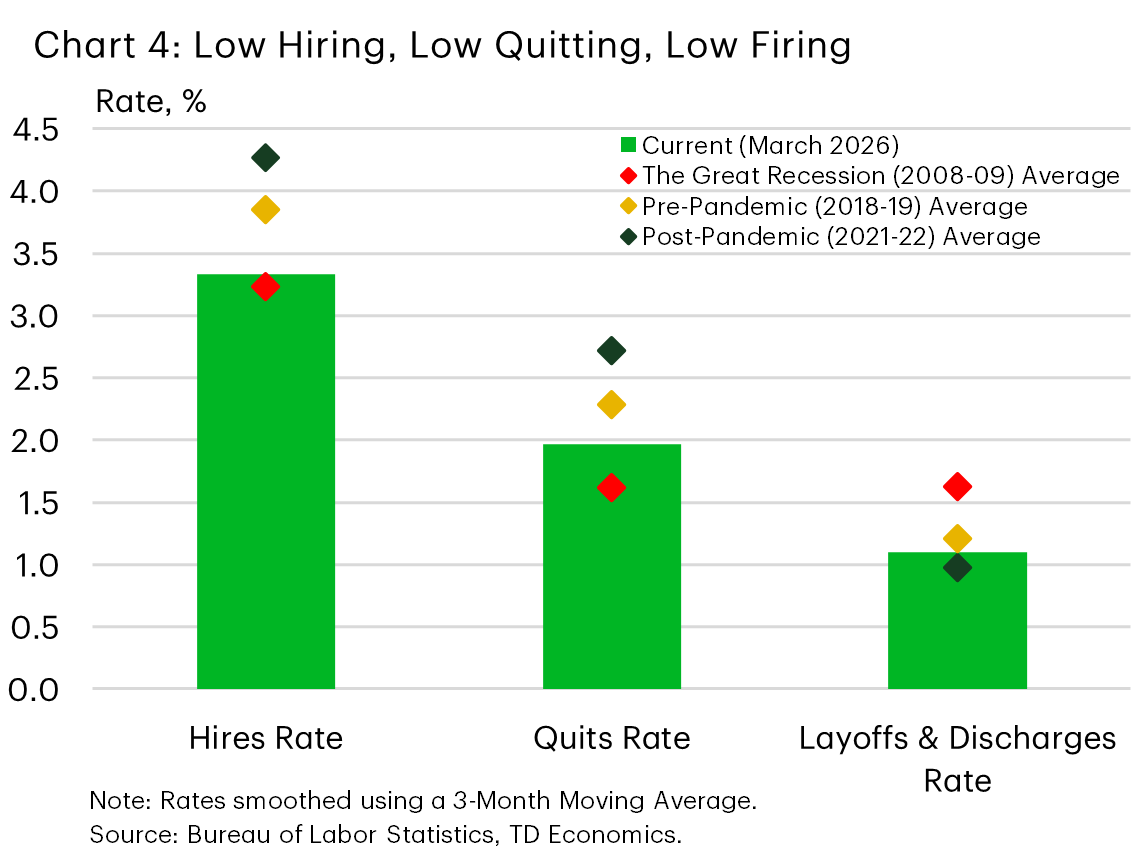
The slowdown in hiring activity has been accompanied by an equally muted pace of labor market dynamism. The quits rate, which measures the share of workers who voluntarily leave their role, is down notably from its post-pandemic average of 2.7% and now sits within close proximity of the 1.6% average recorded during the aftermath of the 2008 financial crisis (Chart 4). This suggests workers are increasingly reluctant to leave their current roles as confidence in external job prospects fades. In contrast, the layoffs and discharges rate, which captures the share of workers involuntarily exiting their roles through employer-initiated separations, has remained largely stable, sitting only modestly above the historically low readings recorded during the post-pandemic period.
A Low-State Equilibrium
Given the slower pace of job creation, it may seem intuitive to expect the unemployment rate to be trending higher. However, the supply of labor has been slowing in tandem, with the labor force 0.6% smaller relative to a year-ago. This reflects a ‘low-state equilibrium’ in which both labor demand and supply are decelerating, allowing the unemployment rate to remain stable even as underlying labor market dynamism weakens.
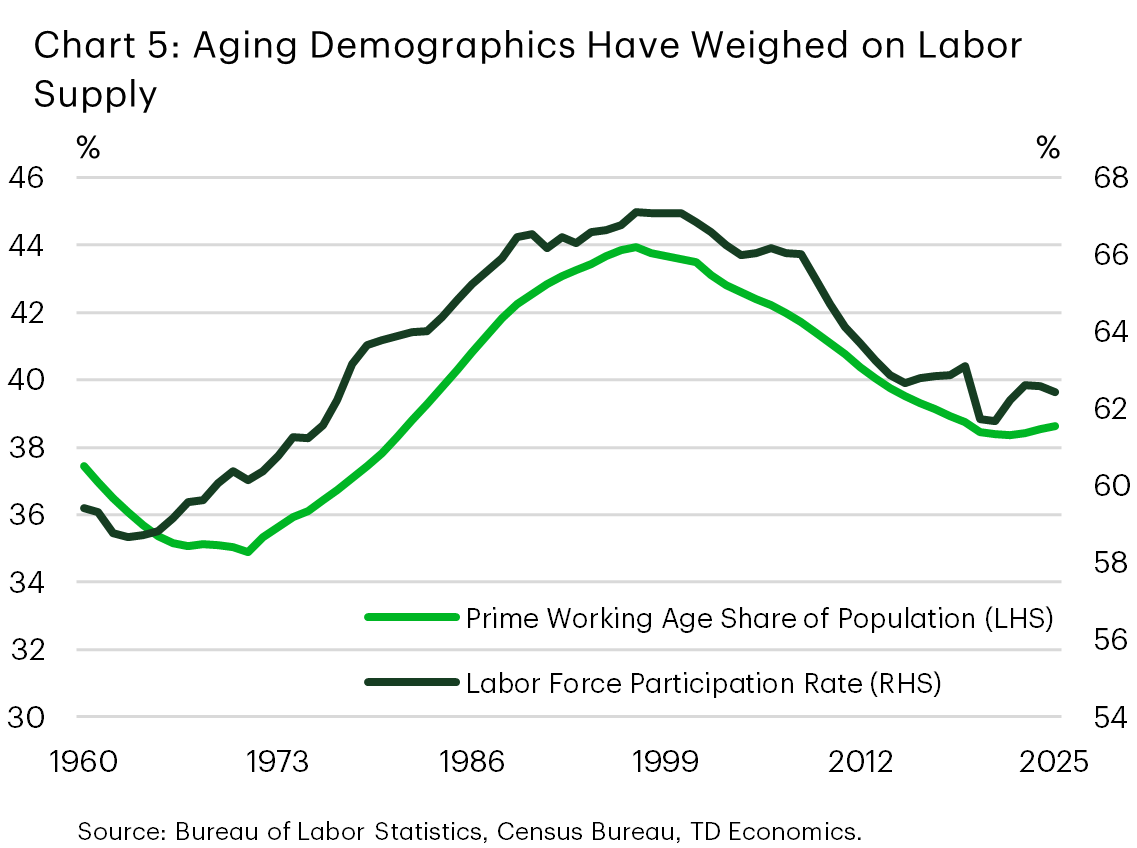
The slowing in labor force growth is a nuanced development, with ties to long-and-short-term trends. The primary reason for the slowdown is tied to aging demographics, which has led to a decline in the share of the population accounted for by the prime working age cohort (25-54). In the late 1990s, this cohort accounted for nearly 45% of the total U.S. population, but in 2025 its share is now closer to 39% (Chart 5). This decline was matched by a commensurate uptick in the share of the population aged 65 and over, which sits at nearly 20% today.
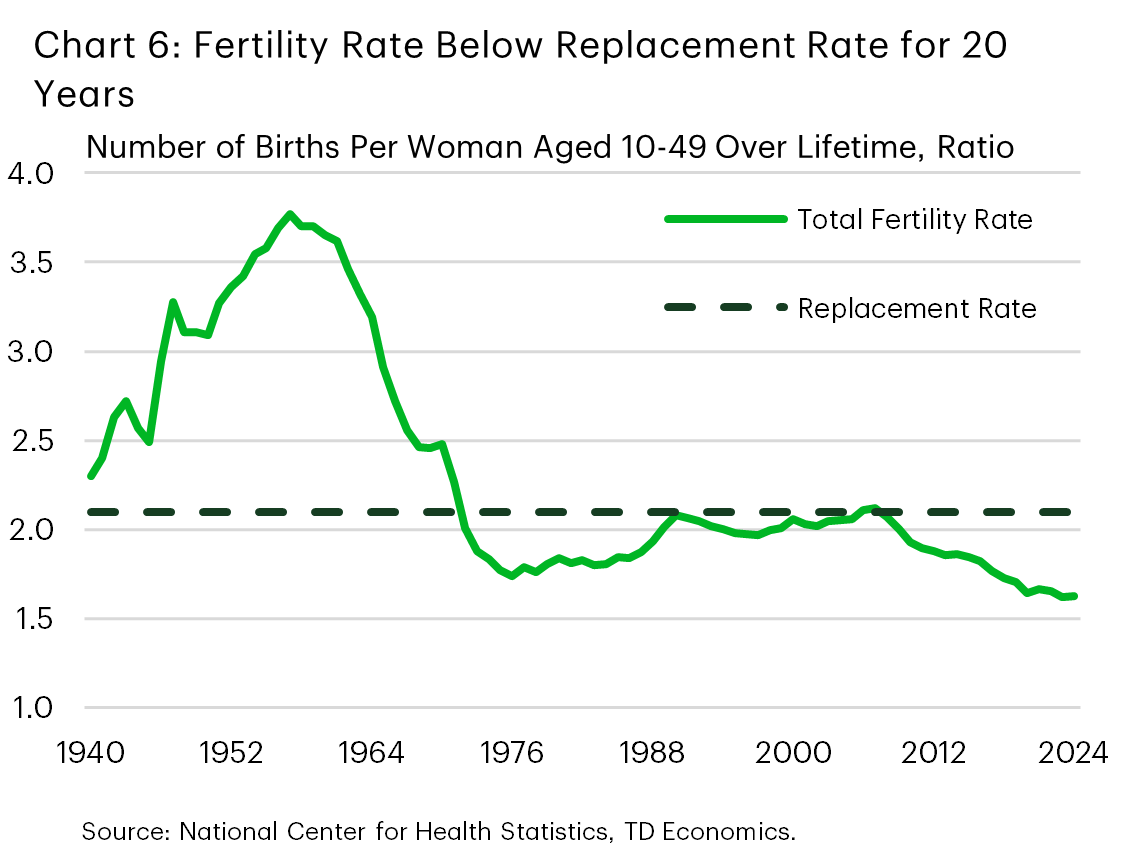
An aging population also has self-reinforcing elements associated with it, namely through a decline in the number of births. This trend has been ongoing for several years in the U.S., with the total fertility rate remaining below the replacement rate since 2007 (Chart 6). The replacement rate is equal to the average number of births per woman over their lifetime required to sustain the population at its current level. With the total fertility rate below that level for roughly two decades now, this is having a growing influence on demographic trends and the labor force.
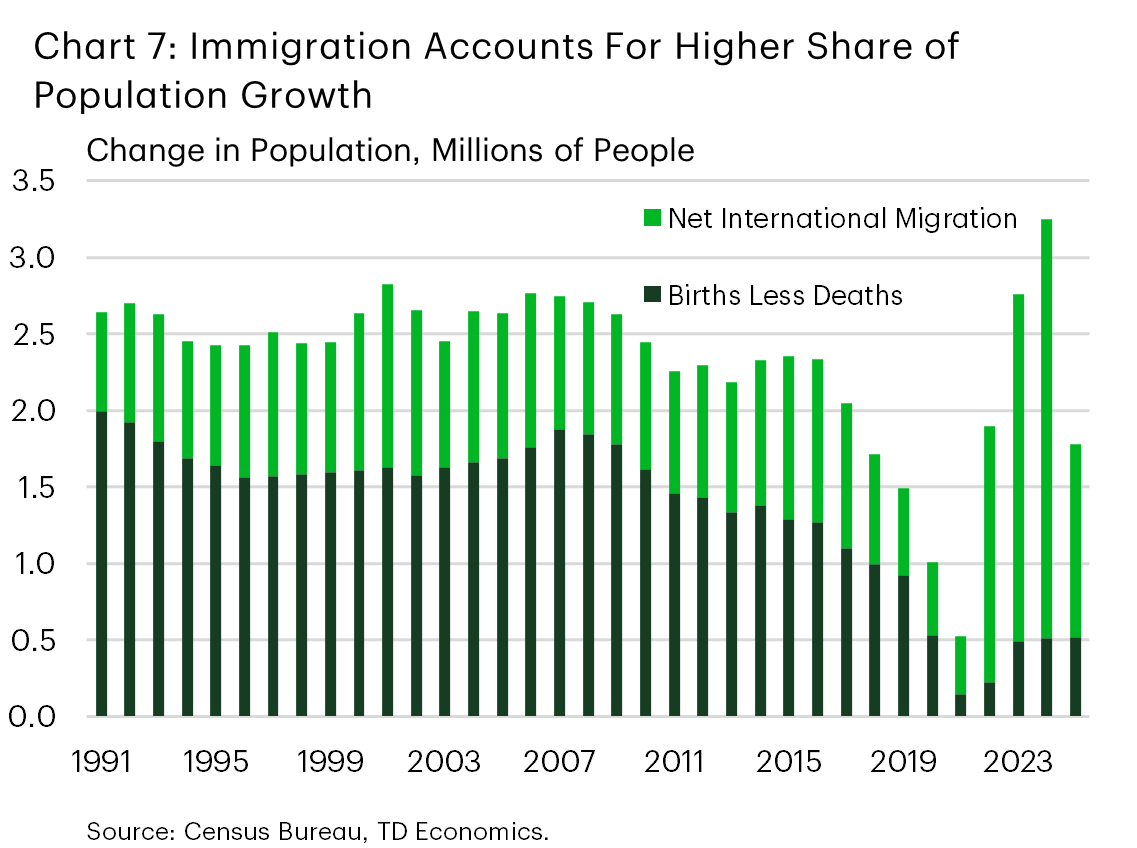
The most direct impact of a declining birth rate has been on the composition of population growth. An expanding population comes from two sources: the number of births net of deaths, and immigration. Between 1990 and 2007, the U.S. had between 1.5 and 2 million births net of deaths (Chart 7). However, they have declined since that point, with net births in 2025 sitting near 0.5 million per year. The direct employment market impact of these trends is lagged by the time it takes to raise the children, but with the decline beginning two decades ago this trend is likely to have a growing influence on the labor market moving forward. This in turn has led to a growing influence for immigration when it comes to population growth.
Over the first two decades of the 21st century, immigration inflows to the U.S. averaged just under 1 million people per year. Inflows fell in the years leading up to the pandemic to an average of half a million people and fell further after the onset of the pandemic. In the following years, immigration rose notably to a peak of 2.7 million in 2024. Since then, immigration flows have fallen, with inflows totaling 1.3 million last year. With this momentum expected to be sustained in 2026, it will continue to mitigate pressure on the economy to create new jobs for new entrants.
Implications for the Federal Reserve
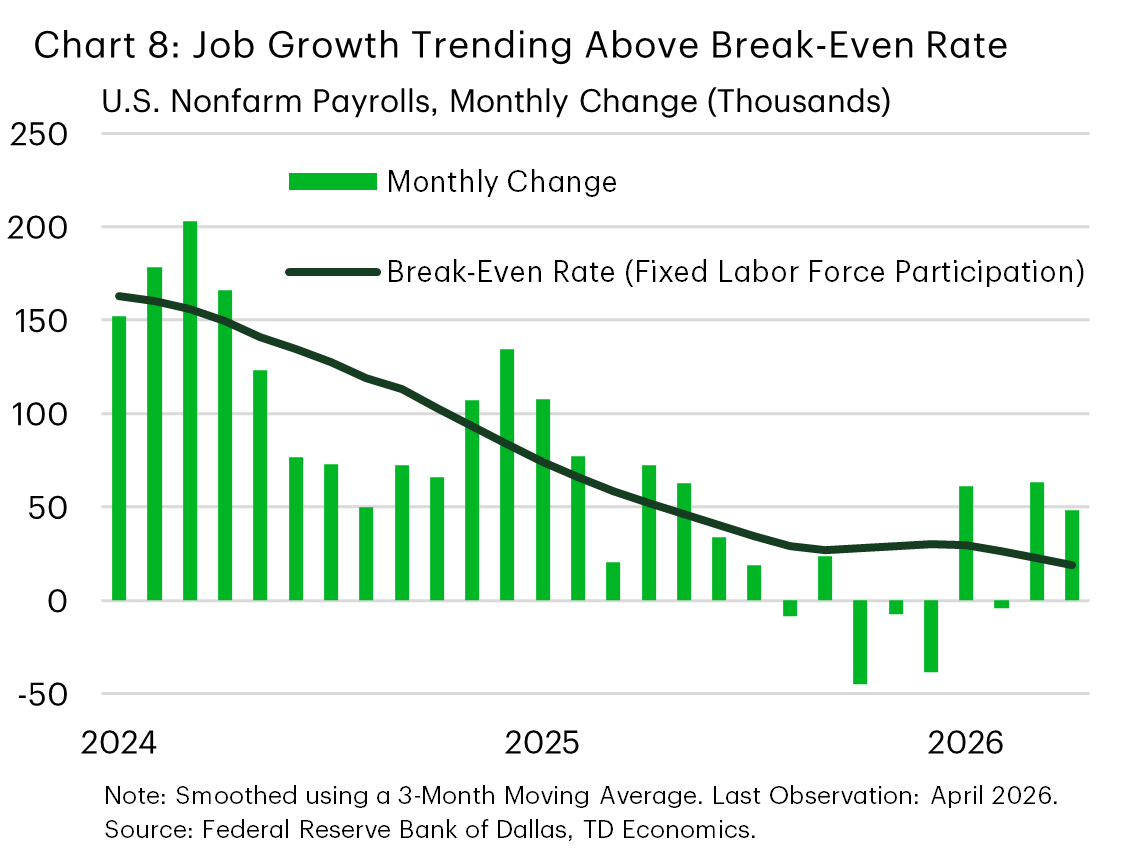
Cumulatively, these factors have led to a slowdown in labor force growth and kept the unemployment rate stable despite the slower pace of job creation. As a result, the number of new jobs needed to keep the unemployment rate stable, referred to as the break-even level of employment, is estimated to have fallen from roughly 150k jobs 2 years ago to 30-40k today (Chart 8).
 With upward pressure on the unemployment rate largely constrained by these developments, the Federal Reserve has been able to place greater emphasis on the risks posed to its price stability mandate amid elevated global energy prices. With inflation near 4% in April – roughly double the Fed’s 2% target – and the unemployment rate stable in the estimated neutral range, the central bank is understandably more concerned about the former. However, the developments in the labor market are likely to be structural, meaning they will merit consideration for their influence over the long-run objectives of the Federal Reserve.
The central issue for policymakers with a labor market that has structurally weak labor force growth is that it can create asymmetries in the response to economic shocks. In moderate downturns, slack may build more gradually, while expansions can tighten conditions more rapidly than in prior cycles. In turn, the influence of these trends on wage growth and inflation would be similarly asymmetric all else equal. This means the Federal Reserve would face less pressure to respond to downturns while expansions may require a more aggressive response. These dynamics could result in an upward bias in the policy response function and interest rates over the long-term.
Currently, this is just one structural influence on the labor market that is interacting with other temporary and structural influences (i.e. fiscal policy support, technological innovation, etc.). However, with aging demographics projected to become a growing influence on the economy, these dynamics will warrant more serious consideration – a prospect which should be contemplated by policymakers in the present.
Bottom Line
The U.S. labor market appears to be settling into a lower-growth equilibrium, where softer labor demand is being offset by slower labor supply growth. That helps explain why the unemployment rate has remained relatively stable despite weaker hiring momentum, and why the threshold for maintaining labor market balance has fallen materially. At the same time, this equilibrium is not without risk. While current cyclical weakness is limiting near-term overheating, structural demographic constraints mean that any future reacceleration in activity could push the unemployment rate lower more quickly than in the past, reviving wage and inflation pressures. In that sense, a cooler labor market does not necessarily imply a looser policy backdrop: for the Federal Reserve, the challenge is that labor market slack may now build more slowly in downturns but disappear more quickly in recoveries. With aging demographics expected to sustain structurally lower labor force growth moving forward, these challenges are likely to become of increasing importance over the long-term.
Disclaimer
This report is provided by TD Economics. It is for informational and educational purposes only as of the date of writing, and may not be appropriate for other purposes. The views and opinions expressed may change at any time based on market or other conditions and may not come to pass. This material is not intended to be relied upon as investment advice or recommendations, does not constitute a solicitation to buy or sell securities and should not be considered specific legal, investment or tax advice. The report does not provide material information about the business and affairs of TD Bank Group and the members of TD Economics are not spokespersons for TD Bank Group with respect to its business and affairs. The information contained in this report has been drawn from sources believed to be reliable, but is not guaranteed to be accurate or complete. This report contains economic analysis and views, including about future economic and financial markets performance. These are based on certain assumptions and other factors, and are subject to inherent risks and uncertainties. The actual outcome may be materially different. The Toronto-Dominion Bank and its affiliates and related entities that comprise the TD Bank Group are not liable for any errors or omissions in the information, analysis or views contained in this report, or for any loss or damage suffered.
Download
Share: