U.S. Inflation – A Tale of Crosscurrents
Thomas Feltmate, Director & Senior Economist | 416-944-5730
Paul Kim, Economic Analyst
Date Published: September 3, 2026
- Category:
- U.S.
- Government Finance & Policy
- Consumer
Highlights
- Decomposing U.S. core inflation into its key drivers reveals a mixed bag.
- Despite still-elevated energy prices, the extent of pass-through to core measures has proved minimal outside of a few pockets. Likewise, tariff-driven pressure on core prices has already peaked.
- On the flip side, the AI demand push has increased cost pressures for certain consumer electronics and software. Although these make up a small share of core inflation, the upward pressure has been material, estimated to have added about 0.7-0.8 percentage points to the measure so far this year.
- On net, we still see a path back to 2% core inflation, but the adjustment is unlikely to assert itself convincingly until year end and the balance of risks tilt to a continued overshoot in the interim.
- This will test the Fed’s patience. Chair Warsh already noted in August “we’re just not seeing enough cooling across the broader categories to give us the confidence that we’re on track back to 2%”. A lot is riding on upcoming data releases (notably the August CPI report on September 11th) to show sufficient improvement to stay the central bank’s hand on rate increases.
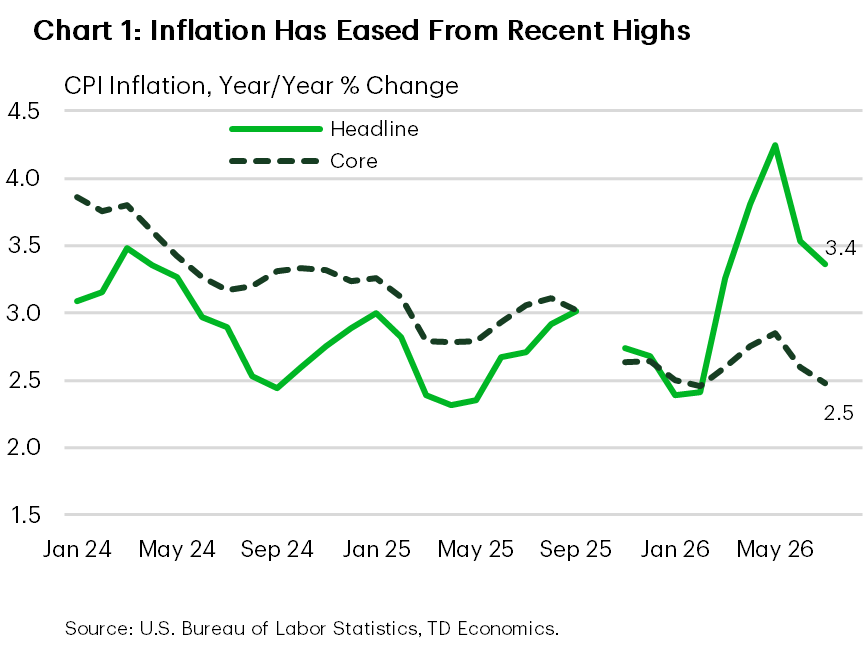
After reaching a four-year high of 4.2% year-over-year in May, CPI inflation has fallen to 3.4% as of July (Chart 1). The easing in price pressures has largely been driven by some easing in energy prices, with fading tariff passthrough also providing some relief. This is welcome news for Fed officials, who have become increasingly concerned about inflation’s five-year run above its 2% target. But the two cooler readings are by no means confirmation that inflation is on a steady path back to 2%.
Oil prices have eased from their March highs, but several factors continue to keep prices elevated. The conflict in the Middle East remains unresolved, shipping traffic through the Strait of Hormuz is still minimal, and renewed attacks have heightened concerns around ongoing supply disruptions. Beyond geopolitics, the IEA’s record 400-million-barrel emergency oil release is in the process of being wound down, while resilient demand and tight refined product markets are expected to keep a floor under prices in the near-term. Beyond the energy worries, AI demand pressures are also surfacing in electronic devices and software prices – offsetting some of the disinflationary force from fading tariff impacts. How much and for how long these AI price pressures persist remains unclear. At a minimum, they are likely to slow inflation’s adjustment back to the Fed’s target. Our baseline forecast remains for the Fed to hold rates steady at its next meeting. However, Chair Warsh’s more hawkish message at Jackson Hole has raised the stakes around the August CPI report: a hotter-than-expected print could leave the FOMC feeling compelled to tighten policy to preserve the Fed’s credibility. Officials have spent recent months underscoring their commitment to price stability, and at some point, that rhetoric will need to be backed by action if inflation fails to show sufficient progress.
Inflation cools on easing energy costs
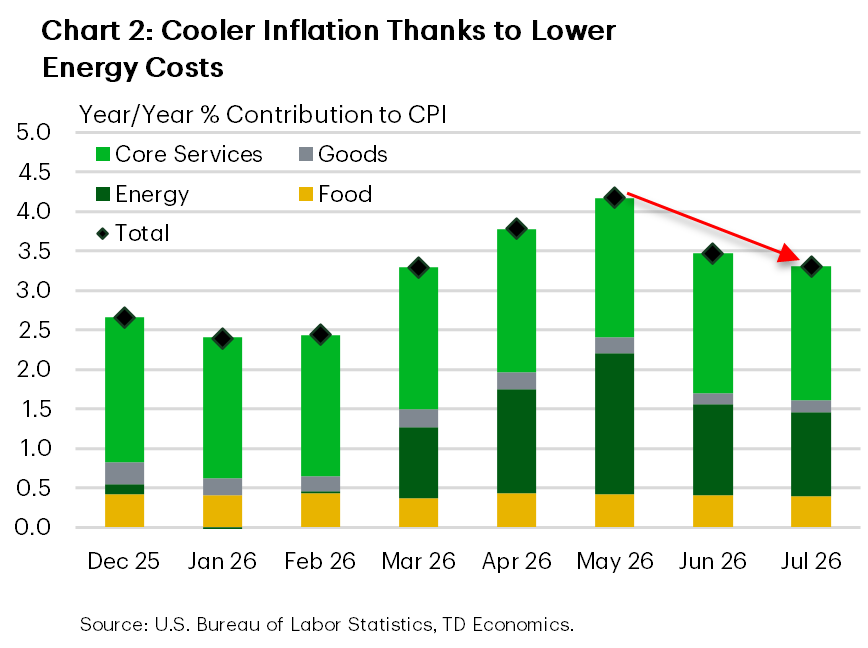
The last two inflation prints showed price pressures easing, driven mainly by lower energy prices in June and July. During this time, national gasoline prices fell from $4.56 per gallon to about $4, shaving roughly three-quarters of a percentage point from CPI and accounting for about 85% of the two-month deceleration (Chart 2). Since then, oil and gasoline prices have rebounded, suggesting that energy will provide little additional disinflationary relief to headline CPI in the months ahead.
Importantly, second-round effects of higher energy costs on prices elsewhere in the economy have appeared limited so far. Aside from higher fuel costs, airfares are the only other category showing a notable impact, rising roughly 7–11% since February depending on the inflation measure. Even there, it is difficult to separate fuel passthrough from other factors, including stronger World Cup-related demand.
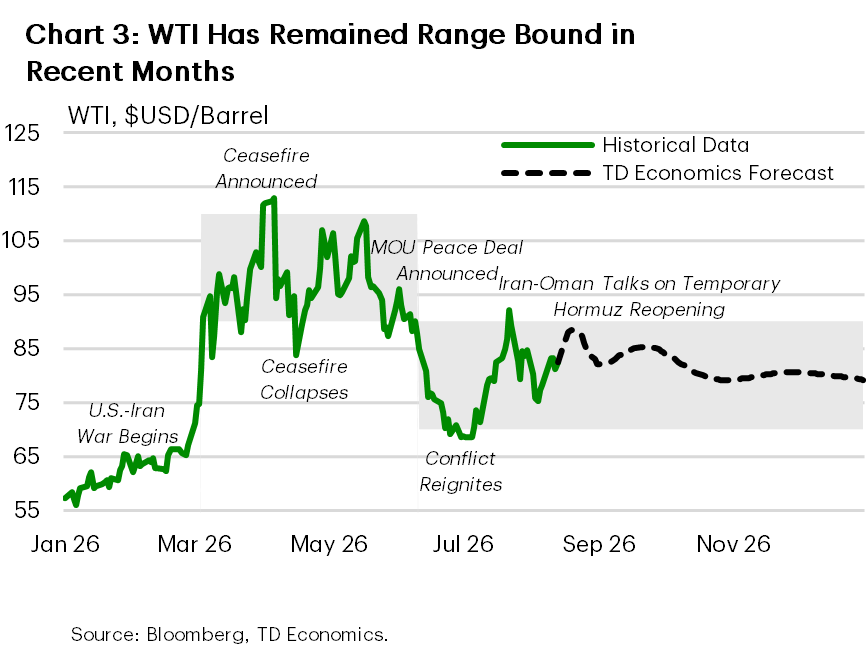
The muted passthrough likely reflects the short-lived nature of the initial oil-price spike after the Middle East conflict began (Chart 3). Businesses appear to have treated the initial shock as temporary, particularly with WTI later settling into the $70–$90/bbl range. Even at the upper end of that level (where prices are today), it’s unlikely to generate much in the way of broad price pressures amid softer labor demand and moderating wage growth. However, the main watchpoint going forward is refined products: diesel and jet fuel inventories are already tight by historical standards, and a further rise in crude prices would only intensify those pressures. With spare refining capacity limited, further supply disruptions can translate into outsized increases for end-use fuels.
A renewed oil-price breakout is not our base case, but it remains a plausible risk. Rerouted supply, commercial and strategic stockpile drawdowns, lower Chinese imports, and increased production outside the Gulf have all helped put a lower ceiling on crude prices in recent months. But inventory drawdowns have limits, and alternative trade routes have both increased delivery timelines and pushed transportation costs higher. For the time being, our baseline forecast assumes oil prices remain range-bound near $80–$90/bbl in coming months before renewed diplomacy later this year helps restore some lost Gulf supply and pulls prices back to the low-to-mid $70s in 2027. This should help to keep the second-round effects minimal and lead to further downward pressure on headline inflation later this year.
Fading tariff effects also helping
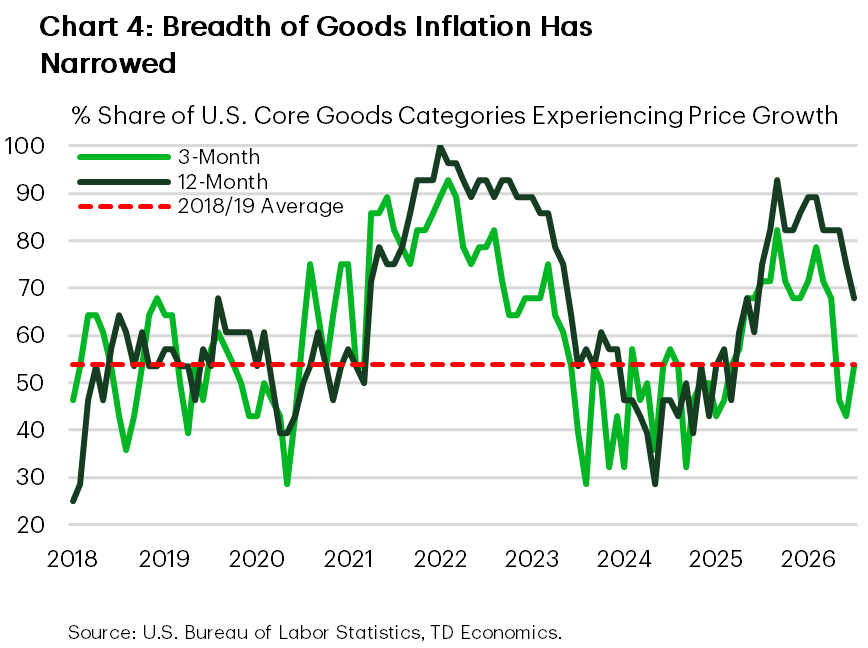
Taking a broader view of 2026 shows the price effects from last year’s tariff increases appear to be fading. At its peak in late-2025, goods prices (excluding food & energy) were running at an annualized rate of 1.5% and were contributing 0.4 percentage points to core inflation. Today, its contribution has slowed to about half of that, while the share of goods categories registering price growth has narrowed considerably (Chart 4). A closer look at the more tariff-exposed goods categories, including home appliances, furniture & bedding, apparel, and medical equipment, have all shown either a meaningful slowing in inflation or outright price declines over the last three months.
That said, the ongoing trade skirmish with Canada remains a risk. The overall inflation impact from the recently announced Section 338 tariffs is likely to be relatively small as only $20 billion of goods (or 1% of total annual U.S. imported goods) will be impacted. However, following Canada’s retaliation to the Section 338’s, the U.S. administration has threatened to impose a 50% tariff on all imports of Canadian vehicles and motor vehicle parts, effective January 1, 2027. This would mark a major escalation in trade tensions and pose a substantial headwind to auto production on both sides of the border. Given the potential economic fallout, we expect cooler heads to prevail and the two countries to reach a resolution over the coming months. More broadly, assuming we’re closer to a steady state on tariff policy, the price effects on consumer inflation should continue to fade through H2-2026.
AI demand push obscuring fading tariff impact
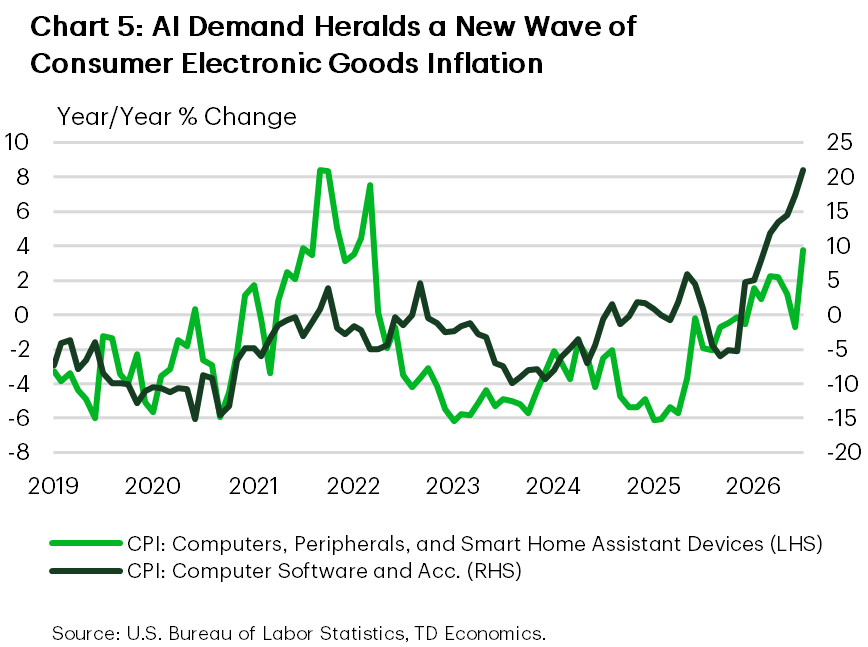
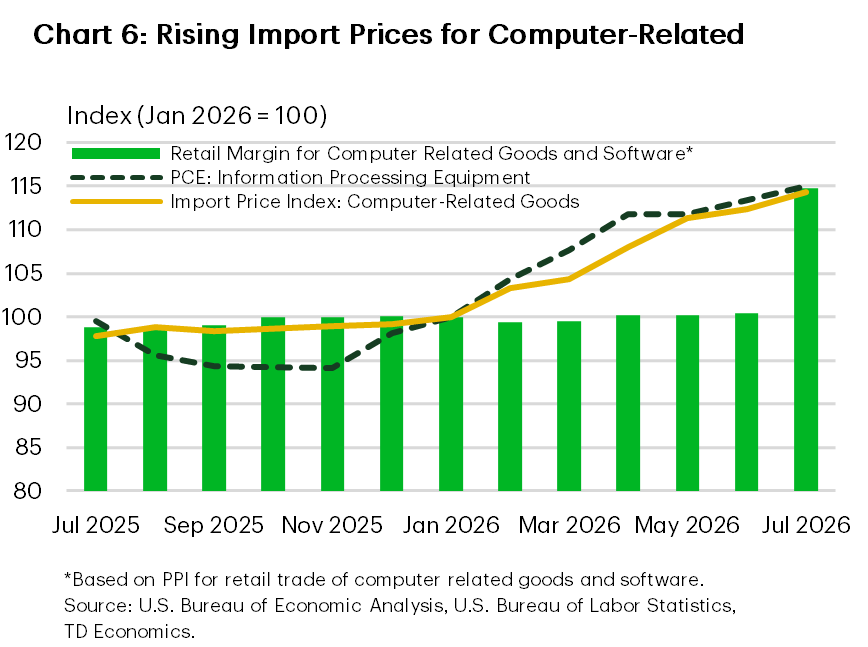
Tariffs have not been the only source of upward pressure on goods prices this year. Unprecedented capital spending by AI hyperscalers has intensified demand pressures, contributing to a wave of price increases across software and consumer electronics. As of July, consumer prices for computer software and accessories have soared more than 20% since last December, while computer and peripheral equipment prices have increased 8.6% (Chart 5). With retail margins for computer-related goods having jumped 14% in July after remaining remarkably stable despite rising imports and producer prices, it suggests that costs have been largely passed on to the consumer (Chart 6).
Despite steep price increases, the CPI impact has been limited because these two categories make up just 0.34% of the overall index and 1.8% of core goods prices. However, these categories carry more weight in the PCE basket - accounting for 1.6% of the overall PCE index and 7.4% of core goods prices. As a result, these price increases are having a larger impact on the inflation measure that the Fed explicitly targets (Chart 7).
Hyperscalers’ AI capex is projected to reach trillions of dollars annually over the next few years. However, many of the largest memory fabrication projects being built to meet this demand are not expected to make meaningful contribution to supply until later in the decade. Notably, Micron’s megafab in New York state – once operational, will be the largest memory chip manufacturing site in U.S. history – isn’t expected to begin its chip production until 20301. This supply-demand gap raises the risk that elevated memory prices could continue to generate second-order inflation effects for years ahead. In an early indication of the so-called “chipflation” starting to broaden out, GM’s CFO recently pointed to tighter supplies for memory chips pushing up vehicle production costs, which will eventually result in some cost increases2.
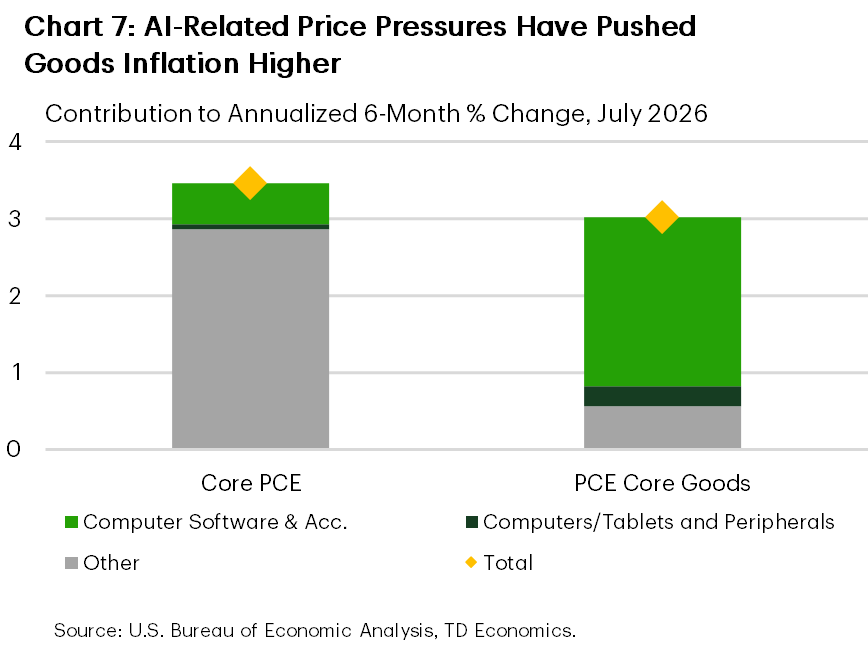
Our analysis shows that AI demand pressures have contributed 0.8 and 0.7 ppts to annualized core PCE price growth in Q1 and Q2 of 2026, respectively. At present, the data does not point to a material broadening of AI-related price pressures beyond directly affected consumer goods categories. For now, we embed a mild AI passthrough in our inflation forecast, concentrated in electronic and software costs, with some spillover to new vehicle prices, but assume its impact peters out by the end of next year.
August inflation will decide Fed’s next move
From the Fed’s perspective, the recent softer inflation readings are welcome but are not enough to ease concerns that price pressures could prove more persistent – something Chair Warsh emphasized in his Jackson Hole speech. His remarks along with a growing number of other committee members have shown little appetite to continue to look through price shocks, given inflation’s +5 year run above the Fed’s 2% target.
And there’s good reason for skepticism. Recent disinflation has largely reflected lower energy prices and fading tariff passthrough. The breadth of services inflation has also narrowed, but it remains elevated and sticky, underscoring the persistence of underlying price pressures. With the conflict in the Middle East re-escalating amid already tight refined product markets, and AI-related cost pressures emerging, inflation risks continuing to overshoot the Fed’s 2% target unless policymakers raise rates.
Provided the AI price shock does not intensify beyond what we currently assume, tariff impacts continue to fade, and diplomatic negotiations eventually lead to a resumption of oil flows out of the Gulf, we still see a path back to 2% inflation in 2027. This would open the door to a couple more rate cuts in late 2027 and early 2028. But there are a lot of “ifs” underpinning the forecast, making it difficult to have a high degree of conviction in the call. Moreover, patience has worn thin among FOMC participants, and Chair Warsh’s remarks at Jackson Hole suggest the Fed’s reaction function has become increasingly asymmetric: it may take only one hot inflation report to trigger further tightening. In that event, a rate increase would likely be motivated more by the need to preserve the Fed’s credibility rather than a fundamental reassessment of what it will take to return 2% inflation. Policymakers have repeatedly emphasized their commitment to restoring price stability; if the data fails to cooperate, they may ultimately need to reinforce that message with action. Suffice it to say, much is riding on the August CPI report ahead of the Fed’s next meeting on September 16.
End Notes
Disclaimer
This report is provided by TD Economics. It is for informational and educational purposes only as of the date of writing, and may not be appropriate for other purposes. The views and opinions expressed may change at any time based on market or other conditions and may not come to pass. This material is not intended to be relied upon as investment advice or recommendations, does not constitute a solicitation to buy or sell securities and should not be considered specific legal, investment or tax advice. The report does not provide material information about the business and affairs of TD Bank Group and the members of TD Economics are not spokespersons for TD Bank Group with respect to its business and affairs. The information contained in this report has been drawn from sources believed to be reliable, but is not guaranteed to be accurate or complete. This report contains economic analysis and views, including about future economic and financial markets performance. These are based on certain assumptions and other factors, and are subject to inherent risks and uncertainties. The actual outcome may be materially different. The Toronto-Dominion Bank and its affiliates and related entities that comprise the TD Bank Group are not liable for any errors or omissions in the information, analysis or views contained in this report, or for any loss or damage suffered.
Download
Share: