Assessing The Recent Impact of Higher Oil Prices on the U.S. Economy
Thomas Feltmate, Director | 416- 944-5730
Date Published: October 31, 2023
- Category:
- Us
- Commodities & Industry
Highlights
- Oil prices have risen sharply in recent months alongside OPEC+ supply cuts, resilient global demand, and the recent escalation of geopolitical tensions in the Middle East.
- At this point, the drag to U.S. economic growth is estimated to be small, amounting to no more than a few tenths of a percentage point.
- A further escalation in geopolitical tensions stands to not only pressure oil prices higher but, if sustained, would also lead to more persistent inflationary pressures.
- At a minimum, this would require rates to remain higher for even longer but could also push the Fed to bump up its terminal rate to 6%.
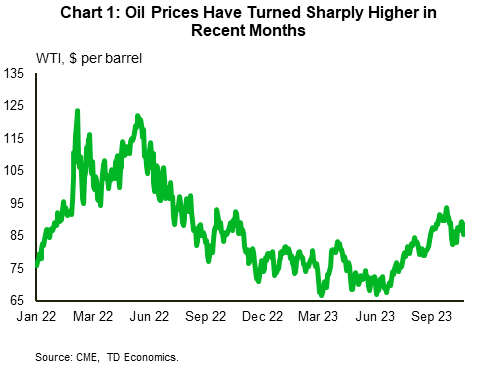
Oil prices have been on a wild ride this year. Since reaching a low of $68 per-barrel back in June, the price of WTI had steadily trended higher through September, briefly touching a thirteen-month high of $95 per-barrel (Chart 1). Prices have since pared some of those gains but have remained volatile given the ongoing geopolitical tensions in the Middle East. Though our baseline forecast assumes oil prices holding steady through the remainder of the year, another leg higher cannot be ruled out. An obvious question is what the recent uptick, and potentially another leg higher, means for the U.S. economic outlook, and how it might impact the Federal Reserve’s policy stance over the coming months.
At this point, the overall drag to economic growth from the recent uptick is expected to be quite small, amounting to no more than a couple tenths of a percentage point from 2023 growth. For an economy that is expected grow by 2.5% this year, that is little more than a rounding error. However, this assumes oil prices evolve broadly in line with our baseline oil forecast. A further escalation in geopolitical tensions stands to not only push oil prices higher, but also lead to higher and more persistent inflationary pressures. At a minimum, this would require rates to remain higher for even longer. However, a more restrictive policy stance – above both ours and FOMC’s current expected terminal rate of 5.75% – also cannot be ruled out, particularly in the event that higher oil prices lead to an upward drift in inflation expectations.
The Bite from Higher Oil Prices Has Softened Over Time…
Oil price shocks seem to be occurring more frequently alongside ongoing geopolitical flare-ups. The traditional rule of thumb applied to the U.S. economy is for every $10 per-barrel increase in the price of oil, economic activity is reduced by 0.1-0.3 percentage points. The primary impact is felt by the consumer, as they are unable to substitute away from gasoline and home heating sources in the short run, which ultimately means higher fuel costs leave less room for other discretionary spending.
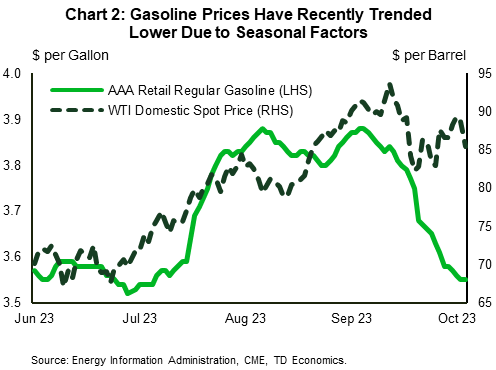
At this point, we are likely at the lower end of the range in terms of overall economic impacts. Despite oil prices having increased roughly 25% from their June low, prices at the pump (at their peak) only rose by 10%. However, since peaking in mid-September, gasoline prices have fallen sharply and are currently less than 1% above their June low (Chart 2). In part, the recent pullback in gasoline prices reflects seasonal factors related to both lower demand as well as less expensive blends of ‘winter gasoline’ coming to the market a bit earlier this season. Also helping to offset the recent rise in oil prices is the fact that gasoline inventories are currently sitting at the highest level in 18-months, which has put a lower ceiling on prices over the near-term.
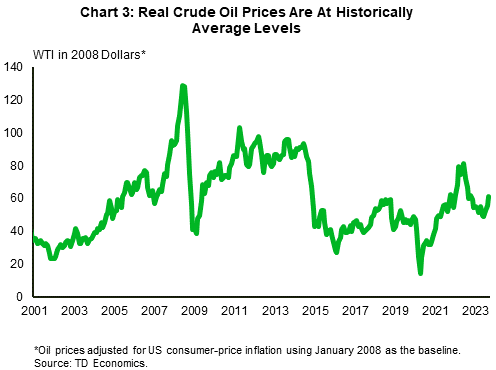
Today’s ‘elevated’ oil prices also need to be put into historical context. As we highlighted in a recent note, after adjusting for inflation, today’s price is around 50% less than the peak in 2008 and 20% lower than the 2011-2015 average real price (Chart 3). A simple example illustrates how this impacts the average consumer. Back in October 2011, oil was trading around current levels and gasoline prices were also hovering near today’s prices of $3.5 per-gallon. At the time, hourly private-sector earnings were just over $23 per-hour, which would purchase approximately 6.6 gallons of gasoline. However, today’s wages are 46% higher, which means that same hour of work can now purchase that much more gasoline. This gain in purchasing power has significantly reduced the bite from higher oil prices over the past decade.
…But the Hit to Inflation Remains a Threat
Perhaps more concerning is the threat that higher oil prices pose to the inflation outlook. Since peaking at 9.1% last June, headline inflation has fallen by over five percentage points, with nearly three-quarters of that decline attributed to lower energy prices. At this point, the year-over-year disinflationary force from falling energy prices has largely petered out and could very easily move in the opposite direction if oil prices push meaningfully above today’s levels for a sustained period.
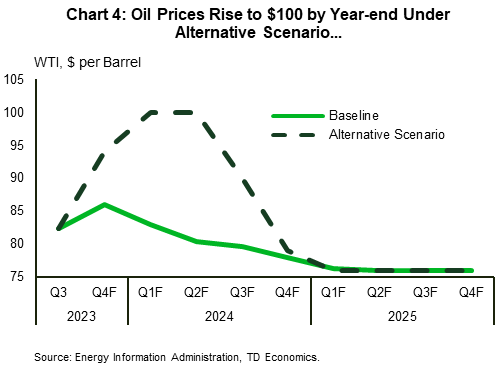
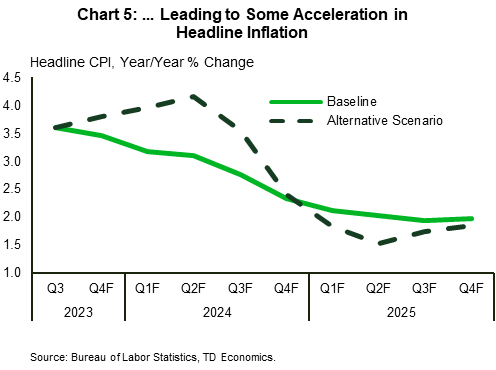
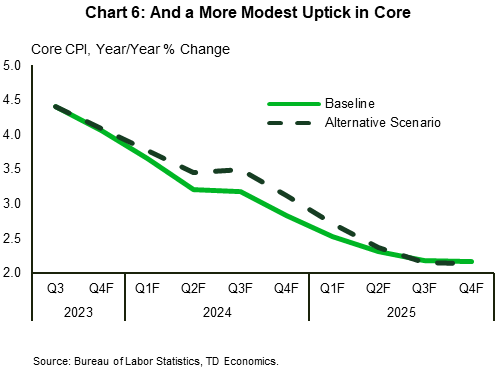
Under our baseline forecast, headline CPI is expected to edge only slightly lower through the remainder of this year and not push below 3% until Q3-2024. However, under an alternative scenario where the price of WTI reaches $100 per-barrel by year-end and sustains that level through mid-2024, we estimate that it would add a full percentage point to headline inflation (Charts 4 & 5). While most of the impact would be through the direct effects of higher energy prices hitting consumers at the pump, there would also be some secondary pass-through effects to core inflation. These indirect effects represent what producers ultimately pass on to consumers and typically feed through with a longer lag. Our simulations show that it could add up to another 0.3 percentage points to our baseline core inflation forecast by Q3-2024 which would keep core running north of 3% by the end of 2024 (Chart 6).
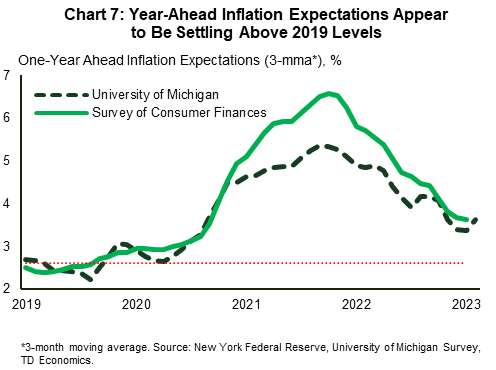
Equally as concerning is the potential impact to inflation expectations. Consumers traditionally take their cues on near-term inflation expectations based on prices at the pump and what they’re paying at the grocery store. Over the past 16-months, multiple surveys have shown 1-year ahead inflation expectations having drifted lower, but more recent data points have shown some uptick. Smoothing through the volatility shows that inflation expectations appear to be flattening out at a level that is nearly a full percentage point above their 2019 average (Chart 7). This is a worrying sign for policymakers but could become even more problematic if oil prices take another lag higher. Left unchecked, persistently elevated inflation expectations can create a vicious cycle where workers and unions demand similar-sized pay raises to ensure incomes gains are keeping up with inflation, thereby preventing the Fed from returning price stability. This was the exact scenario that played out in the 1980’s and it wasn’t until the Fed brought the policy rate so far into restrictive territory that a recession occurred that inflation expectations became re-anchored.
Fed to Deliver At least One More Rate Hike
Policymakers are by no means looking for a repeat of the 1980s, and so far, progress on the inflation front has been promising. At this point, the economic and inflationary impacts stemming from the recent upturn in oil prices appear relatively small and are unlikely to materially alter the Fed’s near-term decision making. If anything, the recent flattening in inflation expectations at a still elevated level reinforces the notion that rates need to remain ‘higher for longer’. It also supports our baseline forecast that policymakers are likely to follow through with one more rate hike later this year before calling it quits on the tightening cycle.
That said, another leg higher in oil prices (if sustained) would work to slow the disinflationary process and undermine some of the recent progress on re-anchoring inflation expectations. Under such a scenario, the Fed would likely have to keep rates higher for even longer, and potentially take a slightly more restrictive policy stance to ensure inflation returns to 2% over the medium-term.
Disclaimer
This report is provided by TD Economics. It is for informational and educational purposes only as of the date of writing, and may not be appropriate for other purposes. The views and opinions expressed may change at any time based on market or other conditions and may not come to pass. This material is not intended to be relied upon as investment advice or recommendations, does not constitute a solicitation to buy or sell securities and should not be considered specific legal, investment or tax advice. The report does not provide material information about the business and affairs of TD Bank Group and the members of TD Economics are not spokespersons for TD Bank Group with respect to its business and affairs. The information contained in this report has been drawn from sources believed to be reliable, but is not guaranteed to be accurate or complete. This report contains economic analysis and views, including about future economic and financial markets performance. These are based on certain assumptions and other factors, and are subject to inherent risks and uncertainties. The actual outcome may be materially different. The Toronto-Dominion Bank and its affiliates and related entities that comprise the TD Bank Group are not liable for any errors or omissions in the information, analysis or views contained in this report, or for any loss or damage suffered.
Download
Share: