The U.S.’s Immaculate Disinflationary Process:
What Can Go Wrong?
Thomas Feltmate, Director & Senior Economist | 416-944-5730
Andrew Hencic, Senior Economist | 416-944-5307
Date Published: April 24, 2024
- Category:
- Us
- Financial Markets
- Consumer
Highlights
- The Federal Reserve has made incredible progress on its fight against inflation. As of February, the 12-month change on core PCE sits at 2.8% - the slowest pace of growth since March 2021.
- However, inflation progress has stalled more recently and current risks to the outlook are overwhelmingly skewed to the upside – putting in jeopardy our long-held view of a July rate cut.
- In this paper, we explore several plausible alternative scenarios around the baseline inflation outlook and assess how each could alter the Fed’s policy stance.
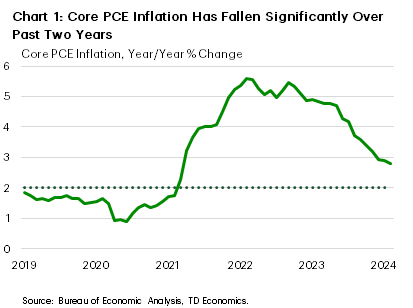
The Federal Reserve has made incredible progress on its fight against inflation. As of February, core PCE inflation has halved from its February 2022 peak and currently sits at 2.8% – the slowest pace of growth since March 2021 (Chart 1).
Despite the 12-month change showing a ‘two-handle’ for the last three consecutive months, it’s still too early for the Fed to declare victory. There are three main plausible risks to our baseline forecast (see table on page 6) that could push inflation off course in the near term and alter the path for Fed rate cuts. In this paper, we explore the forces driving our current baseline forecast and use scenario analysis to quantify how each of the key risks could alter the Fed’s course of action over the coming years.
All About That Base... Line Forecast
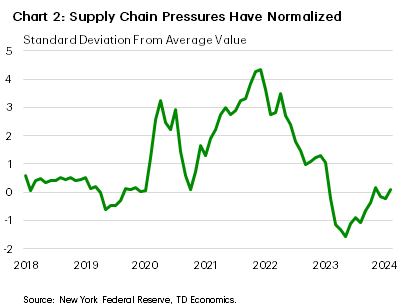
Falling goods prices have been a major source of disinflationary pressure over the past two years – accounting for roughly 80% of the decline in core PCE relative to its peak. However, with supply chains having largely healed from the pandemic (Chart 2), the downward force from fallings goods prices is likely to peter-out over the coming months, which means the rest of the heavy lifting will need to come from the stickier service-side. From that perspective, monthly readings on core PCE through the second half of this year will look comparatively worse to the same month the year prior. This means that the 12-month change on core inflation is likely to bottom-out by the second quarter somewhere in 2.5 %-2.7% range, and then briefly drift higher through the second half of the year before returning to 2% by the end of next year.
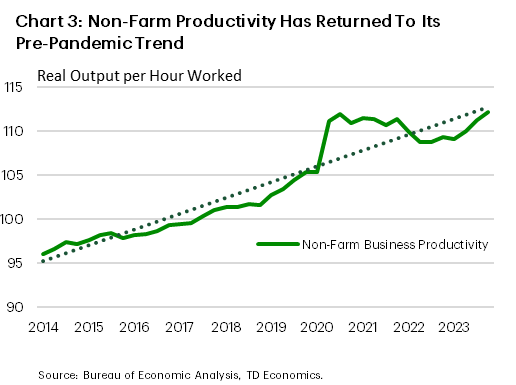
Outside of falling goods prices, gains in productivity have also been a factor that allowed inflation to cool last year despite the economy still growing at a strong clip. All else equal, faster growth in productivity enables the economy to expand more rapidly without generating the same degree of inflationary pressures. However, this is also likely to have much less influence over the coming year. Today’s level of productivity has already returned to something that looks very close to its pre-pandemic trend (Chart 3). While there’s some evidence to suggest that a combination of capital deepening (driven by ongoing labor scarcity) alongside investments in artificial intelligence may result in a structurally higher rate of productivity growth, it’s still too early to know definitively if/when that will play out. Our best guess today is that productivity will likely grow more in line with its pre-pandemic pace (~1.3%) over the coming years.
This means a period of weak economic growth will likely be required to return to price stability. Our baseline forecast assumes GDP slows below its long-run potential for a few quarters, while labor demand cools such that job growth slows considerably through the second half of the year, pushing the unemployment rate slightly above its long-run average. Income growth decelerates, which ultimately weighs on consumer spending, exerting further downward pressure on service inflation.
Provided inflationary pressures evolve as expected, the Federal Reserve could gain ‘sufficient confidence’ that inflation is on sustainable path back to 2% by mid-year, which means rate cuts could begin as early as July. But this is by no means a lock. There is no shortage of risks to the inflation outlook, most of them skewed to the upside. Case in point: inflation data has already turned meaningfully higher through the first three months of this year. While we won’t have the March reading on core PCE until April 26th, last month’s CPI numbers suggests that core PCE remained hot, with the three-month annualized rate of change likely jumping to an eleven-month high of 4.0%. It’s still too early to know if the recent uptick has staying power, but one thing is for certain. Recent readings on inflation have done nothing to instill further confidence that it remains on a sustainable path back to 2%.
Scenario 1: Economic Resilience Stalls Progress
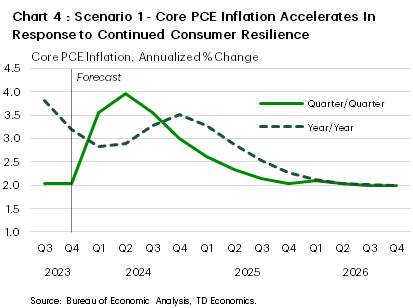
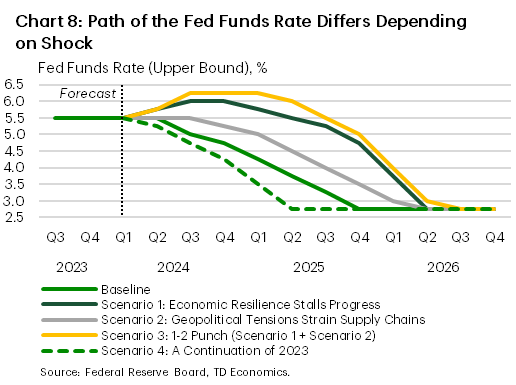
The obvious risk to our baseline outlook is that the slowdown in consumer spending doesn’t materialize. The labor market holds up better than expected, income growth remains elevated and consumer spending continues to run in the 2.5%-3% range over the coming quarters. No further declines in goods prices are assumed, while price pressures for non-housing services – which accounts for roughly 50% of core PCE inflation – remain on the hotter side through the remainder of this year. Monthly gains on core PCE average 0.3% m/m in 2024, which is nearly double that seen through the second half of 2023. As a result, the year-on-year measure steadily rises through the second half of the year – undoing much of the progress made through H2-2023 (Chart 4). The Federal Reserve is forced to raise the policy rate by an additional 50 basis points (bps) by the end of the third quarter – taking the upper bound to 6%. By early-2025, excess labor demand has been absorbed, leading to some cooling in job growth. Consumer spending slows closer to a trend pace (~2%), allowing inflationary pressures on the service side to ease. The Fed begins cutting rates in Q1-2025, but initially maintains a cautious approach, only cutting at every other meeting through the third quarter. Rate cuts come more rapidly in 2026 as policymakers gain greater confidence in the inflation outlook. It assumed that the fed funds rate returns to its neutral rate of 2.75% by Q2-2026.
Scenario 2: Geopolitical Tensions Strain Supply Chains
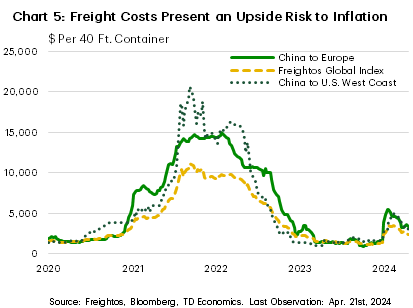
In response to the attacks on ships in the Red Sea, vessels have been diverting away from the Suez Canal and around the Cape of Good Hope, adding 10 to 14 days to transit times from East Asia to Western Europe. This has helped lift global freight rates by over 130% since early-October, with the impacts especially felt on the China to Europe route (+290%). For American consumers and businesses, the cost of moving containers from China to the U.S. has risen by a ‘more modest’ 120%. Although the increase in costs has been steep, the magnitude of the shock is still much smaller than that from the peak of the pandemic when prices rose nearly seven-fold (Chart 5).
The impact of the most recent uptick in prices will depend on how readily additional costs can be passed on by firms to consumers. Our baseline forecast assumes tensions ease over the coming months allowing shipping costs to normalize and thus having a negligible impact on goods prices. However, in this scenario, it is assumed that container prices remain elevated at today’s levels through the remainder of the year.
An econometric simulation using container prices, import prices from China and core goods prices suggests that absent any offsets, the shock could raise core goods prices by anywhere from 1.0-1.6 percentage points by year-end. However, this simulation forms an unlikely tail risk due to the ongoing offset we are seeing from the deflationary pressure from China. U.S. import prices from China are down 3.1% y/y as the country contends with excess capacity. Given the soft demand outlook in advanced economies and reticence by Chinese authorities to adopt aggressive stimulus measures, this trend is likely to offer some offset from rising transportation costs.
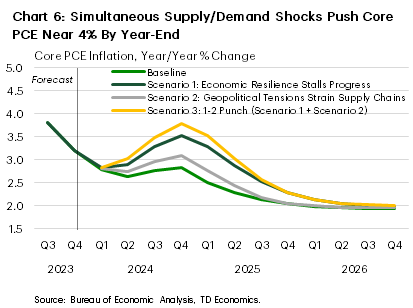
As a result, the impact to core goods prices stemming from ongoing geopolitical tensions would likely be at the lower end of the range mentioned above (i.e., 1.0 percentage point increase to core goods prices). On a Q4/Q4 basis, core PCE rises an additional 0.4 percentage point by the end of 2024. The shock is assumed to dissipate through H1-2025, and inflation gradually converges back to the baseline by H2-2025 (Chart 6).
In the grand scheme of things, the hit to core inflation is relatively small. However, it would be enough to delay the timing of the first rate cut from July until sometime in the fourth quarter. The Fed would likely remain cautious into early-2025, skipping every other meeting through the first quarter. After that point, it is assumed the Fed cuts the policy rate by 25 bps at every remaining meeting in 2025 and would have the policy rate back to neutral by Q2-2026.
Scenario 3: 1-2 Punch of Scenario 1 + Scenario 2
Scenario 3 is the ‘perfect storm’, where a resilient consumer and further strains on supply chains simultaneously materialize, pushing inflationary pressures meaningful higher. The year-ago change on core PCE steadily rises through 2024, nearly reaching 4% by year-end. The Fed responds by raising the policy rate three more times this year, taking the upper bound of the fed funds rate to 6.25% by the third quarter. By early-2025, inflationary pressures related to supply-side factors have eased while demand driven inflation is also showing some early signs of cooling. However, past flare-ups keep the Fed more cautious. Rate cuts don’t begin until Q2-2025 and initially only come every other meeting. By Q1-2026, inflation is showing definitive signs of converging back to 2%, resulting in a more rapid pace of rate cuts. The policy rate returns to neutral 2.75% by Q3-2026.
Scenario 4: A Continuation of 2023
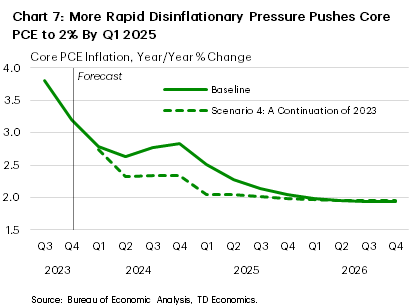
Unlike the first three, the fourth scenario assumes inflation comes in expectedly low relative to the baseline forecast. Healthy gains in productivity and stronger immigration are assumed to temporarily lift the U.S.’s potential growth rate while simultaneously driving a faster rebalancing in the labor market. Economic growth evolves broadly as expected under the baseline forecast, but a higher rate of potential growth leads to stronger disinflationary pressures over the coming year. The uptick in inflation through the first three months of the year proves temporary and monthly gains on core PCE slow to 0.17% m/m – the average monthly gain in H2-2023 – through the remainder of the year. However, unlike in 2023, most of the disinflationary pressure this year is assumed to be the result of a more rapid cooling in core service prices. The 12-month change on core PCE inflation steadily drifts lower through the remainder of the year and reaches 2% by Q1-2025.
Despite the inflation data coming in better than expected, the Fed holds off with cutting rates until July. With monthly readings on inflation continuing to come in on the soft side, the Fed continues to cut rates by 25 bps at each of its remaining four meetings this year. With all signs pointing to core PCE inflation returning to the Fed’s 2% target by early-2025, rate cuts begin coming in 50 bps increments, and the policy rate returns to neutral by Q2-2025.
Conclusion
The Federal Reserve has made incredible progress on bringing down inflation in recent years. At 2.8%, the twelve-month change on core PCE inflation is just half of its post-pandemic high. However, economists have long said that the last lag lower will be the hardest, and recent readings on inflation have already shown that that is being borne out in the data. Our long-standing view has been that the Fed would begin dialing back the policy rate as early as July, but with inflation proving less cooperative and the economy more resilient, our conviction for a summer rate cut has started to fade. As we highlight in this paper, there are no shortage of lingering demand and/or supply related shocks that could slow the adjustment process on inflation and ultimately force a further recalibration on rate cut expectations. Moreover, with Fed officials only seeing three more inflation reports before the July announcement, it will realistically only take one more ‘hot’ inflation reading to all but the seal the fate of a July rate cut.
Exhibits
Inflation Scenario Analysis
| Scenario | Variables | 2024 | 2025 | 2026 | |||||||||
| Q1 | Q2 | Q3 | Q4 | Q1 | Q2 | Q3 | Q4 | Q1 | Q2 | Q3 | Q4 | ||
| Baseline | Core PCE (q/q Ann. % Change) | 3.4 | 3.0 | 2.6 | 2.3 | 2.2 | 2.1 | 2.0 | 1.9 | 1.9 | 1.9 | 1.9 | 1.9 |
| Fed Funds Rate, % | 5.50 | 5.50 | 5.25 | 4.75 | 4.25 | 3.75 | 3.25 | 2.75 | 2.75 | 2.75 | 2.75 | 2.75 | |
| Scenario 1: Economic Resilience Stalls Progress | Core PCE (q/q Ann. % Change) | 3.6 | 4.0 | 3.6 | 3.0 | 2.6 | 2.3 | 2.1 | 2.0 | 2.0 | 2.0 | 2.0 | 2.0 |
| Fed Funds Rate, % | 5.50 | 5.75 | 6.00 | 6.00 | 5.75 | 5.50 | 5.25 | 4.75 | 3.75 | 2.75 | 2.75 | 2.75 | |
| Scenario 2: Geopolitical Tensions Strain Supply Chains | Core PCE (q/q Ann. % Change) | 3.5 | 3.4 | 3.0 | 2.5 | 2.2 | 2.1 | 2.0 | 2.0 | 2.0 | 2.0 | 2.0 | 2.0 |
| Fed Funds Rate, % | 5.50 | 5.50 | 5.50 | 5.25 | 5.00 | 4.50 | 4.00 | 3.50 | 3.00 | 2.75 | 2.75 | 2.75 | |
| Scenario 3: 1-2 Punch | Core PCE (q/q Ann. % Change) | 3.6 | 4.4 | 3.9 | 3.2 | 2.6 | 2.3 | 2.1 | 2.1 | 2.0 | 2.0 | 2.0 | 2.0 |
| Fed Funds Rate, % | 5.50 | 5.75 | 6.25 | 6.25 | 6.25 | 6.00 | 5.50 | 5.00 | 4.00 | 3.00 | 2.75 | 2.75 | |
| Scenario 4: A Continuation of 2023 | Core PCE (q/q Ann. % Change) | 3.3 | 2.0 | 2.1 | 2.1 | 2.0 | 2.0 | 2.0 | 2.0 | 2.0 | 2.0 | 2.0 | 2.0 |
| Fed Funds Rate, % | 5.50 | 5.50 | 5.00 | 4.50 | 3.50 | 2.75 | 2.75 | 2.75 | 2.75 | 2.75 | 2.75 | 2.75 | |
Disclaimer
This report is provided by TD Economics. It is for informational and educational purposes only as of the date of writing, and may not be appropriate for other purposes. The views and opinions expressed may change at any time based on market or other conditions and may not come to pass. This material is not intended to be relied upon as investment advice or recommendations, does not constitute a solicitation to buy or sell securities and should not be considered specific legal, investment or tax advice. The report does not provide material information about the business and affairs of TD Bank Group and the members of TD Economics are not spokespersons for TD Bank Group with respect to its business and affairs. The information contained in this report has been drawn from sources believed to be reliable, but is not guaranteed to be accurate or complete. This report contains economic analysis and views, including about future economic and financial markets performance. These are based on certain assumptions and other factors, and are subject to inherent risks and uncertainties. The actual outcome may be materially different. The Toronto-Dominion Bank and its affiliates and related entities that comprise the TD Bank Group are not liable for any errors or omissions in the information, analysis or views contained in this report, or for any loss or damage suffered.
Download
Share: