U.S. Housing: What’s Next?
Admir Kolaj, Economist | 416-944-6318
- Category:
- Us
- Real Estate
Highlights
- The U.S. housing market is exhibiting some early signs of stabilization, with sales activity nearing a bottom on a trend basis and price growth having more recently turned higher.
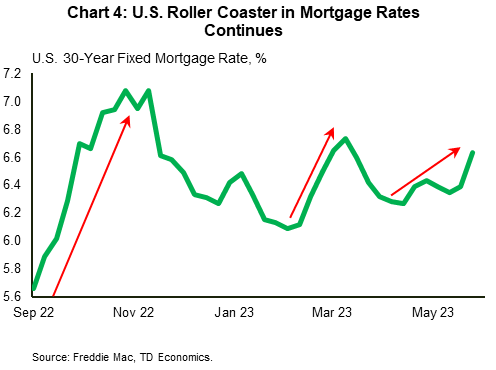
- With housing affordability remaining historically tight, changes in mortgage rates have been a key factor underpinning sales activity. The roller coaster in mortgage rates continues. The sharp upswing of the last few weeks, which has taken the 30-year mortgage rate north of 7%, is likely to be reflected in slower sales activity toward early summer.
- Existing home inventories remain near multidecade lows, in part because homeowners are reluctant to take on a new mortgage that comes with a financing rate that’s over 300 basis points above the average effective rate of existing mortgages. Supply conditions are a lot looser in the ‘new’ home segment. As such, this smaller corner of the housing market has been able to grab a slightly bigger share of overall sales.
- While mortgage rates are expected to drift lower over the coming year, there is some uncertainty over the medium term with respect to the economic outlook. Banks have been tightening credit standards alongside rising interest rates – an adjustment that has been accelerated in the wake of the recent banking turmoil. Though the labor market continues to exude sings of strength, we expect hiring conditions to cool through the second half of this year, resulting in some upward pressure on the unemployment rate through early-2025.
- If the labor market backdrop unfolds broadly as expected, home prices are likely to turn lower starting later this year, and could fall by as much as 5-7% from peak.
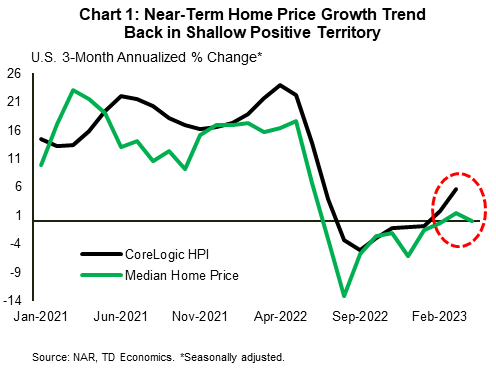
After more than a year of bad news, the tide in U.S. housing is turning, with the market exhibiting some signs of stabilization. Existing home sales appear to have bottomed, at least on a trend basis. Home prices, having given up only a small portion of their lofty pandemic gains, are back on the rise, helped by a dearth of inventory (Chart 1). Activity in the new home market, meanwhile, has been faring even better, with new home sales trending up since the end of last year. All these developments beg the question “has the storm in U.S. housing passed?”.
With sales activity starting from such a low base, there’s certainly room for a further bounce in activity over the near-term. However, the fundamentals underpinning the housing market are not reassuring, with homebuying conditions likely to remain challenging for some time. Banks have been tightening credit standards at a fast clip, an element that will restrict access to credit. Meanwhile, labor market conditions are expected to deteriorate later this year – a cycle that will be marked by rising unemployment and weakened perceptions around job security. These factors suggest that while the initial adjustment from the sharp increase in interest rates may have run its course, we don’t see much scope for a meaningful housing market recovery until late next year.
The only game in town (for now): Mortgage Rates
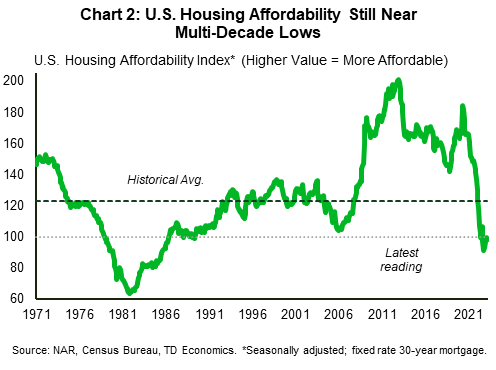
While the median U.S. home price is down 1.7% year-on-year, valuations are still up around 34% from pre-pandemic levels. In comparison, median family income (not adjusted for inflation) is up an estimated 11% over this period. Combined with a mortgage rate averaging 6.5% over the last several weeks – the highest level since the early-to-mid 2000s – it is no wonder that housing affordability remains near record lows (Chart 2).
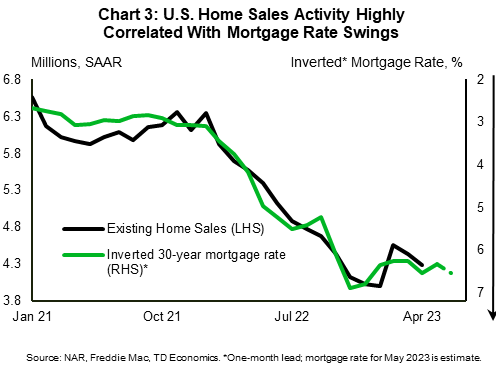
When housing affordability is stretched so tight, changes in mortgage rates can either make or break a purchase. This increased sensitivity to mortgage rates is being reflected in sales activity with a typical lag. Recent data indicates that buyers waiting on the sidelines for improved conditions have tended to make a move after mortgage rates fall. As Treasury bond yields declined from their autumn peak amid economic uncertainty, the 30-year mortgage rate pulled back by around 1 percentage point (pp) between early November and February, culminating in a double-digit sales rebound in February. That month, however, mortgage rates rebounded, rising from a little over 6% to 6.7% by mid-March, contributing to sales declines in March and April (Chart 3). The hit to confidence from the regional banking crisis is also likely to have played a role in holding back activity over the last few months.
The recent volatility in mortgage rates and sales has sent mixed signals about the direction of the housing market (Chart 3 and 4). Looking past the volatility, the cautiously optimistic news is that existing home sales appear to have found a bottom on a trend basis and are no longer setting new cyclical lows.
Existing home market: Slim pickings
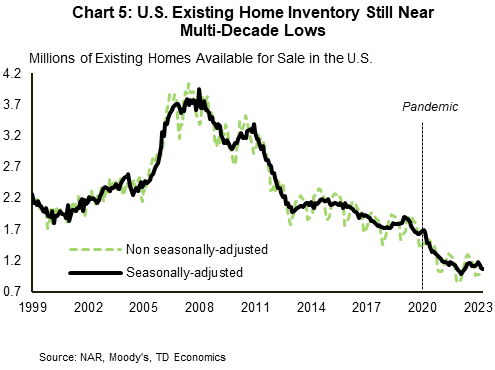
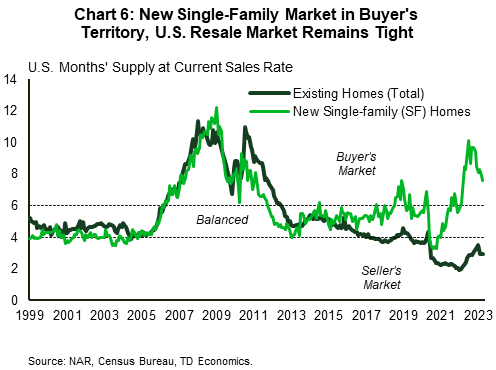
In April, there were 1.04 million existing homes for sale on the market (non-seasonally adjusted), only 10,000 more compared to a year earlier. For a country with around 130 million households, this increase is rather trivial. To drive this point home, consider that in the equivalent month in the year before the pandemic (April 2019), there were an additional 790 thousand more homes on the market, at 1.83 million. Overall, the current level of existing home inventory points to very slim pickings for buyers from a historical perspective (Chart 5 and 6).
Several factors are helping keep existing inventories lean. For one, a strong job market, highlighted by an unemployment rate that’s at multidecade lows (3.4%), has limited any forced-sales behavior. Market data show that while foreclosures came off the floor during the pandemic, they remain low by historical standards.1 Meanwhile, the fact that many homeowners were able to secure low rates during the pandemic – whether by purchasing a home or by refinancing on the way down – is an added factor discouraging many owners from moving.
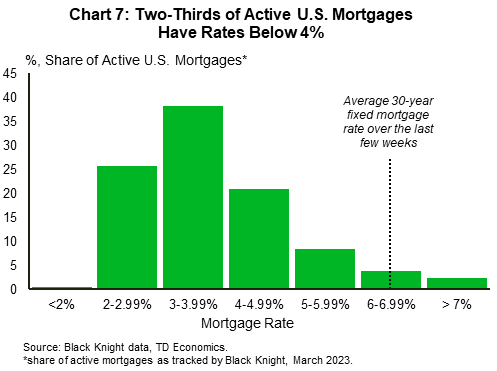
Data compiled by the Bureau of Economic Analysis shows that the effective mortgage rate for owner-occupied housing averaged 3.5% at the start of this year. Complementing this is data from Black Knight, which shows that as of March roughly two-thirds of primary mortgages had an interest rate below 4% (Chart 7). This entails a large gap of around 250 basis points or larger between what most owners are paying on an existing mortgage and the 6.5% prevailing mortgage rate of the last few weeks (daily measures show that 30-year fixed mortgage rates are hovering above 7%). Mortgage porting – the process of transferring an existing mortgage term to a new property – could certainly help keep costs low when moving, but this solution may be hard to come by in practice (i.e., not all lenders allow this; the process generally requires a reapplication etc.).
A median-priced existing home costs around $380,000 today. Simply having to move to a property with the same price would increase the monthly mortgage payment by $470 when going from a 4% to 6.5% mortgage rate (assuming a 20% down payment). Move-up buyers, however, would typically go for a more expensive home. In such cases, the monthly costs would go up disproportionally due to the higher borrowing rate. For example, moving from a home worth $380,000 to one worth $500,000 (32% more expensive), and assuming the buyer can cover the larger 20% down payment, would raise the monthly mortgage payment by around $1,080 (or 74%). To help put these figures into perspective, consider that monthly car payments across the country average a little over $500 and $700 respectively for used and new vehicles. For those with very tight budgets, having to pay a higher mortgage rate when moving, could very well mean having to give up on the car.
Additionally, while staying put may be the most viable solution for many, for those that are forced to move due to a life event (i.e., a new job) but want to retain ownership and their low mortgage rate, renting out the home is another potentially viable option. For the more entrepreneurial types and those whose homes are in prime locations, there’s always the (relatively riskier but potentially more lucrative) short-term rental business.
This theme of the “unwillingness to move” is complemented by other data. For instance, according to a survey from Challenger, Gray & Christmas, the share of job seekers relocating for new jobs fell to 1.6% at the start of this year – the lowest level on record.2 Consider that, in the 1980’s and 90’s, close to a third of job seekers would move for new positions. While there’s certainly more to this trend than mortgage rates, including factors such as remote and hybrid work arrangements, housing costs are also likely to feature heavily into the mix.
New home market: More supply, a bigger share of the pie
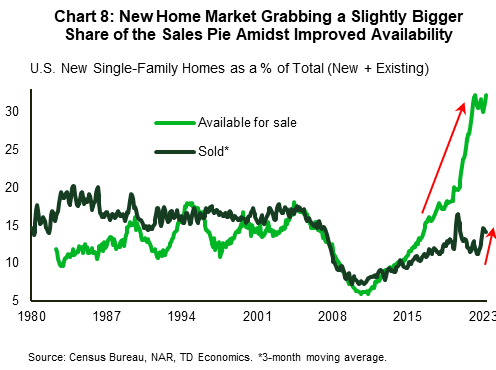
Conditions in the new home market are a lot looser than in the existing home market. New single-family homes account for roughly 30% of total single-family homes currently available for sale – a share that’s substantially higher than at any other point in time with the data stretching back to 1982 (Chart 8). Builders have also been offering plenty of incentives to push inventory along. This includes mortgage rate discounts (i.e., rate buydowns) and price adjustments. The median price for a new single-family home – a volatile series that we smooth over through a three-month moving average – is down 5% in seasonally adjusted terms from its peak toward the end of last year (-8% in non-seasonally adjusted terms), compared to -4% for an existing property. This has meant that the new home market, responsible for roughly 13% of single-family home sales in the pre-pandemic period, has been able to grab a slightly bigger 14.2% share of the sales pie recently. Ultimately, both markets are related, and the loose conditions in the new home market should incentivize some more competitive price behavior in the larger existing home market too.
More grey clouds on the horizon
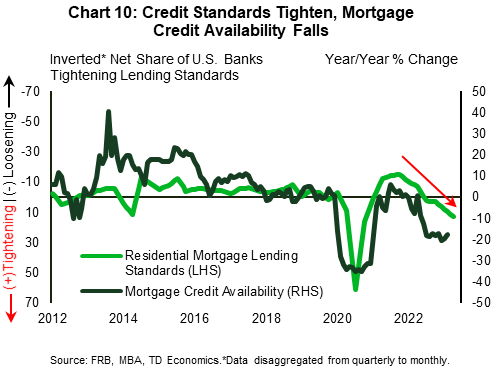
While there’s a chance that the Fed may hike a bit more over the near-term, we believe that the most likely scenario is for policymakers to stay on hold for some time before beginning to cut rates at the start of next year. Based on this view, we expect the 30-year mortgage rate to trend moderately lower, likely ending this year at around 6% and next year at 5%. This downtrend would certainly provide some support from an affordability perspective, but the factors driving interest rates lower merit careful consideration too. On the one hand, the lower rate environment is likely to come alongside a cooldown in inflationary pressures, something that will help boost the purchasing power of earned income. On the other hand, the gradual downshift in rates and inflation will partly come as a result of slower economic and employment growth. In preparation for some tougher times ahead, banks have been tightening residential lending standards (Chart 9). This will weigh further on the availability of credit for residential mortgages, which is already down 18% year-on-year as tracked by the Mortgage Bankers Association’s Mortgage Credit Availability index.
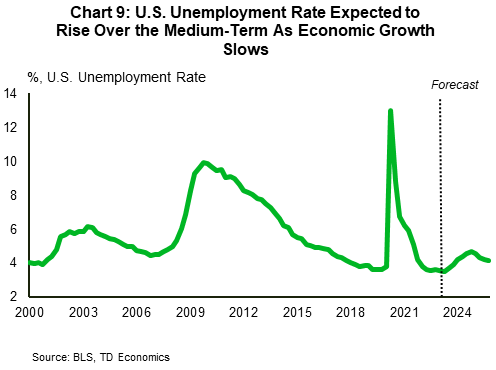
Regarding the labor market deterioration, we anticipate that the U.S. unemployment rate will rise from 3.4% currently to a peak of 4.7% at the start of 2025, with the economy likely to experience losses totaling close to 1.3 million jobs over this period (Chart 10). If these developments unfold broadly as expected, they will not only weigh on the ability of prospective homebuyers to enter the market through direct or indirect means – i.e., respectively through the loss of income and reduced confidence – but should also incentivize some existing homeowners to put their homes on the market. This is in tune with expectations for some improvement in the supply environment ahead.
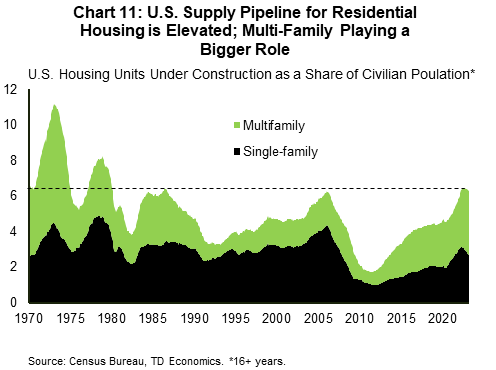
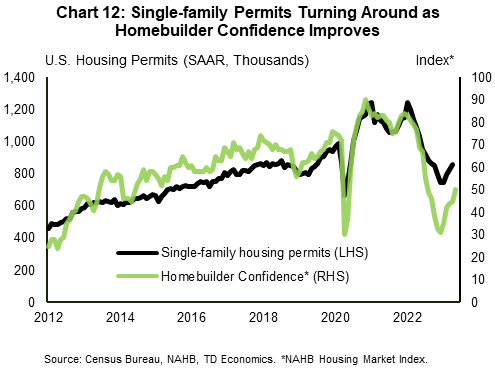
The other side of the supply story has to do with new construction. Benchmarked against population, the number of housing units currently under construction is at the highest level since the 1970s (Chart 11). While this supply will come to market in stages, and it is likely not adequate to address the shortage in housing, the fact that there will be more supply coming to the market is nonetheless a positive development when it comes to buyer choice.3 The expected turn in the economic cycle may cause builders to scale back production as growth slows. However, a recent turnaround in homebuilder confidence amid rising “traffic of prospective homebuyers” and decline in some material costs, such as lumber, suggests that there may be scope for some improvement over the near-term (Chart 12). Overall, given the period of severe underbuilding in the post-GFC period and the current shortage – estimated at between 2 and 7 million units by different sources – homebuilders will likely need to continue playing a bigger role over the medium term.4
All factors considered, we anticipate the improvement in sales toward the pre-pandemic level of around 6 million (total, including existing and new) will be very gradual, likely picking up steam only late next year alongside some pullback in interest rates, and a more favorable supply backdrop. Moreover, part of the expected improvement and return of affordability closer to its long-term average will also have to come from an underperformance in price growth. The positive price growth momentum of recent months has some more room to run, but we anticipate this period will be short-lived, with mild pullbacks in prices likely to resume later this year and into early 2024, before staging a moderate recovery beginning later next year. In essence, once the typically busy spring-buying season ends, we expect the eagerness to purchase homes in a very tight inventory environment to diminish. Slowing rent growth is an added element that should help keep prices in check (see Text Box for more). Overall, our forecast assumes that home prices will be back in retreat beginning later this year, falling a total of 5-7% from peak – a relatively moderate pullback considering the outsized gains during the pandemic – before beginning to trek higher once again in late 2024.
Text Box: Links to commercial real estate (CRE)
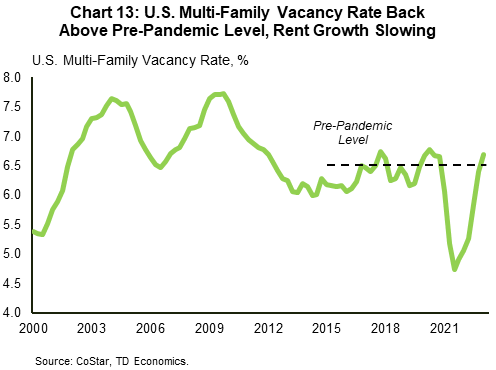
The commercial and residential real estate markets are often treated separately, but it goes without saying that there are important links between the two. The connection between the commercial apartment market and the broader housing market is a two-way street. For instance, low for-sale housing inventories can tilt some demand toward the multifamily rental market. On the other hand, loose conditions in the commercial apartment space can go a long way in easing some of the pressures in the ownership market. This latter scenario is likely to play a more central role in the quarters ahead. The multifamily vacancy rate has been increasing over the last few quarts, rising back up above its pre-pandemic level (Chart 13). This recent trend is expected to continue, given a rich supply pipeline. The bulk of housing units currently under construction – some 57% of the total or 960,000 units – are multifamily units, and the vast majority of these are geared toward the rental market. Close to 98% of multifamily units that started construction in the fourth quarter of 2022 were being built with the intent to be rented out once completed – an all-time high. Having access to wider rental choices will discourage the need for households to overstretch budgets in order to enter the ownership market.
Other commercial real estate sectors are also indirectly related to residential housing, given that with some effort vacant commercial space, such as offices, can be converted into apartment units. As we outline in a recent report, out of the four major CRE sectors, the office market has the weakest fundamentals. Office-to-apartment conversions typically make up only a small fraction of overall apartment supply, so we don’t anticipate them to make a major difference nationally. That said, the sector bears careful watching, as the weaker its conditions, the more likely that some of these properties will be sold at steep discounts and converted into other uses, including rental apartments or condos.
Conclusion
The U.S. housing market is showing some signs of stabilization, with overall sales activity no longer setting new lows and price growth reverting back into shallow positive territory. Very little inventory is available in the existing home market, in part because many homeowners are prone to hang on to the much lower mortgage rates that many were able to secure during the pandemic. Homebuilders are capitalizing on this trend. Looser supply conditions in the new home market, combined with builder incentives, such as mortgage rate buydowns, mean that this smaller corner of the housing market has been grabbing a bigger share of the sales pie.
Given the low starting point in overall sales activity, and homebuyers having adjusted somewhat to higher mortgage rate environment, there’s some further room for improvement over the near-term. That being said, homebuying conditions remain very challenging, as highlighted by housing affordability that’s near multi-decade lows. This discounts the potential for a quick turnaround. Moreover, there’s more gray clouds over the horizon, with an expected deterioration in the labor market starting in the second half of this year likely the next shoe to drop. If the labor market deterioration unfolds broadly as we anticipate, with job gains eventually giving way to job cuts in the quarters ahead, home prices are likely to turn lower starting later this year, and could fall by as much as 5-7% from peak. Meanwhile, a sustained turnaround in housing activity will be kicked further down the road, likely at the end of 2024 when mortgage rates are much lower
End Notes
- ATTOM Q1 2023 U.S. Foreclosure Market Report, see here.
- “Q1 2023 Job Seeker Relocation Falls to Lowest on Record as Remote & Hybrid Work Persists”, report by Challenger, Gray & Christmas, see here.
- The average length of time from start to completion last year was 8.3 months for single-family homes and 17 months for multifamily units – both being at all-time highs.
- Regarding the U.S. housing shortage, see article with estimations from several sources here.
Disclaimer
This report is provided by TD Economics. It is for informational and educational purposes only as of the date of writing, and may not be appropriate for other purposes. The views and opinions expressed may change at any time based on market or other conditions and may not come to pass. This material is not intended to be relied upon as investment advice or recommendations, does not constitute a solicitation to buy or sell securities and should not be considered specific legal, investment or tax advice. The report does not provide material information about the business and affairs of TD Bank Group and the members of TD Economics are not spokespersons for TD Bank Group with respect to its business and affairs. The information contained in this report has been drawn from sources believed to be reliable, but is not guaranteed to be accurate or complete. This report contains economic analysis and views, including about future economic and financial markets performance. These are based on certain assumptions and other factors, and are subject to inherent risks and uncertainties. The actual outcome may be materially different. The Toronto-Dominion Bank and its affiliates and related entities that comprise the TD Bank Group are not liable for any errors or omissions in the information, analysis or views contained in this report, or for any loss or damage suffered.
Download
Share: