Highlights
- U.S. household wealth has grown at a solid pace over the past several years with only a few brief setbacks when the pandemic struck at the start of 2020 and with the start of interest rate hikes in 2022.
- U.S. household wealth rebounded strongly in 2023, growing 8% and hitting a new all-time high in the final quarter of the year, mostly due to gains in equity prices.
- At its peak in early 2022, household wealth stood at 8.3 times household disposable income. It has retreated since but remains above its pre-pandemic peak.
- Household wealth has grown the fastest among households in the bottom 50% of the wealth distribution, predominantly due to rising real estate prices.
- Gains in household wealth should continue to support economic growth this year. With stubborn inflation and buoyant spending, the Federal Reserve is unlikely to cut interest rates until the final quarter of this year.
The U.S. economy slowed to a 1.6% annualized pace in the first quarter of 2024, but underneath the hood, consumer spending remained buoyant, growing 2.5% (annualized). Spending picked up through the quarter with its strongest growth in March, setting up the second quarter for a similarly strong performance.
Consumers have been stalwart in their spending through the highs and lows of the post-pandemic inflationary period, undeterred by the 525 basis point rise in the federal funds rate. This continued strength has presented a challenge for forecasters. Even as the buildup of pandemic-era excess savings has been exhausted for most households (link), broader wealth gains have propped up spending, a trend that is expected to continue over the coming year.1
Household Wealth Rebounded in 2023
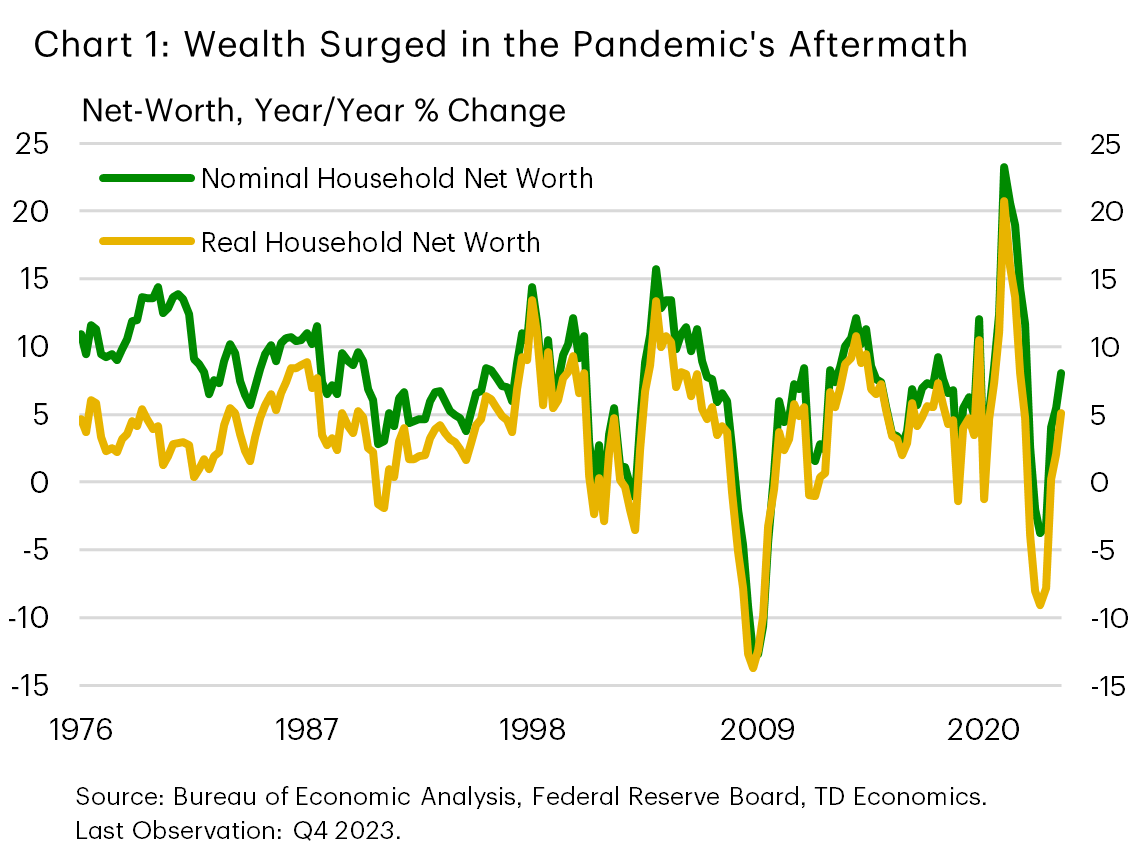
The last several years have been good to U.S. household balance sheets. Households came into the pandemic on a strong footing, having grown their wealth by 12% in 2019. That faltered when the pandemic struck, but after just one quarter of decline, household wealth picked up speed again. In 2020 and 2021, it grew at annual pace of 13.4%.
Household wealth took another step back in 2022 as the Federal Reserve began raising interest rates, but it has since rebounded. In the final quarter of 2023, the level of household wealth reached a new high of $156 trillion. All told, household wealth has risen by 33% (7.5% annually) since the end of 2019.
Accelerated inflation has eaten away some of the wealth gains accumulated since the pandemic, but even adjusting for price changes, household net worth has risen by nearly 15% (3.5% annually) since the end of 2019 (Chart 1)
Wealth Has Grown Much Faster than Income
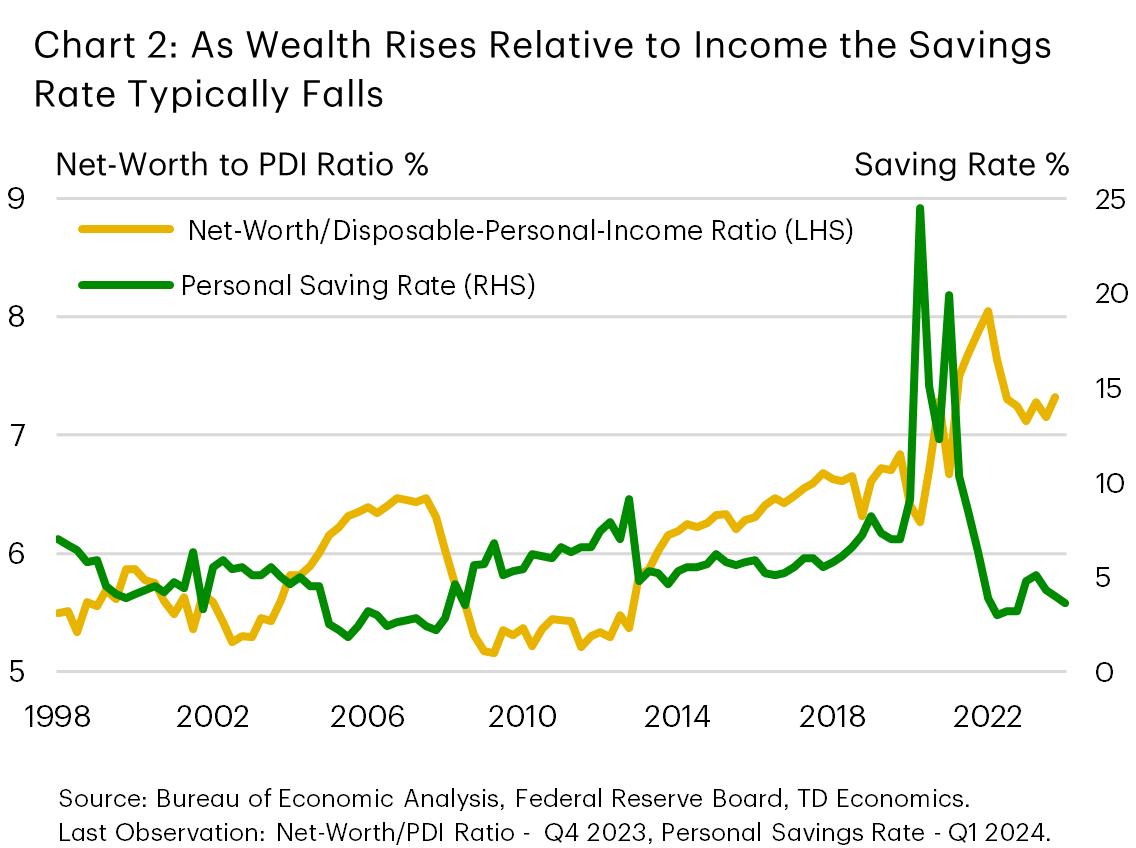
Just as important, net worth has risen faster than disposable household income, continuing a trend observable prior to the pandemic. At its peak in early 2022, household wealth was 8.3 times disposable income. While it has retreated since, in the fourth quarter of 2023 it sat at 7.6 times disposable income, above its pre-pandemic peak of 7.1. A high wealth-income ratio has historically been associated with a lower saving rate as households are better able to draw on wealth in order to support spending (Chart 2).
Excess Saving Explains a Small Part of Rising Household Wealth
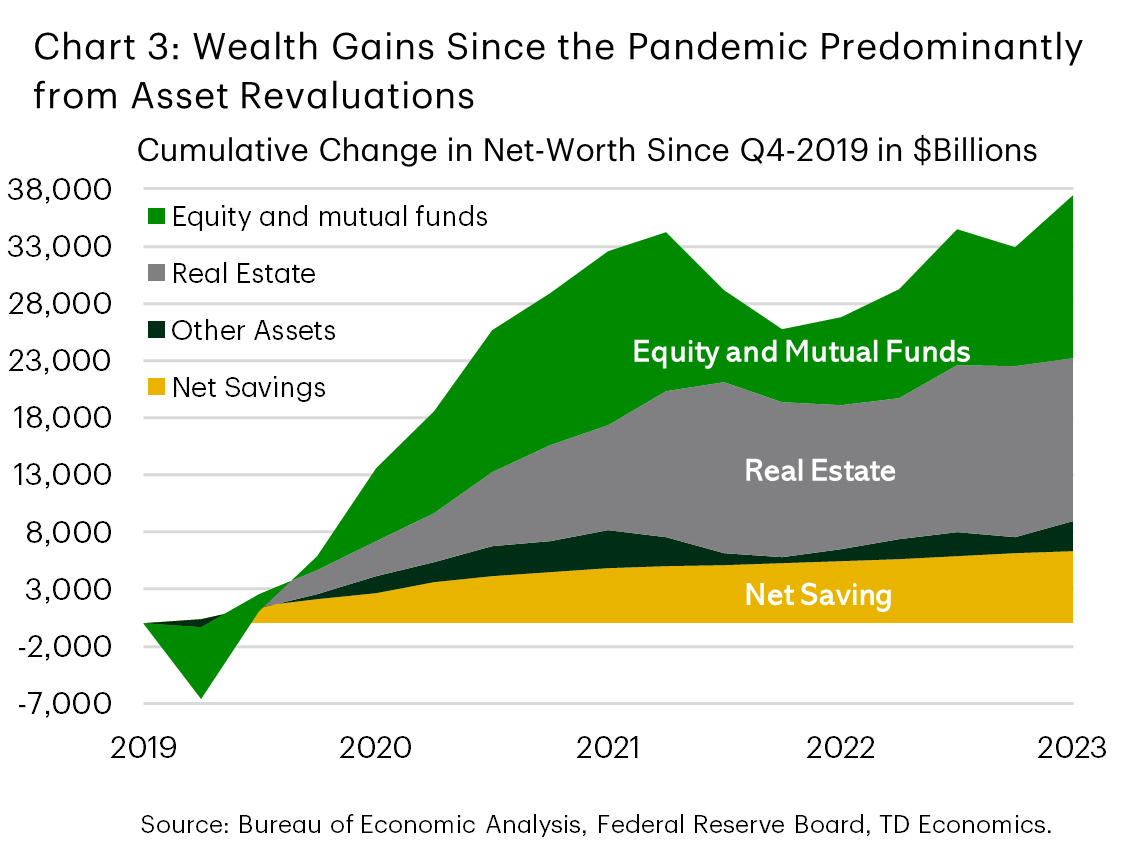
While household saving also rose dramatically through the pandemic, its contribution to rising household wealth is relatively small compared to rising asset prices.2 From the fourth quarter of 2019 to the end of 2023, only 17% of the gains in wealth were due to net savings. Just under 80% of the gains in wealth were due to higher asset prices, with the contribution split evenly between financial and real estate assets (Chart 3). While equity prices have fallen 2.5% over the past month, both equity and housing prices are up year-to-date, suggesting that rising valuations have continued to lift household wealth.
Household Wealth Has Grown Fastest at the Bottom
Another welcome aspect of the increase in household wealth is that it has been relatively widespread. Since the end of 2019, household wealth for the bottom 50% of the wealth distribution has grown the most – up 87%. The second highest increase has been among the very richest households in the top 0.1% who have seen a 47% cumulative gain. The only groups to see lower than average gains in wealth have been those in the top 10% but below the 0.1%, adding 24% in cumulative wealth since the end of 2019 (Chart 4).3
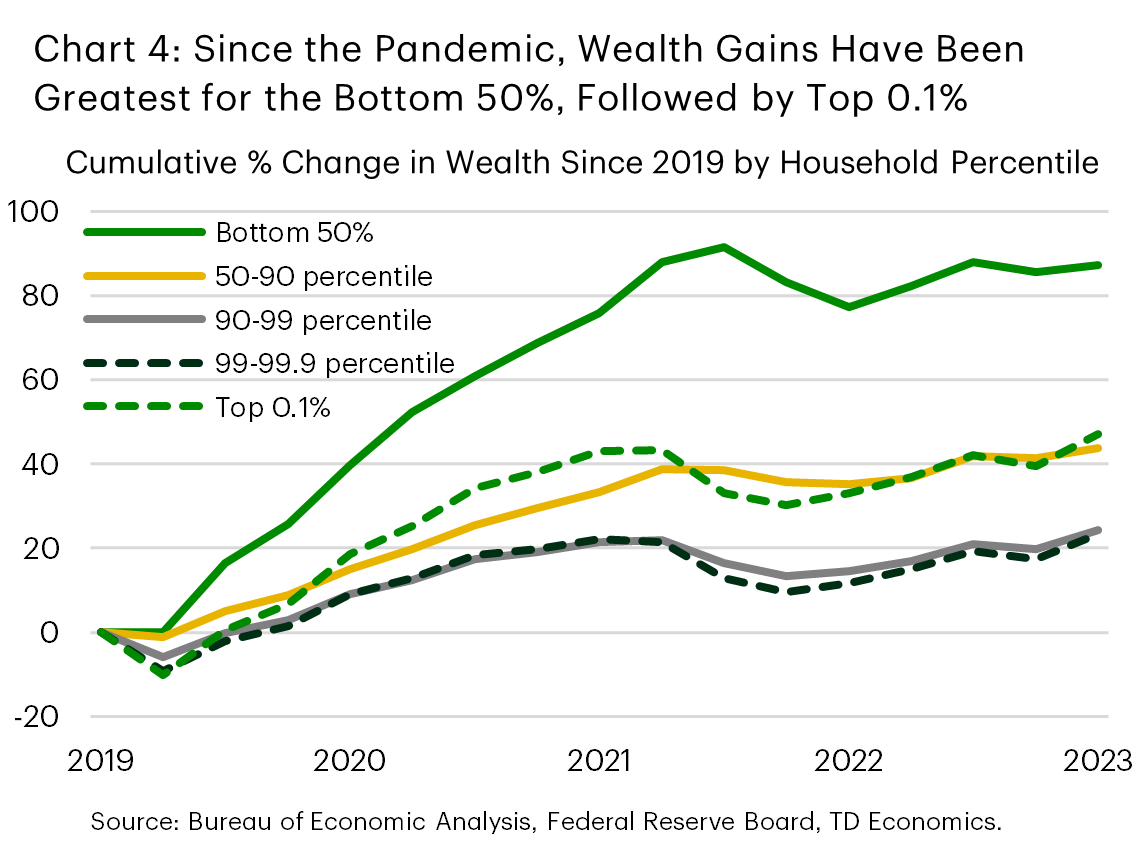
Gains in real estate prices, especially in 2020 and 2021 explain much of the rise in household wealth in the lower part of the wealth distribution. Whereas gains for the top households have been predominantly within financial assets. These households saw greater volatility in their wealth, and larger setbacks in 2022. However, with the rebound in equity prices in 2024, they have also experienced the strongest gains this year.
Wealth Will Continue to Prop Up Spending
Economic studies of the impact of household wealth on spending generally agree that, with a lag, households spend a portion of their newfound wealth. While estimates range, for every dollar increase in wealth, spending rises by between two and five cents.4 The magnitude of the wealth effect likely differs by asset classes, with the increase in spending due to gains in real estate prices generally thought to be higher than for equities. As real estate is more widely held than financial assets and can be more immediately turned into spending by households borrowing against it, increases in real estate equity tend to translate more quickly into spending.
With a range of two to five cents on the dollar, rising wealth explains 15% to 30% of the gains since the pandemic.5 Continued wealth gains over the past year suggest that it will remain supportive of spending over the next one.
Spending Resilience Will Require Fed Vigilance
Over the past two years, the Fed has been relatively successful in cooling inflation. However, ongoing gains in household wealth suggest that policy may have to remain tighter for longer in order to keep a lid on spending. Strong gains in household wealth, suggest that financial conditions overall may not be as tight as envisioned. This is evidenced in other indicators as well, including the strength of the U.S. dollar, and corporate bond spreads, which have generally come in over the course of 2023. The Fed’s recent pivot has helped to take some of the sails out of equity markets over the past month, yet the stock market remains up 8% year-to-date.
Text Box 1: Digitization May Speed Up the Wealth Effect’s Transmission
While there is usually thought to be a lag between increases in household wealth and spending, that lag may be shortening. The increasing use of digital applications has allowed people to see in real time how their portfolios are performing. This may have led to a faster responsiveness of spending to wealth-based news. At the same time, with a higher proportion of the population nearing retirement years rising, sensitivity to changes in net worth may be increasing.
The Bottom Line
The American economy continues to perform well thanks in no small part to the continued resilience of its consumers. The wealth effect from gains in equity and real estate prices has been just as important in explaining this strength as excess saving.
Since the pandemic, gains in household wealth have been relatively wide spread, with the bottom of the distribution seeing the largest increases. More recently, however, equity prices have led the way and gains have been more concentrated among the wealthiest households. This may have implications for the types of spending over the next year, with sectors that cater to the high-end consumers (like financial services and travel) doing better than others.
At the same time, high asset valuations pose a challenge for monetary policy, requiring it to remain higher for longer in order to ensure that inflation continues to move toward the central bank’s 2% target.
End Notes
- Household wealth or net worth is the difference between total assets and total liabilities. Assets can be separated into financial assets (like stocks) and nonfinancial assets (like real-estate and vehicles). Liabilities are primarily composed of residential mortgages and consumer credit.
- The aggregate includes households and nonprofit institutions.
- According to Fed’s Distributional Financial Accounts, the minimum wealth cutoff for the top 0.1% is $46 million, $11 million for remaining top 1%, $2 million for top 10% but below the top 1%, $240 thousand for top 50% to 90%.
- For example, a recent paper published in the American Economic Review found that a one dollar increase in stock market wealth increases annual consumption expenditure by about 3.2 cents two years after the shock. https://www.aeaweb.org/articles?id=10.1257/aer.20200208
- Allowing for lags in the response of spending to gains in household wealth.
Disclaimer
This report is provided by TD Economics. It is for informational and educational purposes only as of the date of writing, and may not be appropriate for other purposes. The views and opinions expressed may change at any time based on market or other conditions and may not come to pass. This material is not intended to be relied upon as investment advice or recommendations, does not constitute a solicitation to buy or sell securities and should not be considered specific legal, investment or tax advice. The report does not provide material information about the business and affairs of TD Bank Group and the members of TD Economics are not spokespersons for TD Bank Group with respect to its business and affairs. The information contained in this report has been drawn from sources believed to be reliable, but is not guaranteed to be accurate or complete. This report contains economic analysis and views, including about future economic and financial markets performance. These are based on certain assumptions and other factors, and are subject to inherent risks and uncertainties. The actual outcome may be materially different. The Toronto-Dominion Bank and its affiliates and related entities that comprise the TD Bank Group are not liable for any errors or omissions in the information, analysis or views contained in this report, or for any loss or damage suffered.
Download
Share: