Highlights
- The new administration in the White House has brought a cloud of uncertainty, but if there’s one factor that would help U.S. consumers sleep better at night, it’s their wealth. Even after the recent selloff in financial markets, hefty prior financial gains mean that households are still left with a sizeable wealth cushion.
- Subdued debt growth last year has also contributed to healthy household balance sheets. High interest rates and tighter lending standards held back growth in mortgages and auto loans. Credit card balance growth has also been slowing.
- Credit card and auto loan delinquency rates have shown nascent signs of improvement but remain well above their pre-pandemic peak.
- Homeowners, particularly those who bought before the pandemic, have accumulated a lot of home equity. Once mortgage rates decline, this could lead to a wave of debt consolidation via mortgage refinancing which in turn could provide a significant lift to consumer spending.
- While the significance of home equity has increased, so did households’ exposure to financial markets, with equities and mutual funds currently accounting for a record share of total wealth.
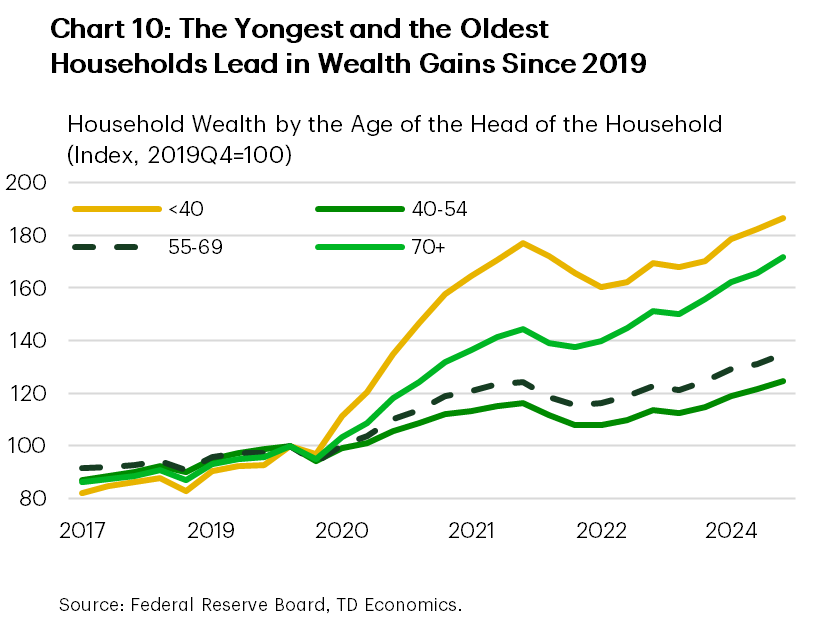
- Looking at the wealth through a generational lens, the youngest and the oldest households have seen the largest wealth gains in the last 5-years.
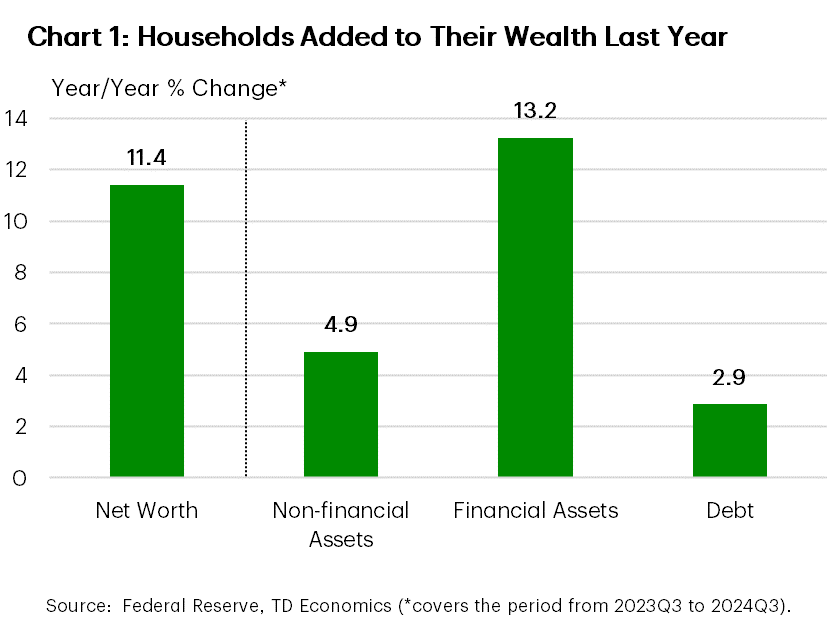
The new administration in the White House has brought a cloud of uncertainty, but if there’s one factor that would help U.S. households sleep better at night and spend more confidently, it’s their wealth cushion. Policy uncertainty has led to a correction in equity markets recently, with the S&P 500 erasing all its gains since the fall. However, the recent decline should still leave households with a sizeable wealth cushion. As of the third quarter last year, U.S. households’ net worth was up by 11.4% from a year ago, bringing the overall increase over the past five years to about 47% (Chart 1).
The majority of the wealth gain last year came from the rise in the value of financial assets, which rose 13.2% year-on-year, fueled by strong returns in the equity markets. Equities and mutual funds rallied by 30% and 23%, respectively last, contributing nearly three-quarters of last year’s increase in household wealth.
Non-financial assets (mainly real estate) also added to the overall increase, but the gain in real estate wealth was relatively modest due to high mortgage rates continuing to weigh on home price appreciation. Still, homeowners ended last year in a better position than they were at the start, with median home prices up nearly 5% from a year ago.
Modest Debt Growth Bolsters Wealth Gains
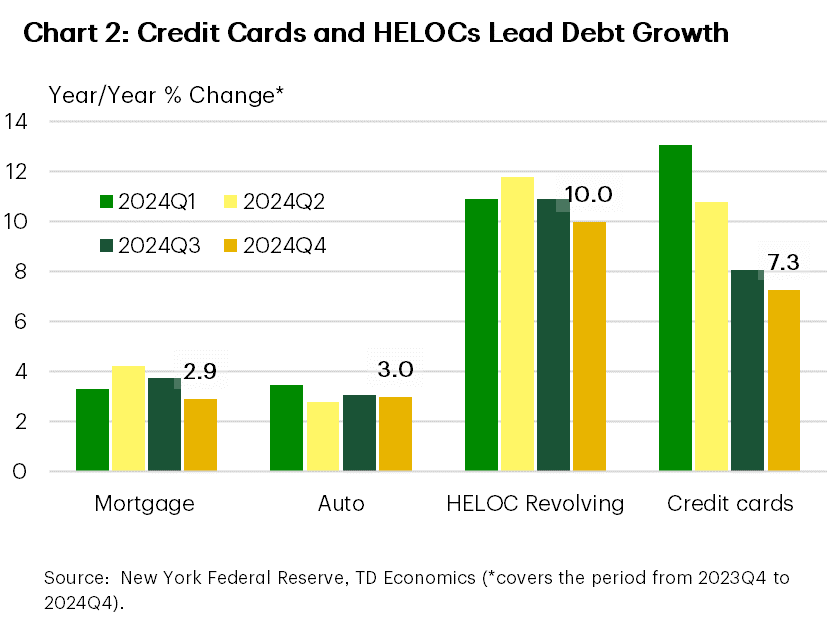
Assets represent only one side of household balance sheets, and any discussion of household wealth is incomplete without addressing trends in household debt. While asset valuations grew briskly last year, household debt growth remained relatively muted, rising by just under 3%. The main reason for that is that mortgage debt growth – which accounts for over 60% of total debt – remained relatively soft, with high mortgage rates weighing on housing demand. The same applies to auto loans, where a combination of high interest rates and tighter lending standards also hindered loan growth. This helped to keep overall debt growth contained, even as revolving debt balances, such as credit card debt and home equity lines of credit, continued to expand rapidly (Chart 2).
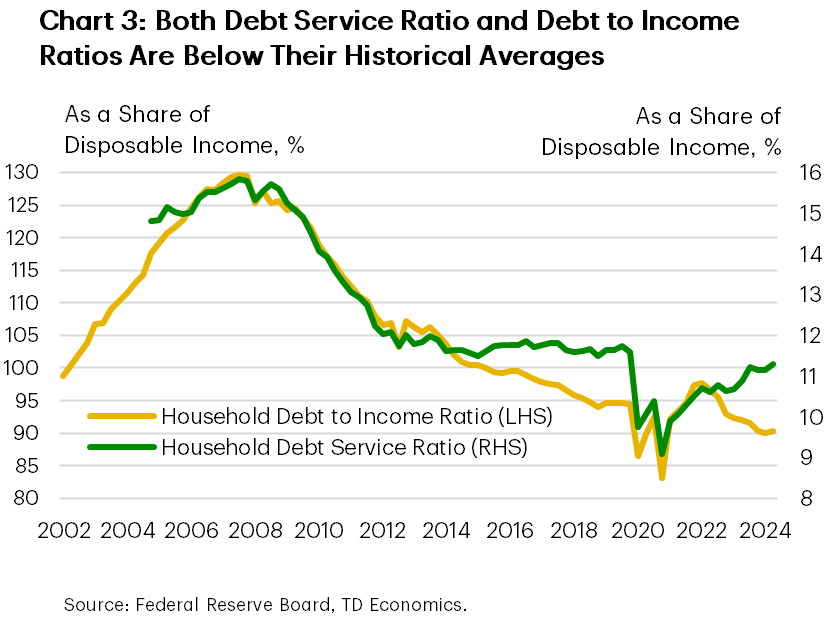
The aggregate household debt burden appears manageable. After paying down balances during the pandemic, households initially ramped up borrowing once restrictions were lifted and interest rates were still low. However, once borrowing costs started rising, debt growth moderated. As a result, the ratio of debt to disposable income has since normalized and is currently slightly below pre-pandemic level. Debt servicing costs also appear manageable when viewed relative to disposable income (Chart 3). The debt service ratio has been increasing alongside higher interest rates, but it remains just slightly below where it was prior to the pandemic.
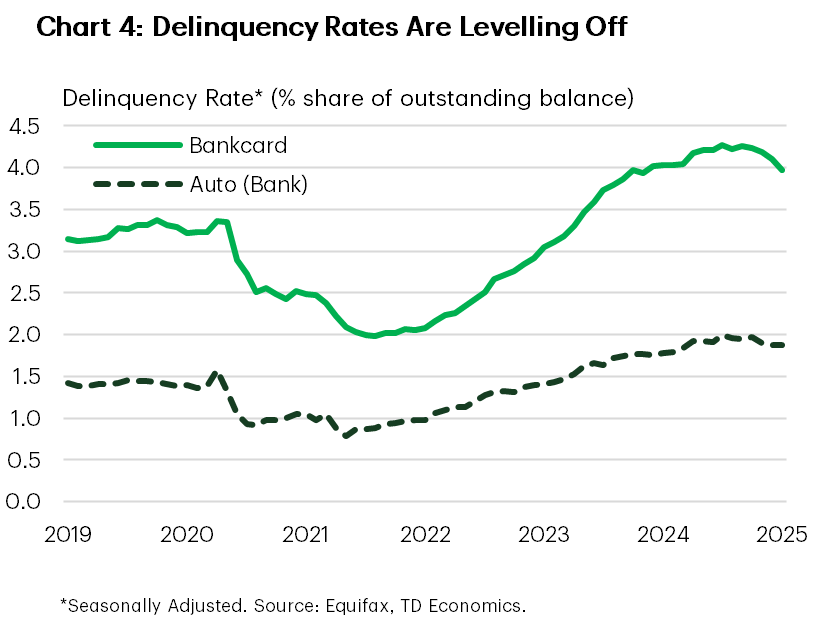
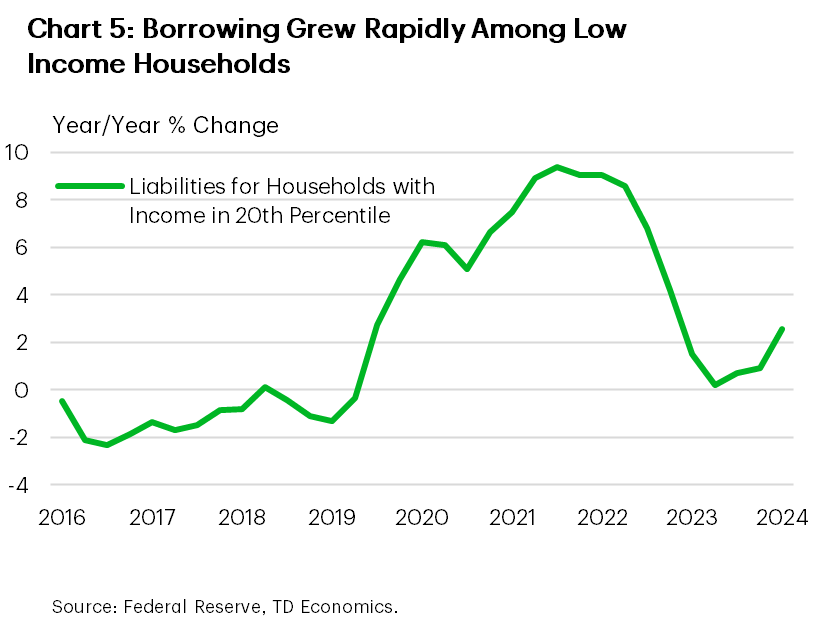
While debt servicing costs look manageable in aggregate, cracks have emerged. Delinquency rates on credit cards and auto loans have risen well above pre-pandemic levels (Chart 4). A combination of high inflation, elevated car prices (both for new and used vehicles), and high interest rates on these types of credit has likely contributed to the deterioration in credit quality, with lower income households being hit hard. Debt balances for households at the lower end of the income distribution grew rapidly both during the pandemic and afterward – a stark reversal of the trend seen in the years prior when their debt balances were generally declining (Chart 5). Equifax data also supports this, showing that back in 2023 credit card balances grew the fastest among the subprime and near-prime customers. Additionally, credit score inflation during the pandemic could have obscured the actual creditworthiness of borrowers. Fortunately, the most recent data shows early signs of stabilization in auto loan delinquencies and a modest decline in credit card delinquencies, suggesting that the worst may be behind us (Chart 4).
Substantial Real Estate Wealth Locked Up by High Borrowing Costs
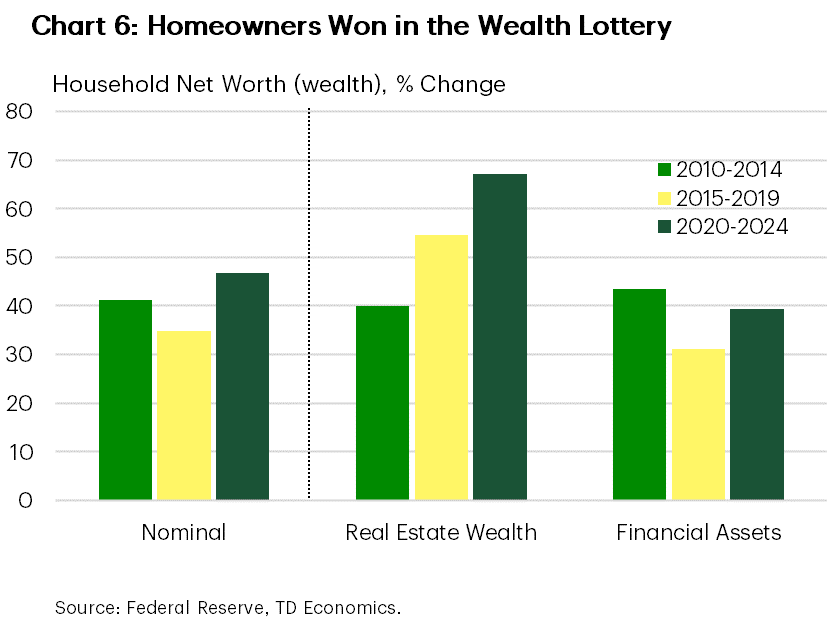
Real estate wealth has surged by a remarkable 77% since before the pandemic, largely driven by a surge in home prices during 2020-2021 (Chart 6). In addition to the rapid rise in home prices, lower interest rates at the start of the pandemic allowed homeowners to refinance, reducing monthly mortgage payments and freeing up more money to save (and spend). As a result, homeowners have accumulated $35 trillion in home equity. For context, this is nearly double the size of consumer spending for 2024.
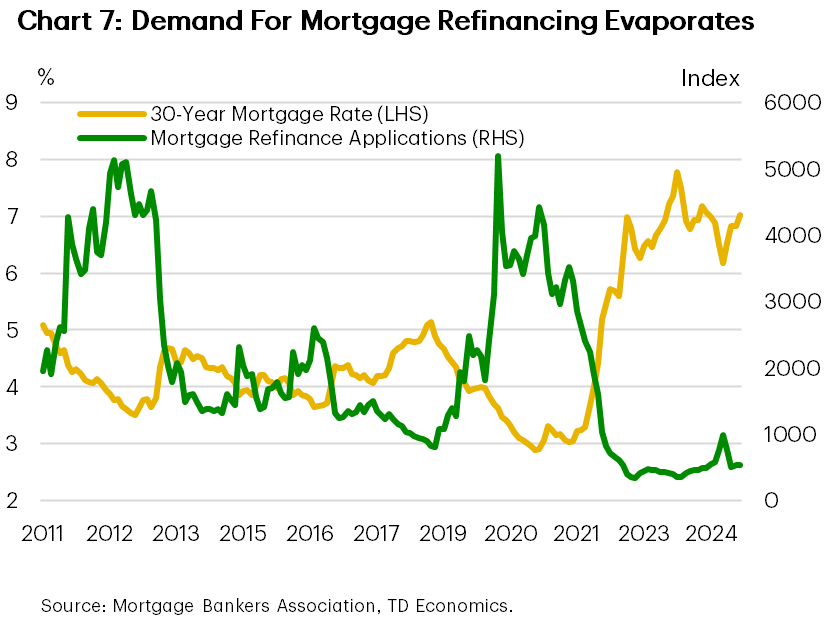
While high levels of home equity are good news for homeowners and financial stability, much of this wealth remains inaccessible due to the prevailing high mortgage rate environment. Home equity can be tapped to support spending, particularly for large expenses like renovations, or used to pay down non-mortgage debt or invest in other assets. However, today’s mortgage rates are 4 percentage points higher than their pandemic lows, making it very unappealing for homeowners to refinance their mortgage or sell their homes. As a result, the cash-out refinancing market—once the preferred method for extracting home equity during 2019-early 2022—has largely dried up (Chart 7).
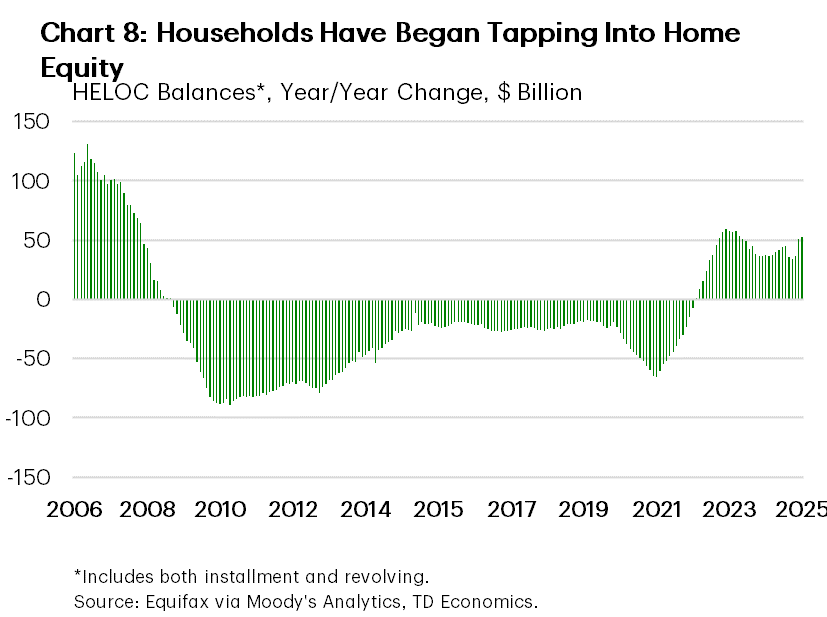
With mortgage refinancing remaining unattractive, home equity lines of credit (HELOCs) and home equity loans are the primary way homeowners can tap into their housing wealth. Data indicates that consumers have been increasingly tapping into these products. Combined balances for HELOCs and home equity loans rose 34% since mid-2022, reaching $147 billion, reversing more than a decade of declines (Chart 8).
HELOCs, however, have limitations compared to cash-out refinancing. They are typically available only to borrowers with high credit scores and those who are older, having accumulated substantial home equity. And the interest rates tend to be higher than those on mortgage rates. When mortgage rates eventually decline, it could provide a meaningful boost to consumer spending and debt consolidation.
Households’ Exposure to Financial Markets Has Increased
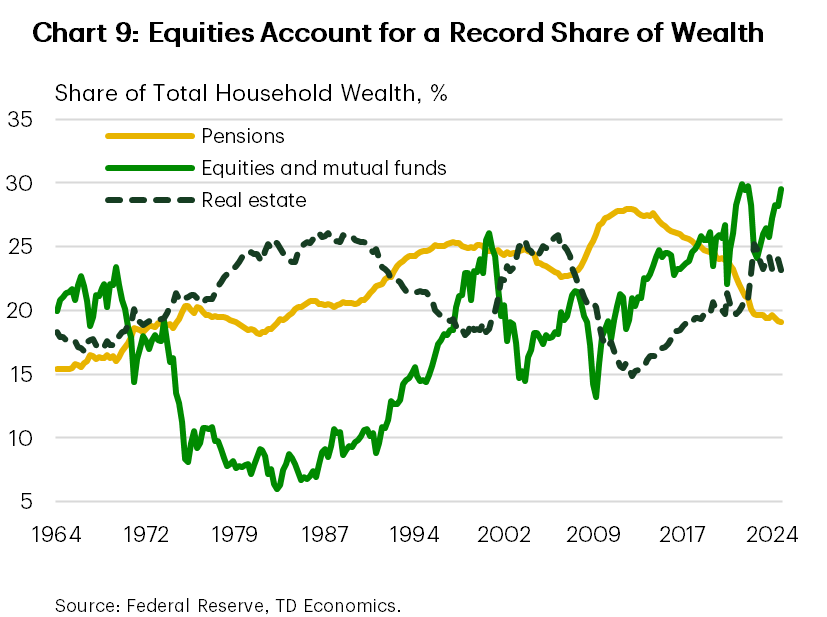
While home equity has become a more significant part of households’ wealth portfolios, exposure to financial markets has also increased. As the prevalence of pensions has declined, households hold more equities and mutual funds directly, and they now account for a record share of household net worth —around 30%—making them the most widely held asset class, surpassing pensions and home equity (Chart 9). The rise in exposure to equities has been nearly uniform across income quintiles. As a result, households are more vulnerable to stock market fluctuations, which could lead to a sharper pullback in consumer spending if financial market performance weakens significantly. Past research has shown that stock market gains are associated with higher credit card spending, particularly for large-ticket items.1 Therefore, a decline in the stock market is expected to lead to the opposite outcome. However, other research shows that the households’ propensity to consume out of financial wealth is much lower than that of housing wealth.2
Young Households Led the Recent Wealth Gains, But Many Left with FOMO
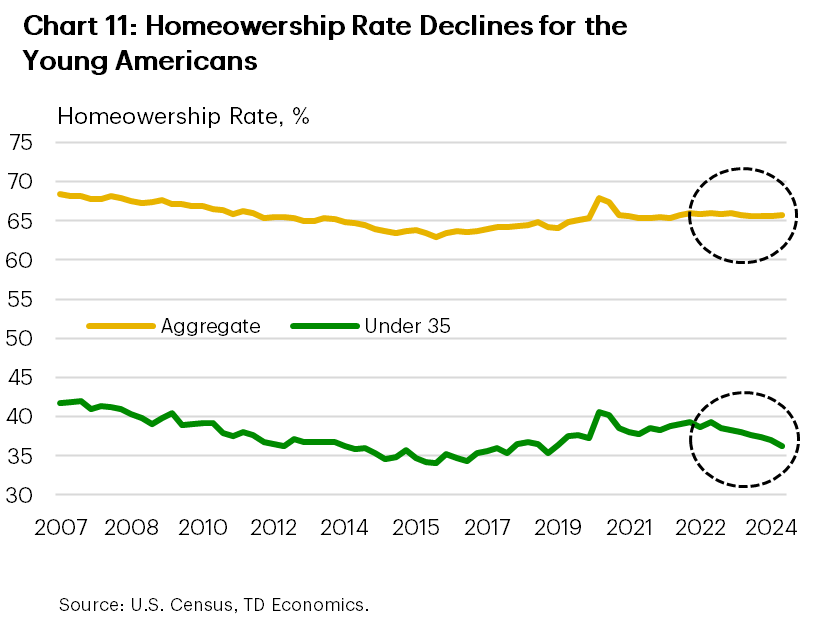
Digging a little deeper into wealth gains across age groups, the acceleration in per-household net worth has been most pronounced among the youngest and oldest households, advancing by 87% and 72%, respectively (Chart 10). The net worth of the average household in the youngest age group is now 132k higher than it was 5 years ago (Table 1). The post-pandemic improvement in the balance sheets of younger households is particularly noteworthy, as this age group was hardest hit by housing wealth destruction during the 2008-09 subprime crisis. From this perspective, today’s households under 40 are in much better financial shape than their counterparts ten to fifteen years ago. They are well-positioned to leverage their home equity once mortgage rates decline, or to use their more liquid financial assets to supplement income and spending in the meantime. The flip side of these wealth gains is stretched affordability in the housing market that is increasingly shutting out many younger households (Chart 11). Homeownership is often a key pathway for wealth accumulation, and lower rates of homeownership mean that real estate wealth gains are less widespread.
Table 1: Average Wealth per Household ($)
| 2019 | 2024 | |
| <40 | 147,921 | 280,385 |
| 40-54 | 802,409 | 1,006,245 |
| 55-69 | 1,467,464 | 2,034,511 |
| 70+ | 1,195,541 | 1,925,357 |
Secondly, the bulk of the gain in household wealth occurred in the first two years of the pandemic. The subsequent decline in home prices and in the stock market as interest rates rose left some households only slightly better than they were when asset valuations were at their peak (Chart 9). Homebuyers, who bought their homes at peak prices may not have accumulated much of home equity over the last couple of years, as home prices are only slightly higher than they were at their peak in 2022.
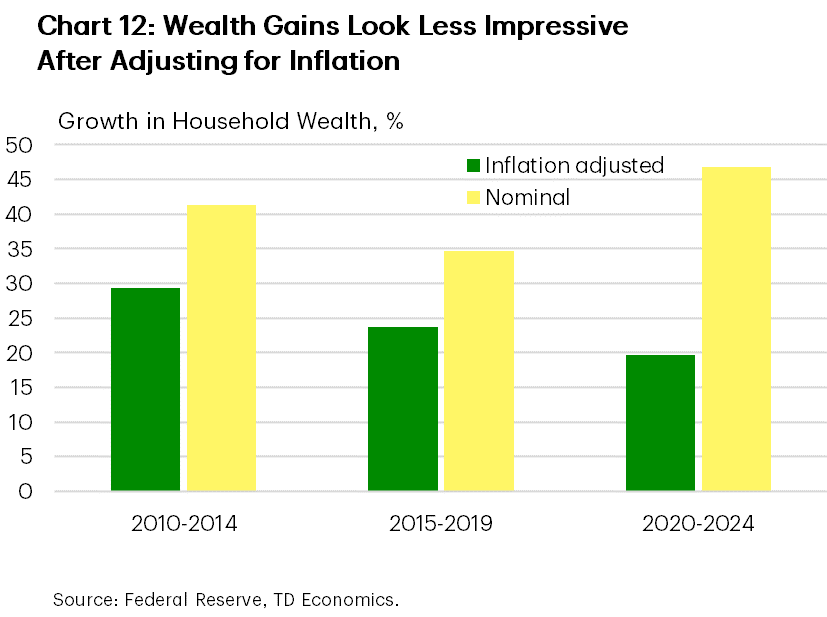
Lastly, high rates of inflation over the last five years have also eroded wealth gains. Whether a dollar is from income or wealth it does not go as far as it used to. Adjusting for inflation, wealth gain over the last five years were much more moderate – just 20% compared to the 47% gain in nominal terms – and in fact trails the gains seen in the prior decade (Chart 12).
Bottom Line
U.S. households entered 2025 with strong balance sheets, which could help buffer them from the economic turbulence caused by policy uncertainty under the new administration. Encouragingly, delinquency rates on credit cards and auto loans have shown early signs of normalization from their recent peaks. This suggests that the strain from high inflation, rapid increases in debt balances, and interest rate hikes is gradually easing.
While healthy balance sheets provide a financial cushion, much of this wealth is currently inaccessible for spending. High mortgage rates are preventing most homeowners from tapping into their real estate wealth through refinancing. A decline in mortgage rates could unlock home equity, boosting consumer spending and offering a path for debt consolidation, particularly for high credit card balances. Notably, the yield on 10-year Treasury notes—which influence mortgage rates—has dropped significantly since the start of the year amid tariff uncertainty. We expect yields to fall further this year as policy risks continue to drive investors toward safer assets, such as Treasuries (forecast).
That being said, the recent selloff in financial markets may temper consumer appetite to borrow and spend – particularly now that equities account for a large share of wealth. Given the unusually large policy uncertainty and the selloff in equities, households may choose to tread carefully until the future looks more certain.
End Notes
- JPMorgan Chase & Co. Institute. Diana Farrell and George Eckerd. “The Stock Market and Household Financial Behavior.” January 2021. https://www.jpmorganchase.com/content/dam/jpmc/jpmorgan-chase-and-co/institute/pdf/institute-stock-market-report.pdf
- IMF Working Papers. Carlos Caceres. “Analyzing the Effects of Financial and Housing Wealth on Consumption using Micro Data”.
Disclaimer
This report is provided by TD Economics. It is for informational and educational purposes only as of the date of writing, and may not be appropriate for other purposes. The views and opinions expressed may change at any time based on market or other conditions and may not come to pass. This material is not intended to be relied upon as investment advice or recommendations, does not constitute a solicitation to buy or sell securities and should not be considered specific legal, investment or tax advice. The report does not provide material information about the business and affairs of TD Bank Group and the members of TD Economics are not spokespersons for TD Bank Group with respect to its business and affairs. The information contained in this report has been drawn from sources believed to be reliable, but is not guaranteed to be accurate or complete. This report contains economic analysis and views, including about future economic and financial markets performance. These are based on certain assumptions and other factors, and are subject to inherent risks and uncertainties. The actual outcome may be materially different. The Toronto-Dominion Bank and its affiliates and related entities that comprise the TD Bank Group are not liable for any errors or omissions in the information, analysis or views contained in this report, or for any loss or damage suffered.
Download
Share: