U.S. Goods Imports:
New Friends and Familiar Faces
Andrew Hencic, Senior Economist | 416-944-5307
Date Published: December 5, 2023
- Category:
- Us
- Trade
- Commodities & Industry
Highlights
- China’s role as a U.S. supplier of goods peaked in 2017 and has been gradually shrinking since.
- Mexico has re-emerged as the U.S.’ top source of imports, gaining market share in manufactured products and oil and gas imports. In the manufacturing sector, large gains in transportation goods, electrical equipment, and machinery have been the main drivers of the uptick.
- Canada, for its part, has also expanded its role, though primarily due to a growing share of energy imports.
- Apart from North American trade partners, Vietnam and other Southeast Asian economies have scooped up market share, predominantly gaining ground in the manufacturing sector.
- However, for all the incremental gains countries have made, none have been able to replace China’s large role in the U.S. supply chain. Moreover, the diversification in trade partners doesn’t necessarily suggest reduced linkages with, or exposure to, China.
Before the pandemic, trade tensions flared with the U.S. implementing new tariffs on a raft of goods from China and other trade partners, kicking off a more confrontational posture towards trade. This trend accelerated as the pandemic and war in Ukraine severely disrupted global supply chains. Looking at the data, a reduction in direct trade with China has become evident, being supplanted by new relationships, and a deepening of existing linkages.
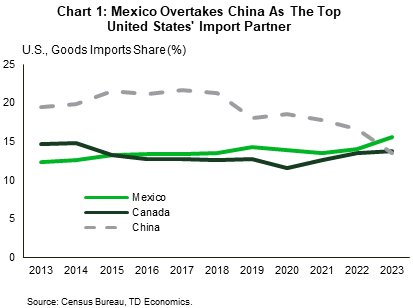
China’s role as a U.S. supplier of goods peaked in 2017, when it accounted for 21% of all U.S. goods imports. Its share since then has sharply receded. In its stead, historic partners (Canada and Mexico) have slowly reestablished themselves in the value chain and smaller trade relationships (Vietnam and Taiwan) have flourished. In fact, China’s pullback and Mexico’s rise have also vaulted Mexico back into pole position as the United States’ largest source of goods in 2023 (Chart 1).
Taking a closer look at the shifts that have happened offers some interesting insights into who is stepping into the void. The share of imports coming from China has fallen by 8 percentage points since 2017 (Chart 2). Among the U.S.’ major trade partners Vietnam, Mexico, and Taiwan have all increased their share of U.S. imports by at least one percentage point. Additionally, the shift away from China doesn’t simply reflect falling relative prices of Chinese goods, or a shift in preferences by U.S. consumers for products produced by other countries, but rather a broad-based reduction in trade reliance.
Across virtually all categories of goods, China’s import share has contracted (Chart 3). The pullback has been mostly in manufactured goods where the reduction in import share has been six percentage points. Of the manufacturing sub-sectors, furniture and leather products has pulled back most sharply, losing more than 20 percentage points in share. Interestingly, a common thread emerges when looking at the categories where the biggest shifts have occurred.


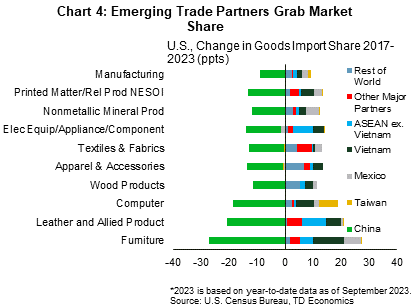
Examining the ten categories where China’s role has pulled back the most, Vietnam emerges as the major gainer (Chart 4) scooping up market share across all categories. In fact, Association of Southeast Asian Nations (ASEAN)1 member states more broadly, have stepped up to fill much of the void across most product categories. Conversely, Taiwan, although growing its slice of the U.S. imports pie overall, is primarily the beneficiary of a large chunk of computer goods imports.
The two other members of the North American free trade area, Canada and Mexico, have made their gains in the manufacturing and energy sectors. Mexico manufacturing products have scooped up an additional 1.8 percentage points (ppts) of U.S. imports, compared to Canada’s more modest addition of 0.1 ppts. Drilling down into the categories behind the biggest shifts (Chart 5), Mexico’s lift was powered by a large gain in Transportation products, while Canada’s gains in Primary Metals (+0.3 ppts) and Food (+0.3 ppts) products have been offset by shrinking market share in Transportation (-0.7 ppts).

For Canada, most of the gains have come from the rising role of its oil and gas products in U.S. imports - roughly 0.8 ppts of the total 0.9 ppts gain. Oil and gas imports from Canada accounted for just over 41% of all oil and gas imports in 2017 but have since risen to 58% of the total – as of September 2023. For its part, Mexico’s share of oil and gas imports has risen from 7% to 11% over the same period.
Yet, for all the incremental gains, no single trade partner has thus far been able to replace China’s role in the U.S. supply chain. Mexico, Vietnam and other ASEAN member states are growing rapidly, but still have a long way to go to come close to matching China’s importance.
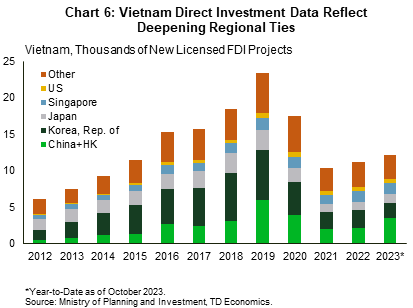
Moreover, it is not entirely clear that the shifts in trade volumes are truly indicating reduced trade linkages between the U.S. and China. For instance, Vietnam makes foreign direct investment (FDI) project license data publicly available (Chart 6). The data show that while the Republic of Korea was the primary counterparty receiving licenses for FDI projects in the years prior to the pandemic (accounting for over a third of all projects in 2018), China and Hong Kong have supplanted it as of 2023. This raises the notion that although direct trade between the U.S. and China may have pulled back, even imports originating from third countries are in some way linked back to China’s supply chains.
In fact, while the share of China’s exports heading to the U.S. shrank from 2017 to 2023, it has been increasingly delivering products to ASEAN states and countries outside of the G-7 (Chart 7). This regional integration was also identified by recent research from the Bank for International Settlements (BIS)2 that used firm level data to show that regional trade relationships, continue to develop.
So, while the U.S. has been diversifying its trade relationships (particularly towards Southeast Asia), so too has China. This suggests that the separation between the two major economies may not have grown as much as trade data suggest. In fact, the same BIS research3 showed that while the number of intermediaries in the U.S.-China supply chain has grown between 2021 and 2023, the linkages between the two countries have not broken down.

Bottom Line
The U.S. is diversifying its base of import partners. This process comes with new opportunities and challenges. Vietnam and Mexico have thus far been clear winners, scooping up market share, and should stand to benefit as they develop economies of scope and scale in the coming years.
However, the diversification in trade partners doesn’t necessarily suggest reduced linkages with, or exposure to, China. In fact, recent research using firm level data suggests that some of the shifting supply chains are attributable to an increase in intermediation, rather than truly diversifying trade. More data and research are needed to understand how potential pinch points in supply chains are evolving.
End Notes
- Member States: Brunei Darussalam, Cambodia, Indonesia, Lao PDR, Malaysia, Myanmar, Philippines, Singapore, Thailand, Vietnam
- Qiu H., H.S. Shin, L.S.Y. Zhang (Oct. 3, 2023) “Mapping the Realignment of Global Value Chains” BIS Bulletin, No. 78.
- Qiu H., H.S. Shin, L.S.Y. Zhang (Oct. 3, 2023) “Mapping the Realignment of Global Value Chains” BIS Bulletin, No. 78.
Disclaimer
This report is provided by TD Economics. It is for informational and educational purposes only as of the date of writing, and may not be appropriate for other purposes. The views and opinions expressed may change at any time based on market or other conditions and may not come to pass. This material is not intended to be relied upon as investment advice or recommendations, does not constitute a solicitation to buy or sell securities and should not be considered specific legal, investment or tax advice. The report does not provide material information about the business and affairs of TD Bank Group and the members of TD Economics are not spokespersons for TD Bank Group with respect to its business and affairs. The information contained in this report has been drawn from sources believed to be reliable, but is not guaranteed to be accurate or complete. This report contains economic analysis and views, including about future economic and financial markets performance. These are based on certain assumptions and other factors, and are subject to inherent risks and uncertainties. The actual outcome may be materially different. The Toronto-Dominion Bank and its affiliates and related entities that comprise the TD Bank Group are not liable for any errors or omissions in the information, analysis or views contained in this report, or for any loss or damage suffered.
Download
Share: