U.S. – Five Pandemic Trends and Where They Stand Today
Admir Kolaj, Economist | 416-944-6318
Date Published: December 7, 2022
- Category:
- US
- Government Finance and Policy
- Labor
- Real Estate
- Consumer
Highlights
- Nearly three years after Covid-19 disrupted the U.S. economy, some shifts are looking more permanent, while others have normalized. This report provides an update on where five key trends that emerged early in the pandemic stand today.
- The share of remote work and online shopping have both abated from their pandemic highs but remain above pre-pandemic levels, especially remote work.
- Some pandemic migration patterns also appear to be abating, with metros that recorded large population outflows during the health crisis now seeing fewer outflows. Meanwhile, several metros at the receiving end (i.e., recording in-migration) have seen their inflows slow.
- Supply bottlenecks have eased but there may be more potholes on the way given the presence of external risk factors.
- Non-defense government spending has cooled and is more in line with pre-pandemic trends. Rising debt servicing costs and a more divided Congress may limit the support that government spending can provide as the economy shifts into lower gear ahead.
1. Remote Work: Down from Peak but Still Very Popular
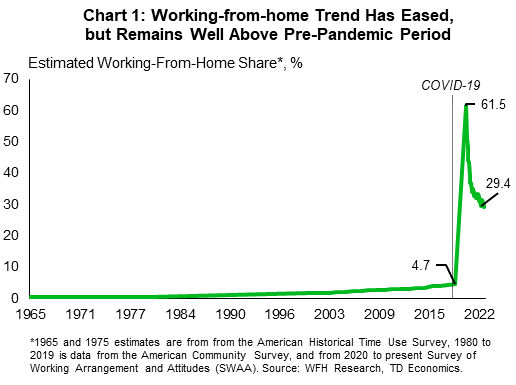
Americans have been returning to the office at an increased frequency thanks to having easy access to effective vaccines and a dissipating risk of severe outcomes from COVID-19 infection. In this ‘comeback’ though, companies and employees have been favoring a hybrid approach, which allows workers to split time between in-person and remote work. One source estimates that the share of paid days worked from home has fallen by half compared to the pandemic peak, but at 30% this is still significantly higher relative to the pre-pandemic period (Chart 1). Remote work remains particularly popular among those that typically work in an office, but surveys reveal a much wider trend, with remote work also popular among those working in plenty of other settings such as retail and entertainment, and hospital or other healthcare facilities.1
The prevalence of remote work is echoed in depressed office occupancy levels, which still average below 50% of the pre-pandemic levels in ten large metros across the country.2 The commercial real estate office sector continues to suffer as a result, with its vacancy rate trekking higher recently and hovering at 12.5%. This is not far off from the near-13% peak experienced during the Great Recession. The trend is here to stay a while, with surveys showing that employer plans for remote work post-COVID have stabilized at 2.3-to-2.4 days per week recently.3 This means that fortunes for the commercial office sector are unlikely to turn around anytime soon.
2. E-commerce: Easing in Online Orders
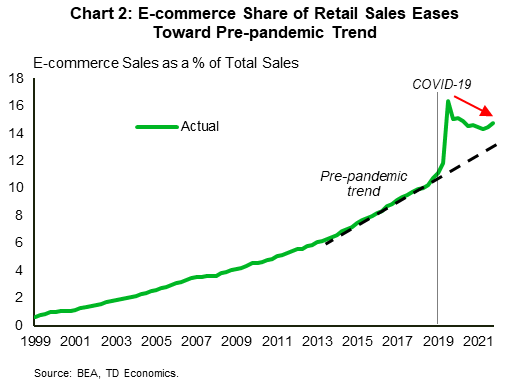
When the pandemic struck and lockdowns where widespread, consumers were forced to do more of their shopping online. But, as restrictions faded over time, consumers eased off their cellphones and laptops and returned to purchasing more goods in person. In this vein, the share of shopping done online abated, easing from a record high 16.4% in the second quarter of 2020 to an average of 14.5% over the past year (Chart 2). This is above where it would have been had it followed pre-pandemic trend.
Data at the sectoral level reveal additional insight. For sectors that had very high online penetration rates before the health crisis, the pandemic gains in the share of e-commerce have proven rather fleeting. Case in point, the share of online spending in electronics & appliances stores and non-store retailers has pulled back noticeably since their pandemic peak, leaving these shares little changed relative to the pre-pandemic period. This is because, there are limits to how high e-commerce penetration rates can go. As we’ve pointed out in prior research, consumers will always be inclined to purchase some goods in person given for example the need to satisfy immediate necessities, impulse shopping, and need to feel/try out certain products. On the other hand, some sectors that had low online penetration rates to begin with (i.e., food and beverage, building material stores) are doing a better job at holding on to the additional e-commerce activity generated during the pandemic. Despite the recent pause, online shopping is still expected to grow its share of the sales pie over the long-term. Much of the growth is likely to continue to come from these low hanging fruits, meaning the sectors with low online penetration rates.
3. Pandemic Migration Patterns Abate, Housing Boom Reverses Course
Americans moved to the suburbs in droves during the pandemic, providing an added bump to the long-standing suburbanization trend. The latter was helped along by the shift to remote work and the fact that homebuyers had access to some of the lowest mortgage rates on record, but it was not the only trend to stand out regarding migration patterns. Indeed, warm southern metro areas were also a hot destination for those crossing state lines. The resulting population influx helped supercharge the housing markets for those at the receiving end. However, with the fading of the pandemic and the sharp rise in interest rates this year, these trends have turned course.
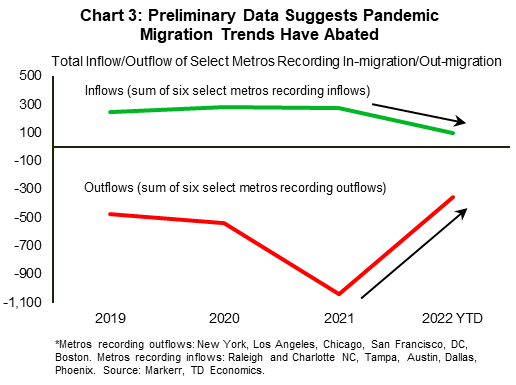
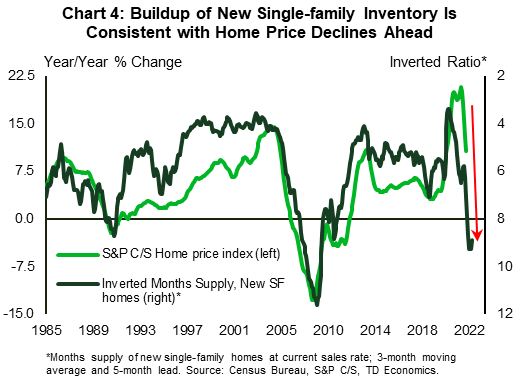
While annual population data is released with a lag, early indicators are in tune with a fading of the migration patterns described above. Estimates suggest that several major cities that saw increased out-migration during the pandemic (i.e., New York, Los Angeles, Chicago, San Francisco etc.) have recorded fewer outflows so far into 2022 (Chart 3).4 On the other hand, several cities that were popular migration destinations during the pandemic (i.e., Raleigh and Charlotte, NC, Dallas, Austin, Phoenix etc.) have seen their still-positive population inflows abate significantly. These trends are likely related to the partial comeback of in-person work, which could be swaying workers to stick near large coastal metropolitan areas. But changes in interest rates and the housing market are also likely at play. The sharp appreciation in home prices during the pandemic for markets on the receiving end helped narrow the price difference of the latter vis-à-vis generally more expensive coastal markets. And with interest rates rising sharply this year, the incentive to move has likely subsided further. Prospective buyers now face mortgage rates more than double from year-ago levels. Given the latter, perhaps the most noticeable reversal in activity has occurred in the housing market itself. Home sales are down sharply since the start of the year, and prices have begun to pull back too. Leading on the way down in prices are several markets that recorded a sharp deterioration in affordability during the pandemic, such as those in the state of Washington and Idaho (-6% recent-peak-to-October when using CoreLogic home price index), California (-5%), along with Nevada and Arizona (-4%). Speaking of the downward price trend, we believe that U.S. home prices have further to fall (Chart 4). For more on our housing market outlook, see here.
4. Supply Chain Bottlenecks Have Eased, But Risks Persist
Another major hallmark of the pandemic has been the deep disruption caused to supply chains – a feature that has contributed to the hot inflation numbers of the past year. One way to tease out where we stand with supply chain disruptions is to look at the ISM supplier deliveries indexes, where values above 50 indicate slower deliveries and below 50 faster deliveries. Looking at chart 5, we can see that supply-side pressures have generally eased in both sectors compared to the highs experienced during the pandemic, although more so in manufacturing.
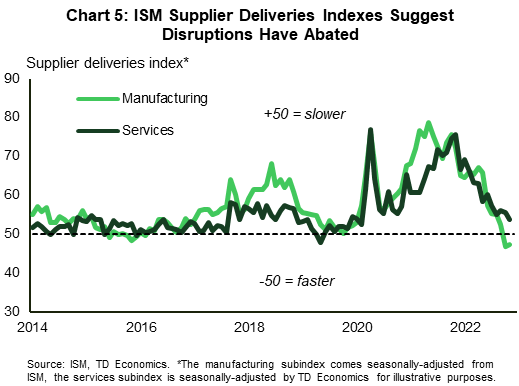
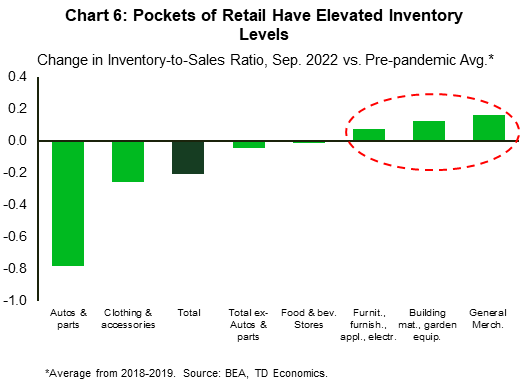
Improved supply chain conditions in manufacturing are in tune with cleared port congestion off the Coast of California – a trend that has been partially aided by shifting activity to East Coast ports – and the buildup of inventory in pockets of retail (Chart 6). This narrative is echoed by other indicators too, such as the RSM Supply Chain Index, which has returned to normal (pre-pandemic) levels.5 The improvement on this front is a welcome development that aligns with reduced ‘goods’ price pressures. While companies have had some success and are working to further diversify their supply chains, these efforts take time to materialize, and the road ahead may not be without potholes. Focusing on the near-term, the fact that China – the biggest source of goods imports to the U.S. – is still following a Zero-COVID policy at a time when new infections have soared, still bears some risk. Meanwhile, here at home, a potentially very disruptive freight rail strike has been averted, with President Biden recently signing legislation to impose a labor agreement between rail companies and workers.
5. Government Spending: Turning Off Financial Taps
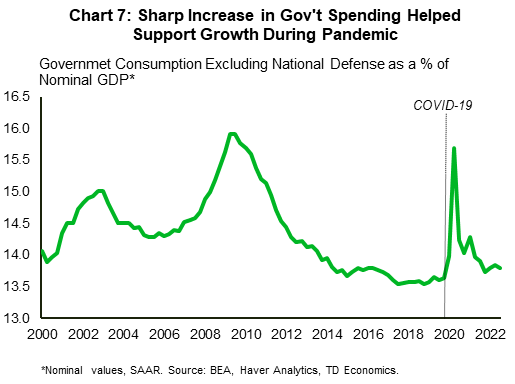
Soon after the pandemic struck, governments turned on the financial taps to aid businesses that were forced to close their doors and workers that were laid off. This helped soften the blow of the massive income shock caused by the health crisis. The rise in U.S. government spending was marked by sharp increases in social benefit payments and government subsidies, among other things. With the pandemic fading, these supports have eased, and government spending has fallen to more typical levels in relation to output (Chart 7). In this vein, government spending is providing less support to economic growth than it did at the height of the pandemic.
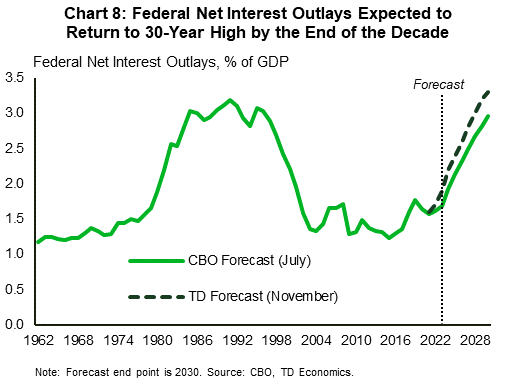
We expect economic growth to slow further in the year ahead. Should the U.S. economy enter a pronounced downturn, fiscal policy supports would likely need to spring back into action, as is typical of these periods. However, in such a scenario, the level of support would likely be much more limited than what we observed during the pandemic. There are several reasons for this, key among them – rising borrowing costs and a more divided Congress. The sharp increase in interest rates means that governments need to devote more funds to service their debt, which may lead to fiscal restraint. In this vein, federal interest payments are expected to make up a growing share of GDP in the years ahead, with the CBO forecasting a doubling in this share by the end of the decade (Chart 8; for more detail on this see here). Focusing on the medium-term, with Republicans taking control of the House recently, the chances of achieving congressional agreement on major fiscal policy issues is reduced. In fact, the impending debate in Congress on the debt limit could pose significant downside risk if an agreement cannot be punctually reached. While a 2011 style impasse, which resulted in the first and only U.S. credit rating downgrade, is unlikely, prolonged negotiations could still raise uncertainty, which would be an added concern for a slowing economy in the year ahead.
End Notes
- WFH Research, Oct 2022 survey, https://wfhresearch.com/wp-content/uploads/2022/10/WFHResearch_updates_October2022.pdf
- Kastle Back to Work Barometer, https://www.kastle.com/safety-wellness/getting-america-back-to-work/
- WFH Research, Nov 2022 survey, https://wfhresearch.com/wp-content/uploads/2022/11/WFHResearch_updates_November2022.pdf
- Markerr, Population And Migration Data Through September 2022, see here.
- RSM US Supply Chain Index, https://realeconomy.rsmus.com/rsm-us-supply-chain-index-returns-to-pre-pandemic-level/.
Disclaimer
This report is provided by TD Economics. It is for informational and educational purposes only as of the date of writing, and may not be appropriate for other purposes. The views and opinions expressed may change at any time based on market or other conditions and may not come to pass. This material is not intended to be relied upon as investment advice or recommendations, does not constitute a solicitation to buy or sell securities and should not be considered specific legal, investment or tax advice. The report does not provide material information about the business and affairs of TD Bank Group and the members of TD Economics are not spokespersons for TD Bank Group with respect to its business and affairs. The information contained in this report has been drawn from sources believed to be reliable, but is not guaranteed to be accurate or complete. This report contains economic analysis and views, including about future economic and financial markets performance. These are based on certain assumptions and other factors, and are subject to inherent risks and uncertainties. The actual outcome may be materially different. The Toronto-Dominion Bank and its affiliates and related entities that comprise the TD Bank Group are not liable for any errors or omissions in the information, analysis or views contained in this report, or for any loss or damage suffered.
Download
Share this: