The Upcoming Crossroads of Fiscal and Monetary Policy
Andrew Foran, Economist | 416-350-8927
Date Published: November 24, 2022
- Category:
- US
- Government Finance and Policy
- Financial Markets
Highlights
- The Federal Reserve has significantly increased interest rates, which will impact the federal government’s sizeable debt refinancing plans over the coming years. This presents a few risks for volatility in the Treasury market and on fiscal plans.
- Some of the dislocations recently suffered in the Treasury market could worsen because of increased refinancing needs. In addition, elevated refinancing needs next year could intersect with Congressional wrangling over talks to raise the debt ceiling, potentially adding to the volatility.
- The budgetary implications of increased debt servicing costs could lead to increased fiscal restraint in the coming years, which may weigh on economic growth.
Working in unison with the Federal Reserve at the onset of the pandemic, the U.S. Treasury delivered extraordinary stimulus via government spending. This fiscal support was debt-financed at rock-bottom interest rates. Almost three years later, the bill is coming due and interest rates are a lot higher. Over the course of the next two years (2023-2024), thirty percent of all outstanding marketable Treasuries will mature, over half of which was issued at rates 2-3 percentage-points (ppts) below those prevailing in the market. In total, there is over six trillion dollars of debt which will mature over the next two years.
Pandemic Market Dynamics Shortened the Duration of U.S. Debt
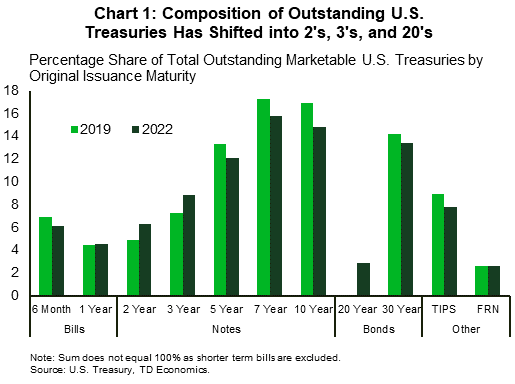
In response to market conditions, financing the massive pandemic spending in the CARES Act and other government measures was disproportionately carried out at the shorter end of the yield curve – primarily at two- and three-year terms (Chart 1). The 2 to 3-year range cumulatively increased its compositional share by roughly three percentage points. Some of this was shifted from short term bills (i.e., 6-month bill), and some came from longer-term Treasuries such as the 5- and 7-year notes. The second shift came with the revival of the 20-year bond, which was last issued in 1986. It’s share of outstanding marketable Treasuries is very modest (roughly 3%), but its relative share increase pulled down the compositional share of the 10-year note and to a lesser extent the 30-year bond.
It likely seems counter-intuitive to swap longer-term securities for shorter-term securities in a low-rate environment, but the U.S. Treasury Department must line-up its issuance with market dynamics. Given the Fed’s purchases – as part of its quantitative easing program – were disproportionately at the short end of the curve, a large-scale shift into longer-term notes and bonds would have dried up market liquidity for shorter-term maturities, exacerbating the already precarious position of financial markets at the time.
Even so, on aggregate we still saw a decline in the average yield and an increase in the average maturity for outstanding marketable Treasuries relative to before the pandemic (Table 1). The average yield at issuance dropped by almost half a percent to 2.1%, while the average maturity at issuance ticked up to more than 14 years. The extension of the average time to maturity and the lower average issuance yield should be a mitigating factor to the refinancing risk faced by the U.S. over the long-term.
Table 1: Average Yields Down and Maturities Up
| 2019 | 2022 | |
| Average Issuance Yield, % | 2.5 | 2.1 |
| Average Maturity, Years | 13.7 | 14.2 |
Refinancing Could Add to Treasury Volatility
When U.S. Treasuries mature, the government must pay back the initial principal. Of the debt issued to finance the government’s pandemic spending surge, it is that which was issued in two- and three-year maturities which will be the most consequential in 2023 and 2024.
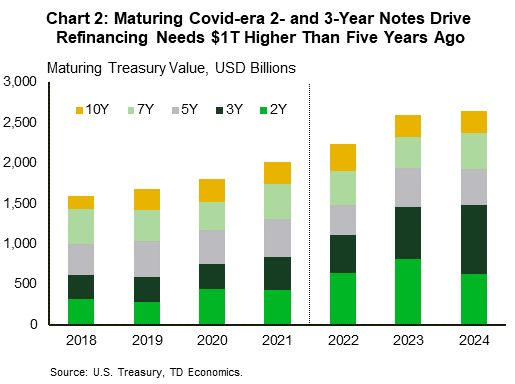
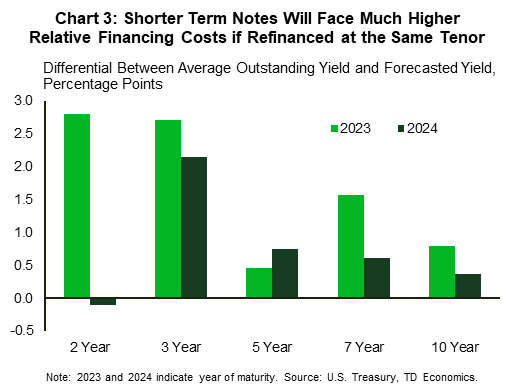
The impact of pandemic debt issuance can clearly be seen by the fact that the value of maturing Treasury notes is roughly $1 trillion higher in 2023/2024 relative to five years ago (Chart 2). These Treasuries will need to be refinanced at much higher rates, particularly at the short end of the yield curve (Chart 3). The two-year note will see less of an impact in 2024 as these securities were issued at higher rates. The three-year note will see a more consistent yield increase in both 2023 and 2024 because the securities maturing in the next two years were issued in 2020 and 2021. Still, the 2024 yield difference will be less as we anticipate that yields will fall throughout 2023 and into 2024 with the Fed switching to a more accommodative stance amid a slowdown in economic growth. Yield differences relative to the time of issuance remain positive across most of the curve as interest rates are expected to stay above their pre-pandemic levels. The longer-term notes that will mature in the coming two years were issued before the pandemic, and therefore reflect smaller relative yield differences.
There are two risks related to this wave of refinancing. First, since the Fed began quantitative tightening, the Treasury market has suffered some dislocations (see Question 3 in Q&A). Thus, this higher refinancing need could cause more challenges on this front. Second, given this will be occurring at the same time as a potential debate about raising the country’s debt ceiling, there are significant odds of heightened volatility.
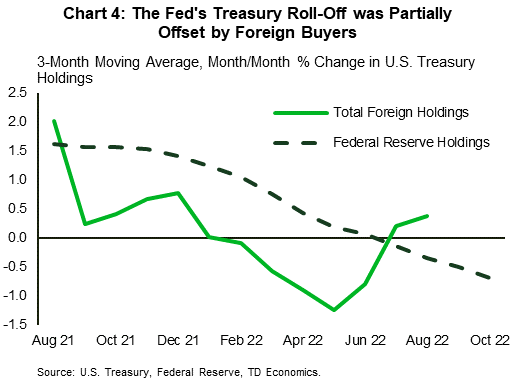
After the Fed began allowing the Treasuries on its balance sheet to roll-off (mature without reinvesting the proceeds), market liquidity and depth have been partially impaired as the largest buyer is no longer buying. While the Fed is no longer an active buyer, it appears that foreign buyers momentarily picked up the torch in July and August (Chart 4). Domestic investors have also increased their holdings of Treasuries in recent quarters, likely drawn in by higher yields. Demand for Treasuries is expected to hold up as yields in the U.S. remain relatively rich compared to other advanced economies, and recession fears keep demand for this safe have asset healthy.
Related to the second risk, estimates suggest the federal debt ceiling will need to be raised in the first half of 2023. Just after the new divided Congress is sworn in in January. It is possible that Congressional Republicans will use the debt ceiling deadline as leverage to impose more spending restraint or achieve other policy goals. We don’t expect a repeat of the 2011 debacle when the last-minute brinksmanship resulted in a U.S. downgrade, but there is the potential for volatility. The U.S. Treasury Department can undertake “extraordinary measures” as they get close to the limit, but it is most likely that an agreement will be reached and the debt ceiling will be raised without incident. However, coupled with QT, drawn-out negotiations could present further volatility risks in Treasury markets.
Fiscal Restraint is Coming
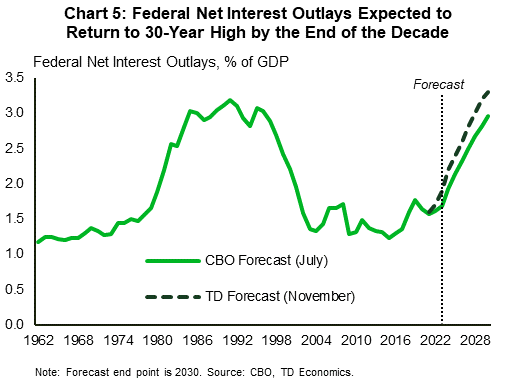
The political wrangling is highly uncertain at this stage, but higher debt financing costs will have a notable impact on the federal budget. In the near-term, higher debt service payments will require either diverting funds from other sources (i.e., cutting spending), raising revenue (i.e., raising taxes), or issuing larger amounts of debt. In 2021, federal net interest payments were $352 billion, and the CBO estimates that will rise to around $450 billion in 2023 – roughly $130 billion higher than it estimated a year earlier. That difference grows to around $200 bn in 2023. As a share of GDP, the CBO has forecast that federal net interest outlays will nearly double by the end of the decade (Chart 5).
However, the CBO forecasts were last updated in May, at a time when the projected terminal rate for the Federal Reserve was roughly 1.5-2% lower than present forecasts. Our current expectations are for net interest outlays (as a % of GDP) to rise slightly quicker in the medium term relative to CBO July estimates and sit near 3.3% by 2030.
Bottom Line
The federal government issued a sizeable amount of debt during the pandemic, with much of it issued in two- and three-year Treasury notes. Thirty percent of outstanding Treasuries will mature over the next two years and will need to be refinanced at higher interest rates in a Treasury market that has been having some liquidity challenges recently. Added to that is the need to raise the debt ceiling in the first half of next year with Congress divided. If there is last minute drama between Republicans and Democrats in coming to an agreement, volatility could also increase. Looking past short-term volatility, it is likely that higher borrowing costs will raise the amount of fiscal restraint that is coming down the pipe over the next couple of years.
Disclaimer
This report is provided by TD Economics. It is for informational and educational purposes only as of the date of writing, and may not be appropriate for other purposes. The views and opinions expressed may change at any time based on market or other conditions and may not come to pass. This material is not intended to be relied upon as investment advice or recommendations, does not constitute a solicitation to buy or sell securities and should not be considered specific legal, investment or tax advice. The report does not provide material information about the business and affairs of TD Bank Group and the members of TD Economics are not spokespersons for TD Bank Group with respect to its business and affairs. The information contained in this report has been drawn from sources believed to be reliable, but is not guaranteed to be accurate or complete. This report contains economic analysis and views, including about future economic and financial markets performance. These are based on certain assumptions and other factors, and are subject to inherent risks and uncertainties. The actual outcome may be materially different. The Toronto-Dominion Bank and its affiliates and related entities that comprise the TD Bank Group are not liable for any errors or omissions in the information, analysis or views contained in this report, or for any loss or damage suffered.
Download
Share: