Highlights
- A precipitous decline in revolving consumer credit is somewhat at odds with the pandemic-induced increase in public and private debt.
- The decline comes from two sources: fiscal measures, which include income support and moratoria on credit payments, and the lack of credit demand, spurred by a compositional shift in spending away from high-contact services.
- Going forward, there is little reason to believe that the decline is permanent. As government support programs expire, spending on services rebounds and excess savings are exhausted, revolving consumer credit should gradually recover.
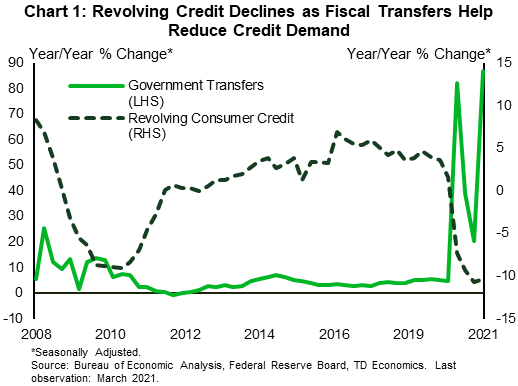
One of the most noticeable consequences of the pandemic has been a sharp increase in debt. With several rounds of fiscal support packages, the federal budget deficit has run around 15% of GDP for the past two years, adding a cumulative 30 percentage points of GDP to the national debt. Private debt has also increased, with both businesses and households adding to debt levels through the pandemic. The one exception to this trend is revolving consumer credit (mainly made up of credit card debt, but also including personal lines of credit not secured by real estate).
From February 2020 through April 2021, revolving credit declined by more than 12%. This reduction in usage has reflected both a drop in consumption of high-touch services during the pandemic, as well as income supports that allowed consumers to pay down revolving debt (Chart 1).
As we come out of this crisis, spending habits suppressed during the pandemic will likely resurface. However, at least initially, a sizeable portion of spending is likely to be financed by excess savings, limiting growth in credit card debt. Once excess savings have been exhausted, American households are likely to gradually return to using credit cards to finance spending, resulting in a rebound in revolving consumer credit growth.
Credit Risk to Households Was Limited Prior to the Pandemic
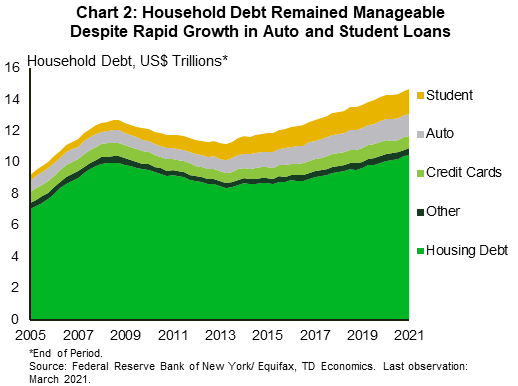
To help us understand credit trends of this crisis, it is useful to look back at the past ten years. Unlike the situation prior to the Global Financial Crisis, household leverage did not show any worrisome trend prior to the pandemic. While reaching a new high of $14 trillion at the end of 2019, household debt grew roughly in line with personal income. Additionally, thanks to persistently low interest rates, that debt has become cheaper to finance: the consumer debt service ratio edged down from 5.9% in September 2008 to 5.7% in March 2020.
Compositionally, housing-related debt (such as mortgages and home equity lines) accounts for roughly 70% of all household borrowing (Chart 2). Housing debt has accelerated recently with the post-pandemic housing boom but was relatively modest and stable prior to the pandemic. At the same time, its growth was led by lower-risk borrowers with high credit ratings. With home prices outpacing credit growth, homeowner equity increased, further reducing household credit risk.
Credit card debt was also modest and, like mortgage debt, accrued mainly to households with prime scores. The one pocket of risk, at least on the surface, was the non-revolving portion of consumer credit, which has been on a strong upward trend since 2008. Within this category, auto and student loans surged by 65% and 175%, respectively. Despite this sizeable growth, financial stability risks emanating from non-revolving credit was limited, as auto loans’ credit quality remained solid and student debt is backed by the federal government. Still, the rising student debt burden in particular has become a political issue, with a number of forgiveness proposals taking center stage in policy discussions (see textbox).
Consequently, when the pandemic hit, overall household debt risks were limited. Financial vulnerabilities were concentrated within the cohort of highly leveraged households without substantial savings. For these households, a sudden loss of income would threaten financial well-being, even if less impactful to the broader financial system.
Out of Debt, Out of Danger
What’s more, most American families, including some of the most financially vulnerable ones, have managed to emerge from the health crisis financially stronger than had been anticipated. In March of 2020, as the economy quickly sank into lockdowns, concerns about Americans’ ability to make financial ends meet prompted one of the most ambitious policy responses in history, starting with the Coronavirus Aid, Relief, and Economic Security (CARES). Since the enactment of the CARES Act consumer credit outstanding started to decline.
This trend continued as supplementary measures and two other fiscal packages – the Coronavirus Response and Relief Supplemental Appropriations (CRRSA) Act and the American Rescue Plan – continued to provide more income stimulus. According to the Survey of Consumer Expectations, approximately 37% of all economic impact stimulus was used to pay-down debt. This translates into roughly $150 billion, taking all three fiscal packages together.
Moratoria on credit payments imposed by the Federal government on mortgage and student loan payments also played a role in reducing other sources of consumer debt, including credit cards. According to NY Fed researchers, prior to the pandemic, aggregate monthly payments on mortgages and student loans were about $55 billion and $7 billion per month, respectively.1 Based data from the Mortgage Bankers Association, mortgage payment forbearance totaled roughly $45 billion from March 2020 to March 2021. Of this amount, half was paid off through scheduled installments, lump-sum payments or by refinancing/selling the property. This has left roughly $23 billion in “relief savings” that was passed onto financially- strained families. These savings will need to be paid back eventually, but in the meantime, flexible terms of repayment have helped households reduce their monthly payment or, in some cases, delay the repayment until they need to sell or refinance their property.
A similar calculation on student debt results in approximately $8 billion in “relief savings” through the federally backed student debt programs, assuming that only the lowest income households (which account for 10% of all student loan payments) deferred their payments.2 For a minority of student debt holders who were financially strained, these savings were crucial in making ends meet and, in some cases, helping them out of financial burden by repaying higher-interest credit card debt.
Bifurcated Credit Demand
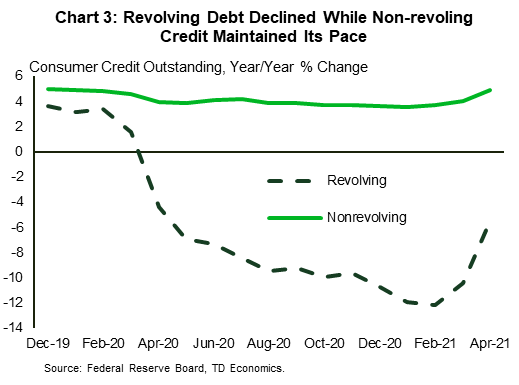
Another reason for a decline in credit balances was the lack of credit demand, spurred by a compositional shift in spending away from high-contact services towards durable goods, which runs parallel to the shift in credit demand away from revolving credit, towards solid growth in non-revolving installment credit, such as auto loans (Chart 3).
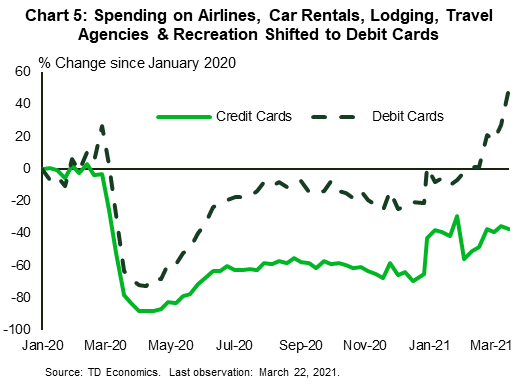
Intuitively, these trends can be attributed to behavior of two broad types of households. Higher-income households, who tend to spend more on discretionary items, used less credit due to increased public restrictions that made services unavailable, while lower income households used income support programs and loan forbearances to pay off outstanding balances, while also switching from cards to cash for their daily spending. In a series of research studies, economists at the Federal Reserve Bank of New York have shown that credit utilization and spending by families of different incomes have distinct characteristics.3 In one of the studies, they found that credit balances declined by 15% for lower-income borrowers and by 19% for higher-income borrowers, who received less income support, suggesting that factors other than fiscal transfers played a role in the decline in credit balances. Another study corroborated this by showing that high-income households typically spend more on pandemic-constrained goods and services – such as airlines, recreation, and temporary lodging – which are only starting to recover.

Whatever the reason, the decline in credit card balances was broad-based. According to Equifax data, maximum bankcard balances drawn dropped for borrowers across all credit categories (Chart 4). In fact, subprime and prime borrowers have managed to reduce their credit card balances the most – by 45% and 44%, respectively. Such significant reduction in credit balances may have leveled the playing field for borrowers who had trouble managing debt before the pandemic.
The Return of Revolving Credit
As we come out of this crisis, the extent to which spending growth is matched by a consumer credit expansion is an open question. As of April, spending on services is still 3% below the pre-pandemic level, with higher-income households continuing to spend less than their lower-income counterparts. Remaining health restrictions alongside the still-present fear of contracting COVID-19 continue to weigh on services consumption.
Nonetheless, with ongoing progress in vaccination, sentiment is starting to change. In the recent Household Pulse Survey, a greater share of high-income families (those with income above $100,000) responded that they spent more due to business reopening (18% in April vs. 3% in January) or because they are no longer concerned about going to public places (15% vs. 3%). So as services become widely available and people feel safer, we should see a rebound in consumer credit demand.
At the same time, however, the speed of the consumer credit recovery is unlikely to mirror the pace of the descent. American consumers have over $1.5 trillion (as of April 2021) in excess savings to satisfy a sizeable pent-up demand for services. Indeed, high-frequency data points to a substitution away from bankcards to using debit cards instead (Chart 5).
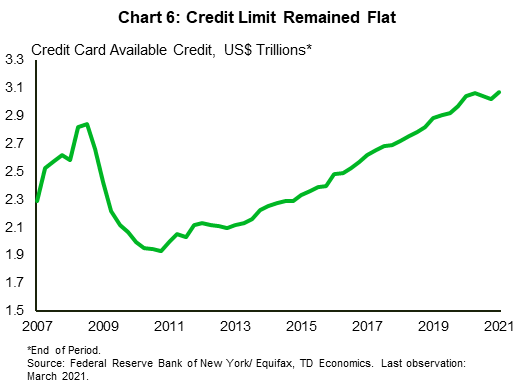
Looking out longer term, there is good reason to see a behavior to revert back to pre-pandemic trends. According to researchers of the Federal Reserve Bank of Boston, credit utilization – the share of credit limit used at any given point in time – is extremely stable over time and typically changes on an individual level over a person’s lifecycle.4 Since the aggregate credit card credit limit declined only marginally during this crisis, credit utilization should eventually return to equilibrium. The exact timing is hard to pinpoint, but we expect that consumer credit will get its initial boost once government deferment programs run their course, rising slowly over time as excess savings are exhausted (Chart 6). As long as this rise is supported by income growth, the return of revolving credit will not pose a threat to the financial stability.
Bottom Line
Revolving consumer credit continues its search for a bottom. As of April 2021, credit card balances shrank by more than $140 billion relative to their pre-virus peak, while retail cards lost almost $20 billion. Unlike in previous recessions, the decline is driven by restrictions on high-contact services and fiscal transfers that helped offset income losses, and not by credit supply constraints. Going forward, there is little reason to believe that the decline is permanent. As government programs expire, spending on services rises and excess savings are exhausted, revolving consumer credit should gradually recover.
Textbox: Student Debt
Programs designed to finance higher education remain critical to American peoples’ fair chance at having better career prospects and attracting higher wages throughout their working life. Not less important is borrowers’ ability to avoid a debt trap resulting from a failure to meet education loans’ when entering a job market. An overwhelming balance of $1.7 trillion in student debt – the second largest type of household debt after mortgages – spurred a public debate that resulted in several policy recommendations aimed at cancelling a portion of student loan debt, with the most generous of them proposing full forgiveness. Critics of student debt cancellation suggest that it will disproportionately help wealthy individuals, while its proponents argue that it will eliminate wealth inequalities.
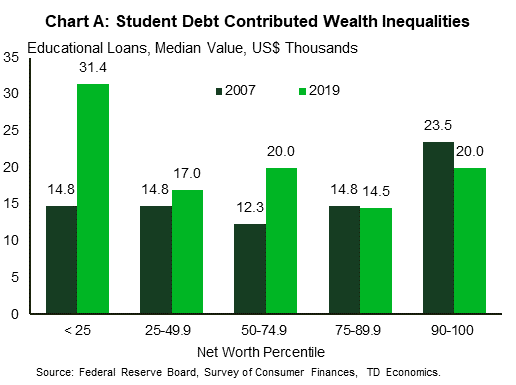
As often the case, the truth lies somewhere in between. Although the largest share of student debt is owed by the highest-income earners, evidence suggests that there is a wide dispersion in borrowing and repayment experiences. Comparing responses to the Survey of Consumer Finances from 2007 to 2019 shows that student debt accumulation has disproportionally affected less financially-secure households, contributing to increased inequality (Chart A).
Meantime, recent studies fill in some important details. For example, a study by the Brookings Institution found that students at “nonselective” schools (i.e. community colleges) are usually from less affluent households and have less chance at economic success than students that attend elite non-profit institutions. They are also more likely to drop out before completing a degree, have lower post-college earnings, and more likely to default on their loans*. Another study by the JPMorgan Chase Institute found that relative to White borrowers, Black borrowers have lower incomes and higher debt balances and are four times as likely to have no payments made against their loans, partly due to the fact that they are less likely to receive repayment help.
These socioeconomic disparities suggest that there is merit to student debt relief, but also prove that it is a complex issue, which requires a targeted policy aimed at reducing inequality without subsidizing affluent borrowers.
End Notes
- Haughwout, A., Lee, D., Scally, J., van der Klaauw, W. “U.S. Consumer Debt Payments and Credit Buffers on the Eve of COVID-19”, Federal Reserve Bank of New York. https://libertystreeteconomics.newyorkfed.org/2020/05/us-debt-payments-and-credit-buffers-on-the-eve-of-covid-19.html
- In theory, student debt “relief savings” could run as high as $90 billion because for all eligible students payment and interest were suspended until at least September 2021 https://studentaid.gov/announcements-events/coronavirus
- For more on these series, visit this link: https://libertystreeteconomics.newyorkfed.org/
- Fulford, S.L., Schuh, S. “Consumer Revolving Credit and Debt over the Life Cycle and Business Cycle”, Federal Reserve Bank of Boston. https://www.bostonfed.org/publications/research-department-working-paper/2015/consumer-revolving-credit-and-debt-over-the-life-cycle-and-business-cycle.aspx
Disclaimer
This report is provided by TD Economics. It is for informational and educational purposes only as of the date of writing, and may not be appropriate for other purposes. The views and opinions expressed may change at any time based on market or other conditions and may not come to pass. This material is not intended to be relied upon as investment advice or recommendations, does not constitute a solicitation to buy or sell securities and should not be considered specific legal, investment or tax advice. The report does not provide material information about the business and affairs of TD Bank Group and the members of TD Economics are not spokespersons for TD Bank Group with respect to its business and affairs. The information contained in this report has been drawn from sources believed to be reliable, but is not guaranteed to be accurate or complete. This report contains economic analysis and views, including about future economic and financial markets performance. These are based on certain assumptions and other factors, and are subject to inherent risks and uncertainties. The actual outcome may be materially different. The Toronto-Dominion Bank and its affiliates and related entities that comprise the TD Bank Group are not liable for any errors or omissions in the information, analysis or views contained in this report, or for any loss or damage suffered.
Download
Share this: