Every Time is Different: 2026’s Energy Shock
Date Published: April 1, 2026
- Category:
- U.S.
- Commodities & Industry
- We’re staring down the fourth major economic shock since 2019 – COVID, the war in Ukraine, sweeping new U.S. tariffs, and now the war in Iran.
- For good reason, the past few weeks have brought back memories of the inflation surge in early 2022, which was exacerbated by the surge in oil prices due to the war in Ukraine. However, as important as the similarities are to 2022, it’s also important to take stock of what is different.
A Commodity Shock
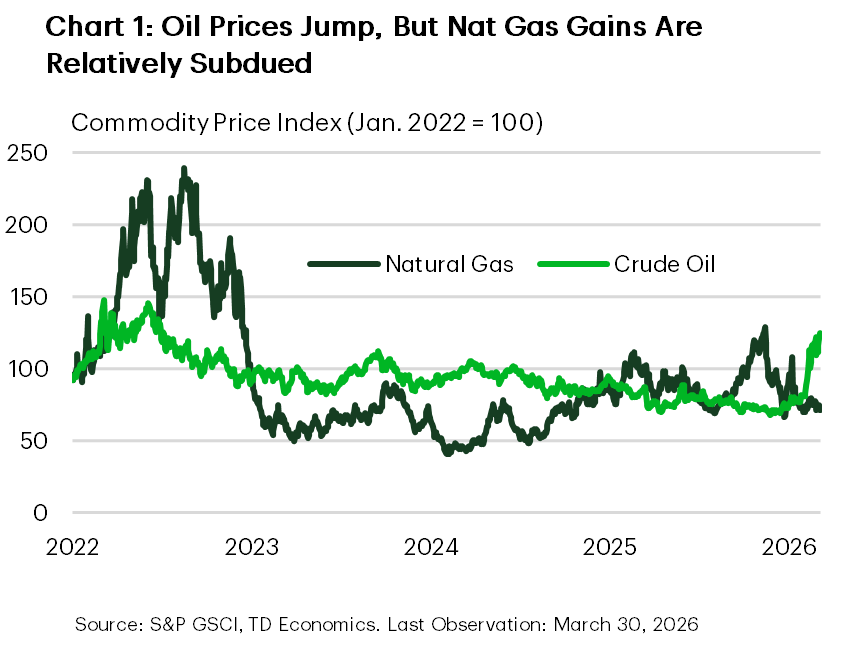
- With the Strait of Hormuz closure effectively shutting off 20% of the world’s oil supply, oil prices have surged again, with Brent crude up 50% since military strikes began on Feb. 27th. WTI prices are up roughly 59% (at the time of writing).
- Chart 1 shows U.S. energy price indexes. While oil has nearly retraced its post-pandemic highs, U.S. natural gas prices remain well below 2022 levels.
- That said, risks are to the upside as this year’s oil disruption could be more prolonged and substantial than 2022. The region around the Persian Gulf is responsible for nearly 28% of global production, a far greater share of energy production than Russia in 2021 (~11%).
- The risk is that oil prices stay higher for longer (see our outlook for details) as ramp up and repair timelines for key oil infrastructure delay the return of product to market, keeping supply constrained.
- Some countries are facing shortages, with some governments imposing shorter work weeks on employees (like Sri Lanka and the Philippines) or other rationing measures to allocate scare supplies.
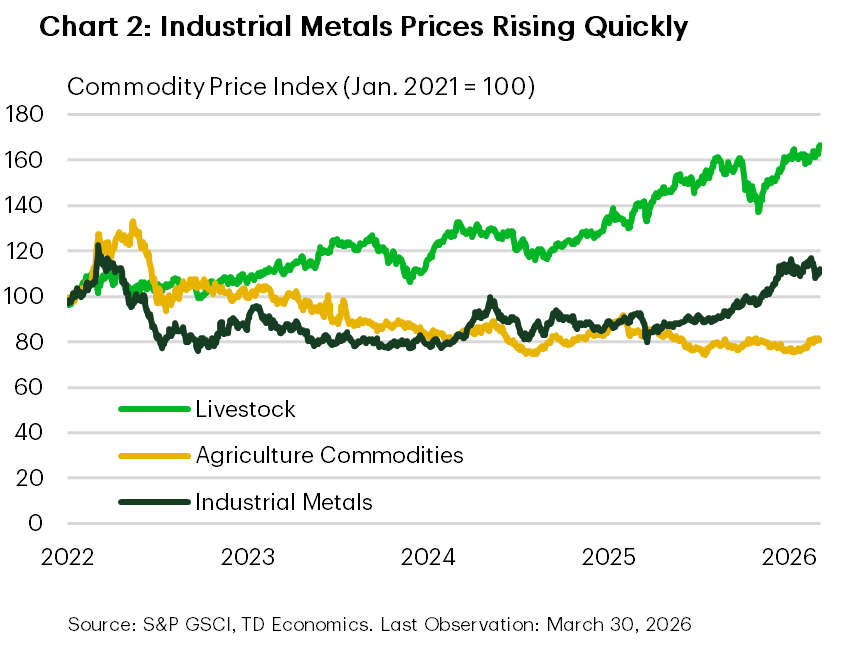
- Concerns about impacts on food prices are also present. However, U.S agricultural commodity prices (Chart 2) have been steady over the past year.
- The Persian Gulf region is not a food producer on the scale of Ukraine. In 2022 the war disrupted flows of wheat through the Black Sea and U.S. prices jumped roughly 20% over the following 20 days ultimately rising over 40% by May 2022. Today that increase is roughly 6%. Looking forward, food prices could come under pressure. Prices for urea, which is a key fertilizer input, are up over 40% since late February, while transportation costs continue to rise on higher oil prices.
- Conversely U.S. livestock prices have been steadily rising, but these are more the result of drought and other factors affecting supply.
- Other critical commodities are also facing shortages. Helium, a key input into chipmaking processes, has seen its price soar1 as bottlenecks in LNG have constrained supplies. Reports of shortages have emerged2, potentially resulting in chipmaking production cuts. The shortage is another unwelcome headache for a global semiconductor industry that is already struggling to keep up with demand.
The Supply Chain Impact
- For Canada and the U.S., the good news is that the economy is in a considerably different position than it was in 2022.
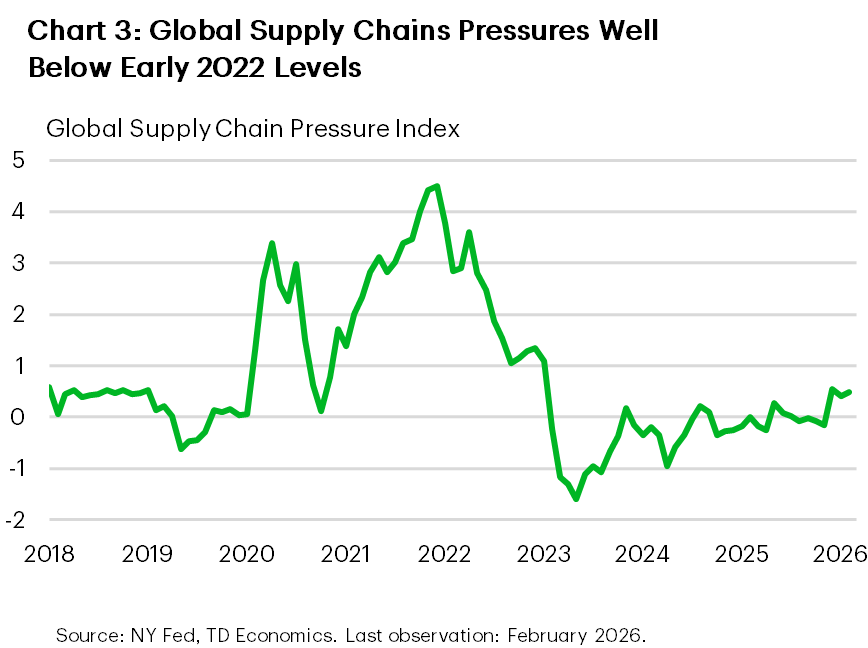
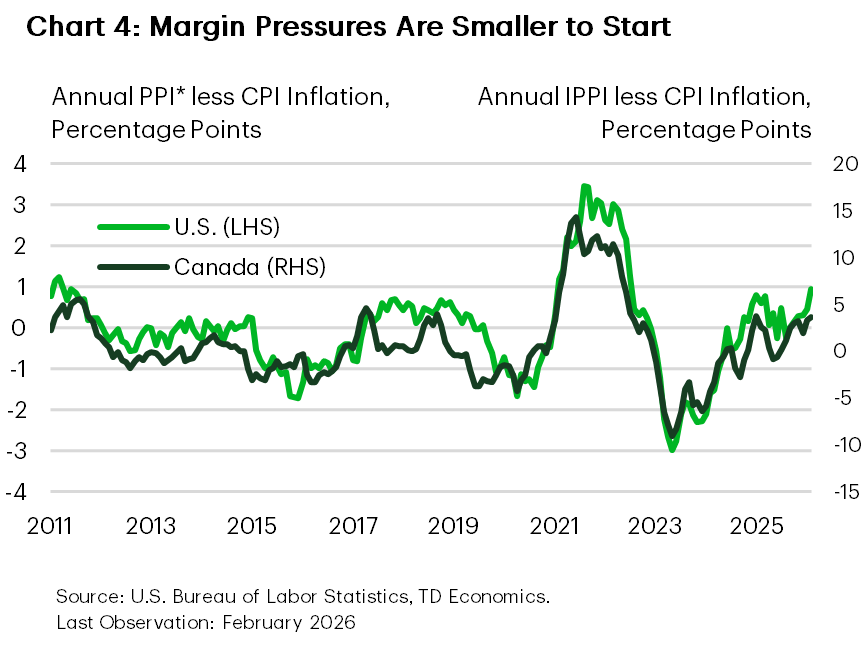
- Coming out of the pandemic supply chains were already strained after almost two years of lockdowns and travel restrictions around the world (Chart 3). Input prices were already rising sharply, with measures of producer prices outstripping gains in consumer prices (Chart 4). This was indicative of margin pressure accumulating for firms. At that time, robust labour demand and ample consumer savings meant that firms could pass on higher costs to consumers with less fear about losing market share.
- The demand side of the equation is also different. By 2022, successive waves of fiscal stimulus and lockdown measures had left households with large savings that were deployed as restrictions were lifted. That is no longer the case.
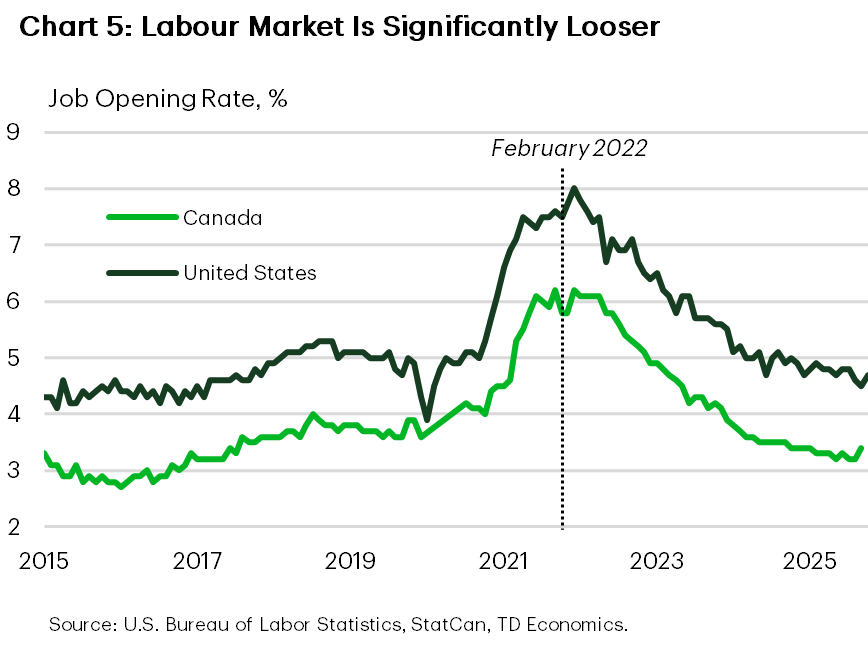
- The labour market is also not as tight as it was back then. By late 2021 and early 2022 the labour market was drum tight, with high levels of job switching and strong wage growth (Chart 5). Demand was outstripping supply for many goods. As a result, order backlogs were also plentiful, with businesses and consumer waiting for products. These circumstances created fertile conditions for firms to be able to pass on additional costs without fear of losing market share.
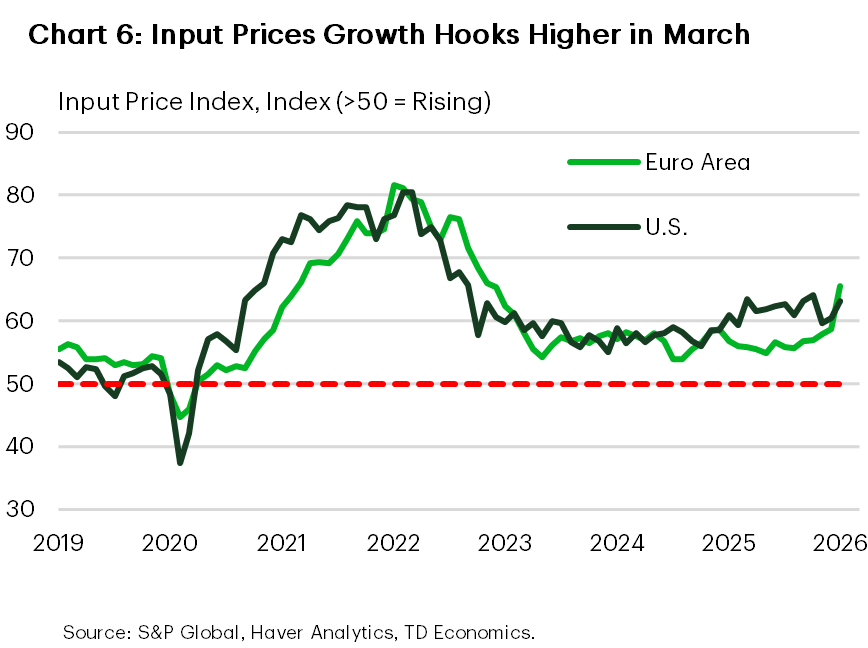
- That said, we’re starting to see the effects of higher oil prices on supply chains. Flash PMI data for March are available for the U.S. and the euro area (Chart 6). Input prices (that had already started rising faster to end 2025) notably accelerated in March. The effect (unsurprisingly) was most pronounced in Europe, where exposure to Brent crude and LNG prices is high.
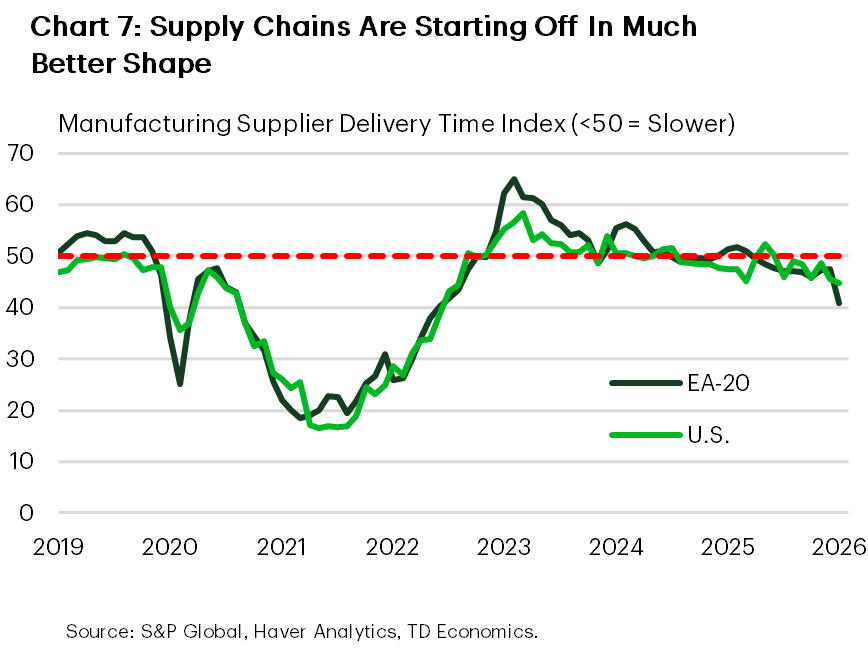
- Supply chains were starting March 2026 on much better footing than 2022. Order backlogs were in much better shape than in 2022, and manufacturer supplier delivery times are elongating only marginally (Chart 7). However, the notable deterioration in European supplier delivery timelines through the first few weeks of March is certainly worth monitoring and could be a sign of things to come. But things would need to get a lot worse to match the same effects from 2021-2022.
What Does This Look Like for Inflation
- The initial shock to energy prices is playing out right now at the pump. Airfares (critically exposed to jet fuel prices) are expected to respond quickly as well. Whether flows through the Strait of Hormuz resume shortly, or if the disruption worsens will determine how far the prices pressures spread to other goods and services.
- Although the North American economy is not in the place of large excess demand as it was to start 2022, the U.S. economy is performing better than Canada, suggesting less slack and more upside potential for inflation.
- Inflation in the U.S. was running above the Federal Reserve’s target even before the war. Core CPI inflation is cruising at 3.0% on a three-month annualized basis, and core PCE at 3.7%. On a six-month basis the figures are 2.3% and 3.1%, respectively. Core PCE inflation is the Fed’s preferred metric.
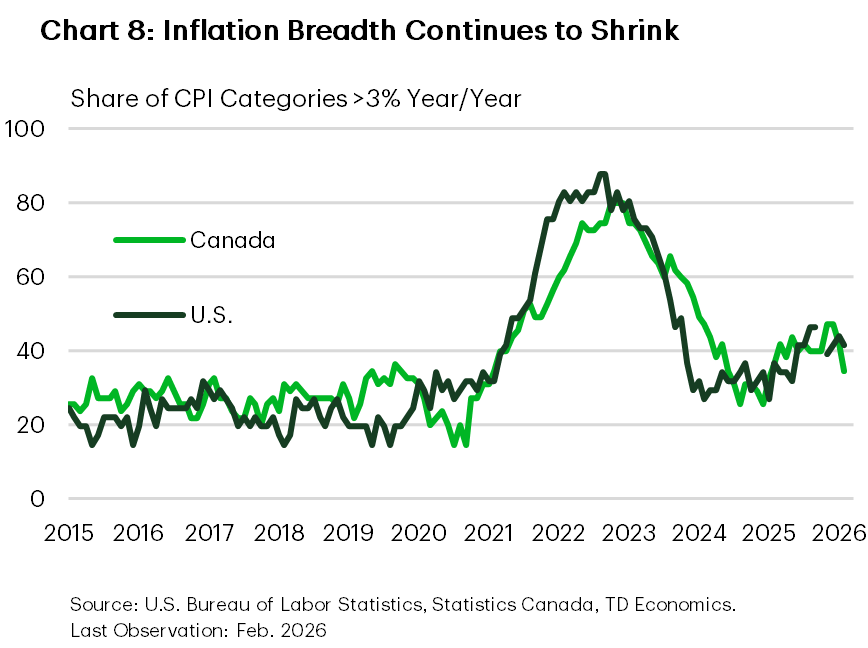
- In Canada, measures of inflation breadth suggest price pressures are significantly lower now than in late 2021 (Chart 8). The average of the Bank of Canada’s measures of core inflation (trim and median) is running 1.0% and 1.7% on a three- and six-month annualized basis. Together with a softer labour backdrop, and downbeat economic sentiment, it suggests that there is less scope for broader price gains than in 2022.
- The supply-demand balance between the two countries is notably different. Downbeat demand in Canada, and some upside to CAD from higher energy prices, are expected to provide some insulation from more persistent core inflation.
- Of course, higher inflation risks remain ever-present. U.S. officials reportedly informed G-7 countries that the conflict could last another two to four weeks. This would further exacerbate the oil shortage and pressure prices higher. As we highlighted in our recent forecast, the higher path for energy prices would seep into the rest of the economy, pushing core prices higher and resulting in demand destruction.
- The wild card in all of this is whether inflation expectations remain in check. Even during the run-up in 2022, central bank credibility remained intact. Thus far, there is little evidence yet to expect a different outcome in 2026.
End Notes
- Kumar, A., S. Saha, T. Sterling (March 12, 2026) “Helium Prices Soar as Qatar LNG Halt Exposes Fragile Supply Chain” Reuters, https://www.reuters.com/business/energy/helium-prices-soar-qatar-lng-halt-exposes-fragile-supply-chain-2026-03-12/
- Baptista, E., (March 26, 2026) “Helium Shortage Has Started Impacting Tech Supply Chain, Execs Say” Reuters, https://www.reuters.com/world/asia-pacific/helium-shortage-has-started-impacting-tech-supply-chains-execs-say-2026-03-26/
Disclaimer
This report is provided by TD Economics. It is for informational and educational purposes only as of the date of writing, and may not be appropriate for other purposes. The views and opinions expressed may change at any time based on market or other conditions and may not come to pass. This material is not intended to be relied upon as investment advice or recommendations, does not constitute a solicitation to buy or sell securities and should not be considered specific legal, investment or tax advice. The report does not provide material information about the business and affairs of TD Bank Group and the members of TD Economics are not spokespersons for TD Bank Group with respect to its business and affairs. The information contained in this report has been drawn from sources believed to be reliable, but is not guaranteed to be accurate or complete. This report contains economic analysis and views, including about future economic and financial markets performance. These are based on certain assumptions and other factors, and are subject to inherent risks and uncertainties. The actual outcome may be materially different. The Toronto-Dominion Bank and its affiliates and related entities that comprise the TD Bank Group are not liable for any errors or omissions in the information, analysis or views contained in this report, or for any loss or damage suffered.
Download
Share: