East Coast Population Growth Slows, List of States Facing Stagnation or Decline to Expand This Year
Admir Kolaj, Economist | 416-944-6318
Date Published: March 2, 2026
- Category:
- US
- State & Local Analysis
Highlights
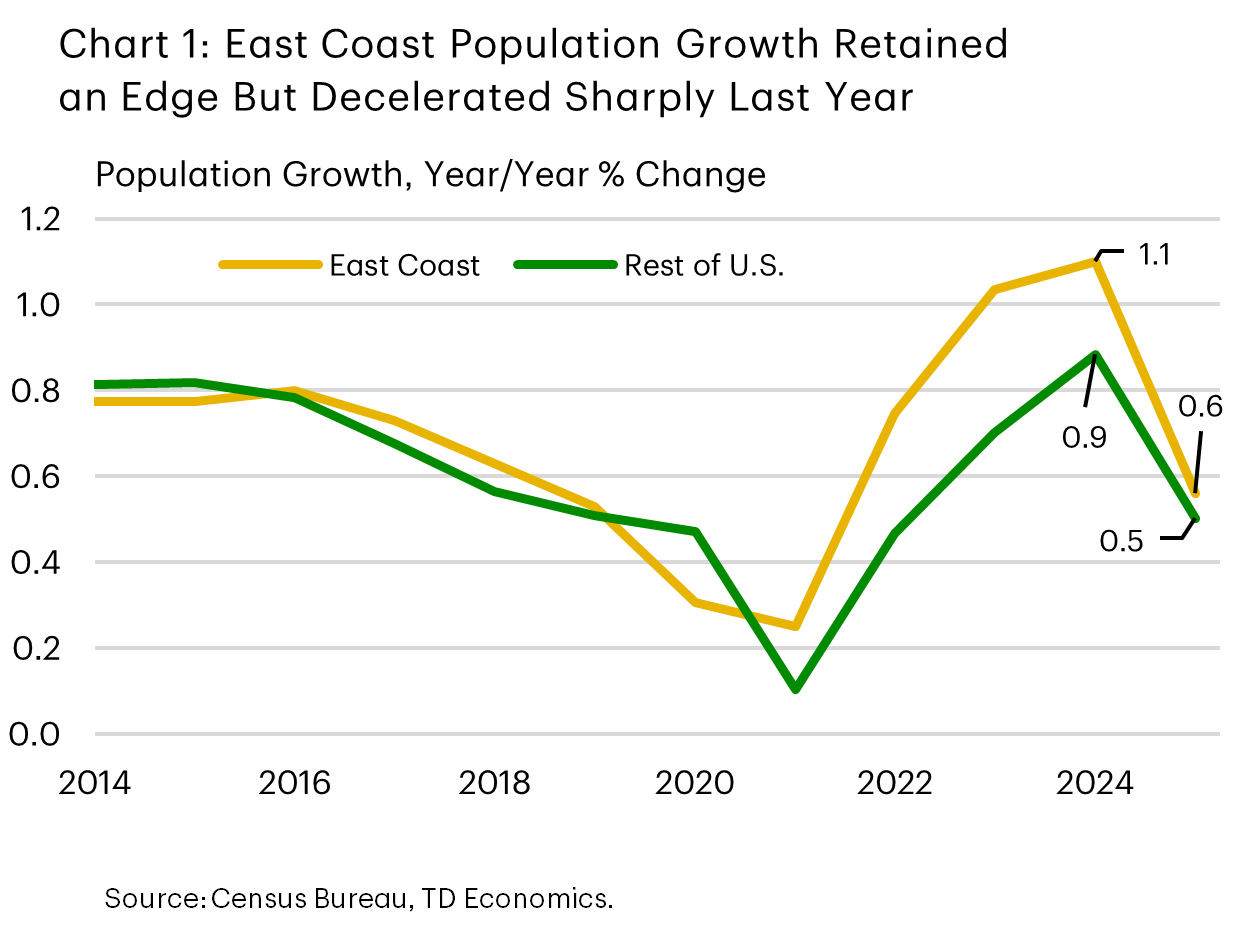
- Population growth across the East Coast slowed to 0.6% in 2025 from 1.1% in 2024, driven by a halving in net international migration and a cooling in domestic inflows to the eastern “Sun Belt.”
- Net international migration accounted for all or nearly all population growth in roughly two-thirds of East Coast states, underscoring elevated regional reliance. A pronounced cooling in international migration was recorded in New York, New Jersey, Maryland, and South Carolina. That said, in the latter, steady domestic inflows helped keep population growth at a region-leading clip of 1.5%.
- With immigration projected to slow further in 2026 amid a tighter policy backdrop, we estimate that the number of states in the region facing stagnation or outright population declines will more than double – from three in 2025 to seven this year.1
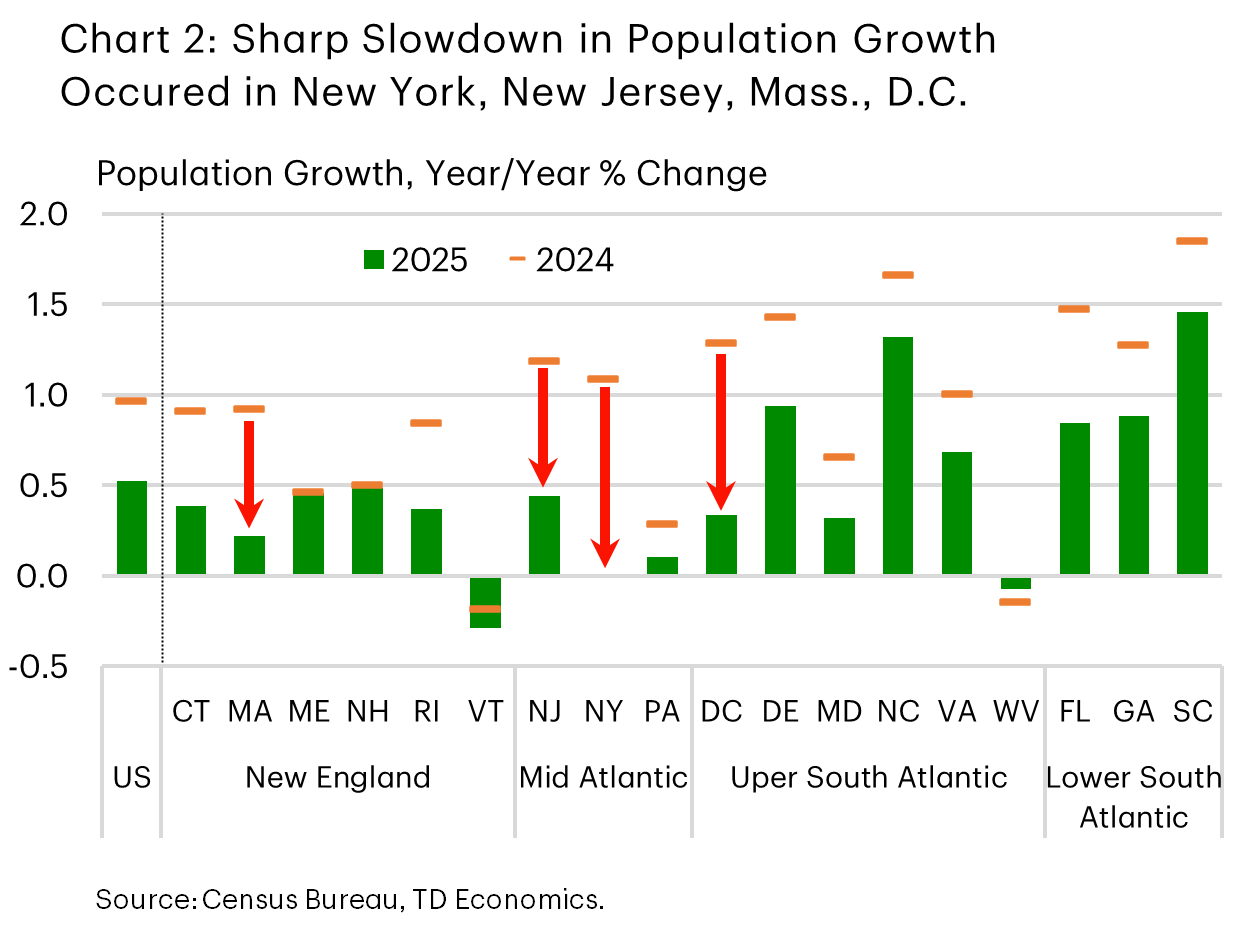
U.S. population growth slowed sharply last year to 0.5% from 1.0% in the prior year, with the deceleration primarily attributable to a reduction in net international migration (also referred to as immigration2). The East Coast region mirrored this cooling. While it managed to keep a slight edge over the rest of the country, supported by stronger gains in its southern half, its deceleration was slightly more pronounced, with population growth easing to 0.6% from 1.1% previously (Chart 1). Sharp slowdowns were recorded in a handful of Northeast states, such as New York, New Jersey and Massachusetts (Chart 2).
The cooling in immigration was the dominant driver of the region‑wide slowdown and broadly aligned with the national experience. However, easing net domestic migration also contributed to the slowdown, as even the traditional growth engine of the Southeast showed signs of fatigue on this front. As we move into 2026, a key question remains: how much further will population growth slow amid a tighter immigration policy backdrop?
International Migration Slowed but Still the Key Driver of Population Growth
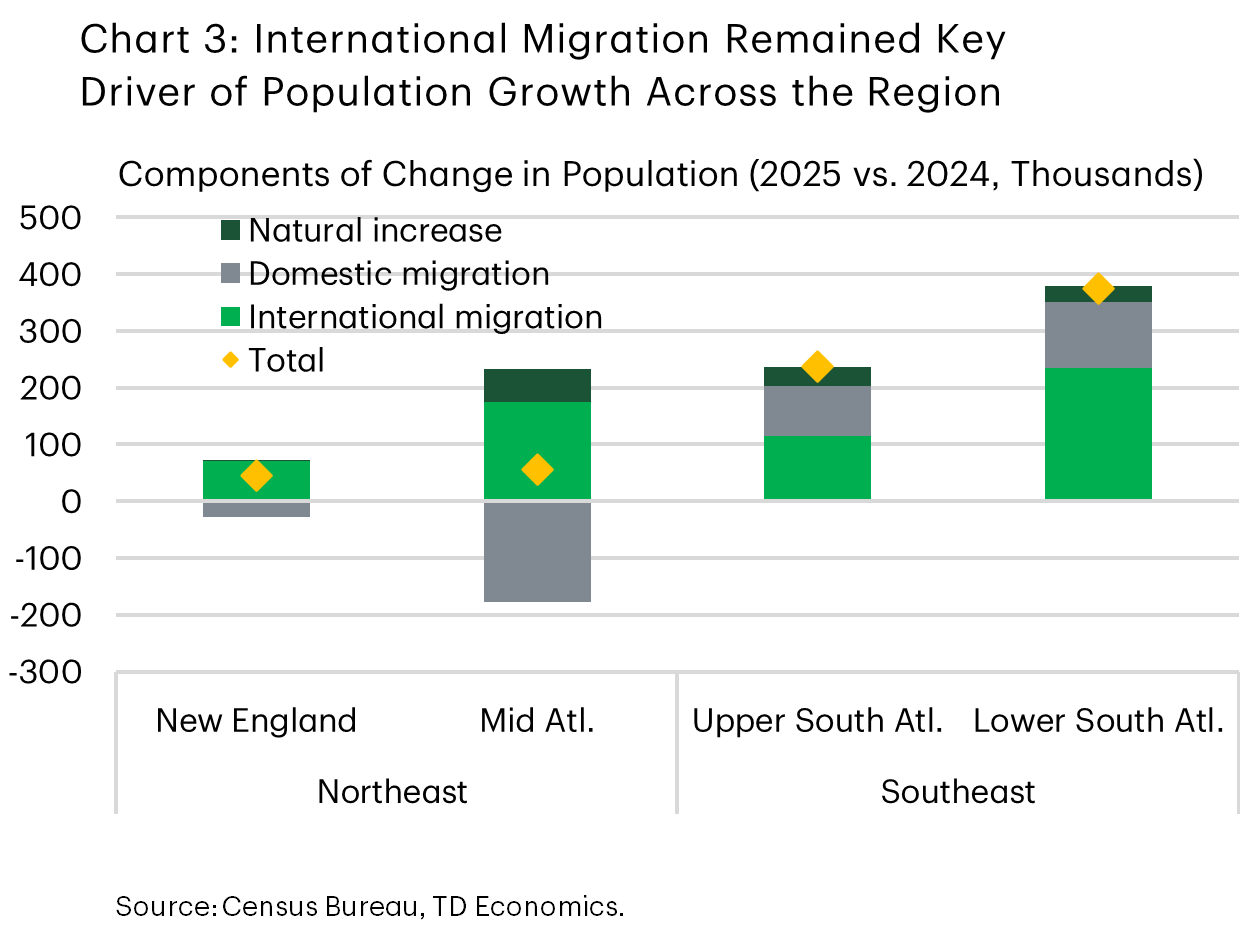
International migration remained the single largest contributor to population growth across the East Coast (Chart 3), accounting for all or nearly all growth in half of the states in the region. But net inflows did slow sharply to around 600,000 in 2025, down from 1.2 million in 2024 – a halving broadly in line with the national trend. Yet, there were several notable outliers at the state level.
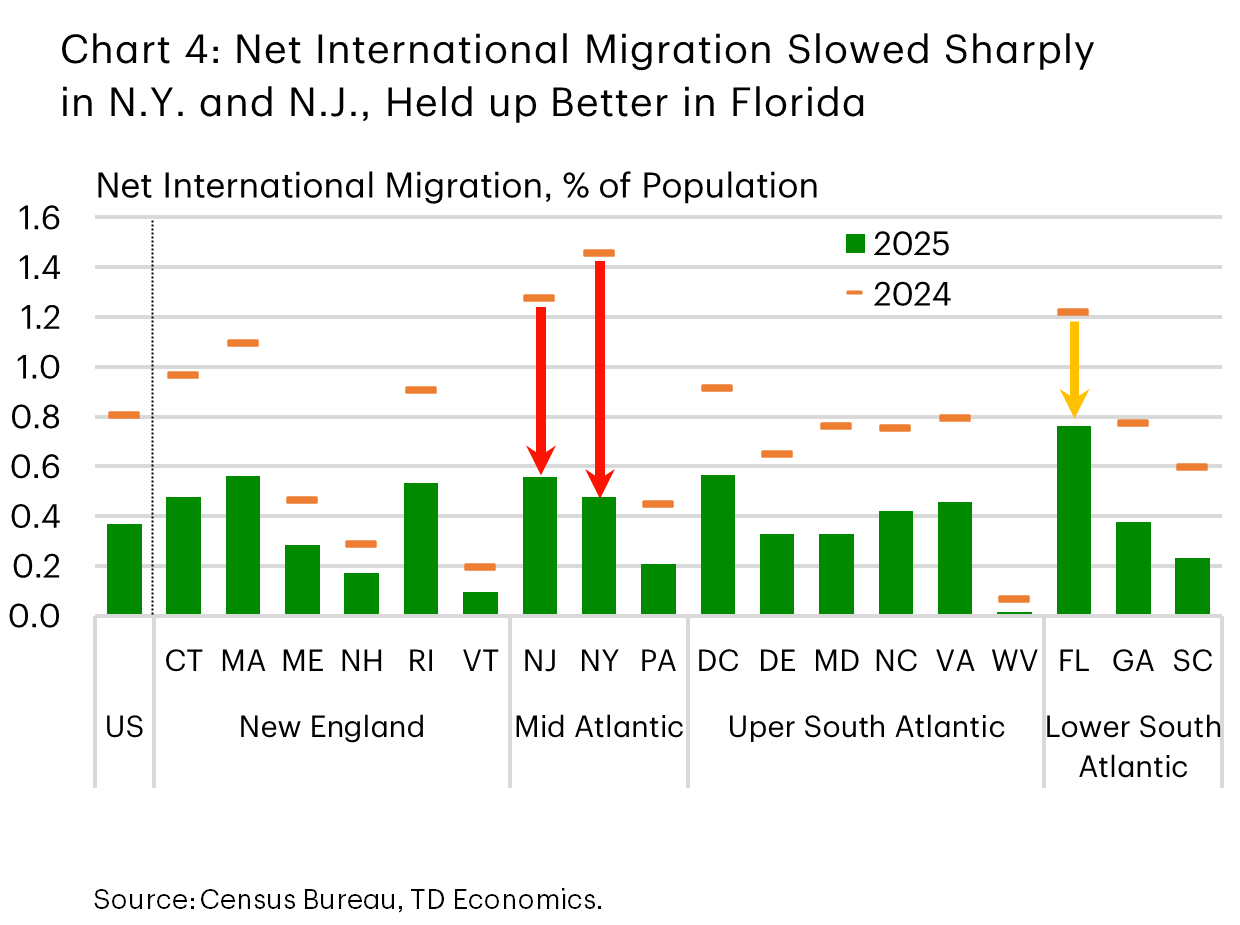
The Mid‑Atlantic region experienced a pronounced slowdown, with especially large immigration declines in New Jersey and New York. Net international migration in New York fell to just under 100,000, roughly one‑third of its 2024 tally. Maryland (‑57% y/y) and South Carolina (‑61% y/y) also recorded sizable pullbacks. In contrast, international migration proved more resilient in Florida, where net inflows declined by a smaller 37% to a still‑solid 180,000 (Chart 4).
Domestic Migration Flows Make the Difference
Domestic migration was the second most important determinant of population growth outcomes at the regional level, behind immigration, while natural increase (births minus deaths) continued to play a relatively minor and stable role (refer back to Chart 3). The East Coast continues to exhibit a clear and longstanding dichotomy when it comes to domestic migration, with the Northeast generally continuing to lose residents to other parts of the country and the Southeast generally absorbing residents from elsewhere. That said, even Southeast states are attracting fewer domestic migrants than in recent years.
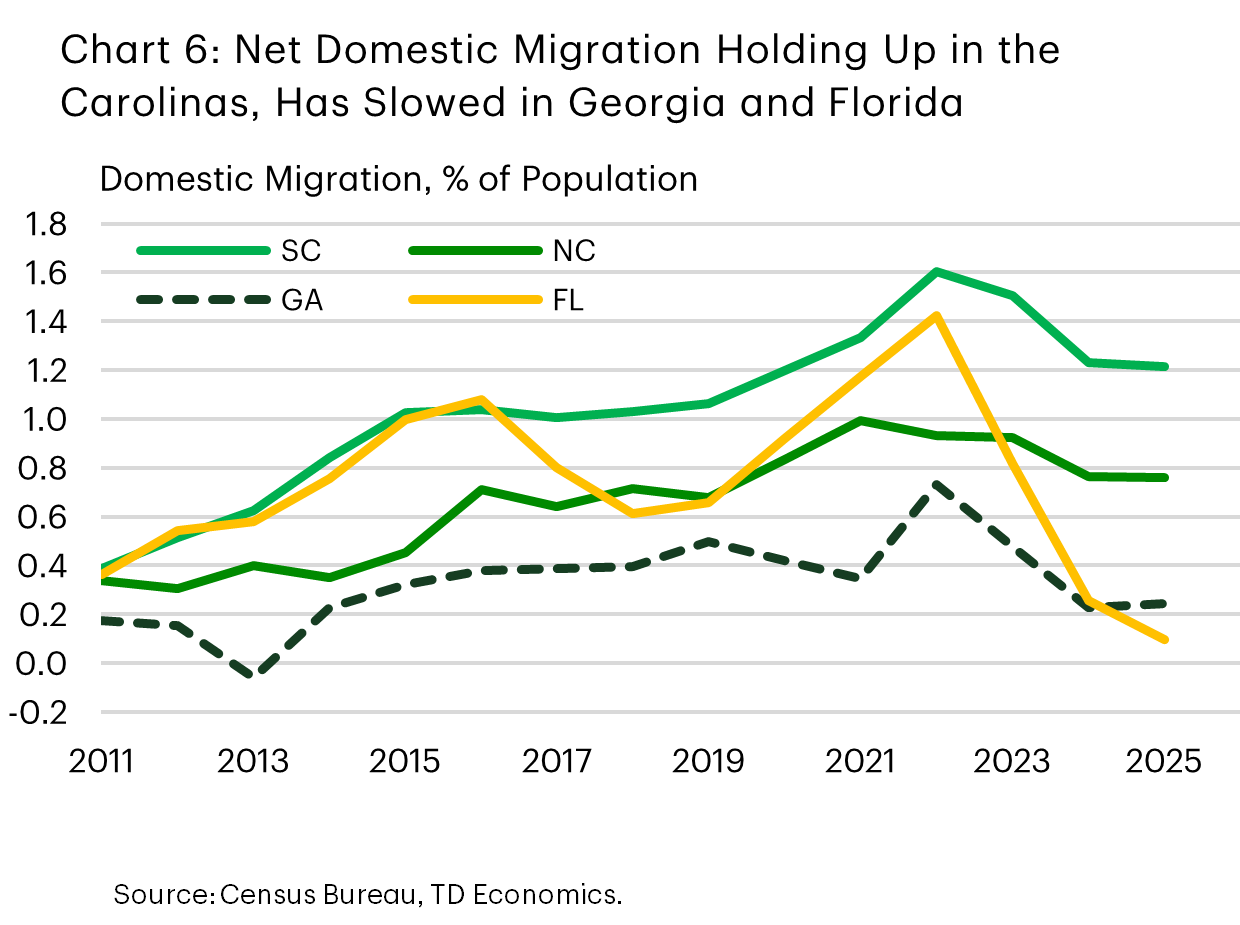
Florida’s experience is particularly telling. After years of strong inflows, net domestic migration slowed to just over 22,000 in 2025, a fraction of recent peaks (Chart 5). This reflects, in part, post‑pandemic normalization and rising living costs. A similar pattern is evident in Georgia, where net domestic inflows have averaged just over 25,000 over the past two years – well below pandemic highs and roughly half of pre‑pandemic levels. South Carolina and North Carolina stood out as relative bright spots, posting gains of 67,000 and 84,000, respectively, broadly in line with the prior year (Chart 6).
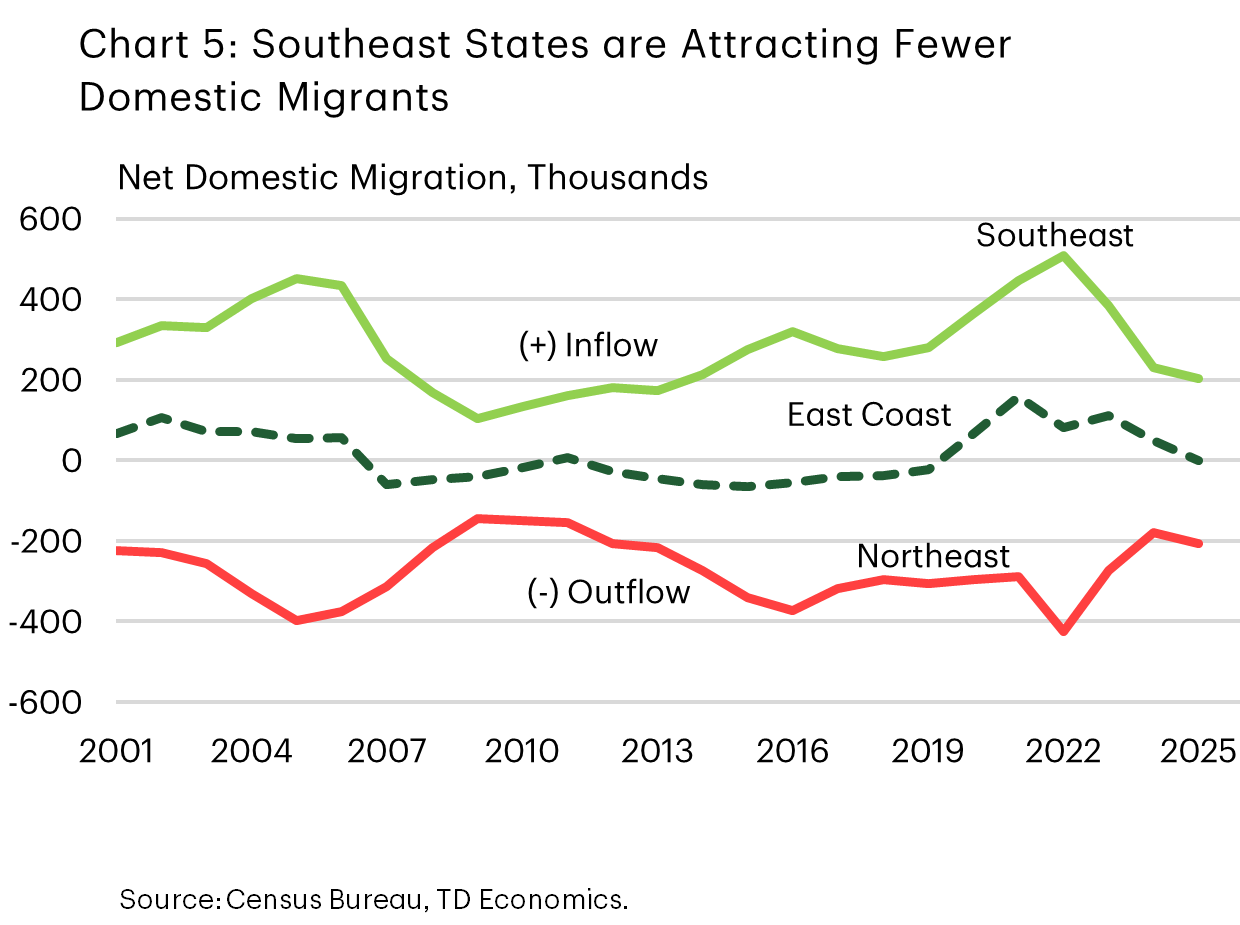
Conversely, the Northeast remains in a state of chronic domestic out-migration. With the exception of Maine and New Hampshire – where exceptionally tight labor markets continue to help attract migrants – all remaining states recorded net domestic outflows. In New York, domestic losses had moderated in recent years, easing to 120,000 in 2024 from roughly 300,000 per year during 2021–22. However, that improvement did not hold in 2025, with outflows worsening slightly to nearly 140,000, equivalent to a loss of about 375 residents per day. Massachusetts and New Jersey also continued to post elevated net domestic outflows of roughly 90 to 100 residents per day respectively. In prior years, these losses were largely offset by strong international immigration. In 2025, however, that buffer narrowed significantly – setting the stage for an even weaker showing this year as immigration slows further.
Population gains to slow further this year
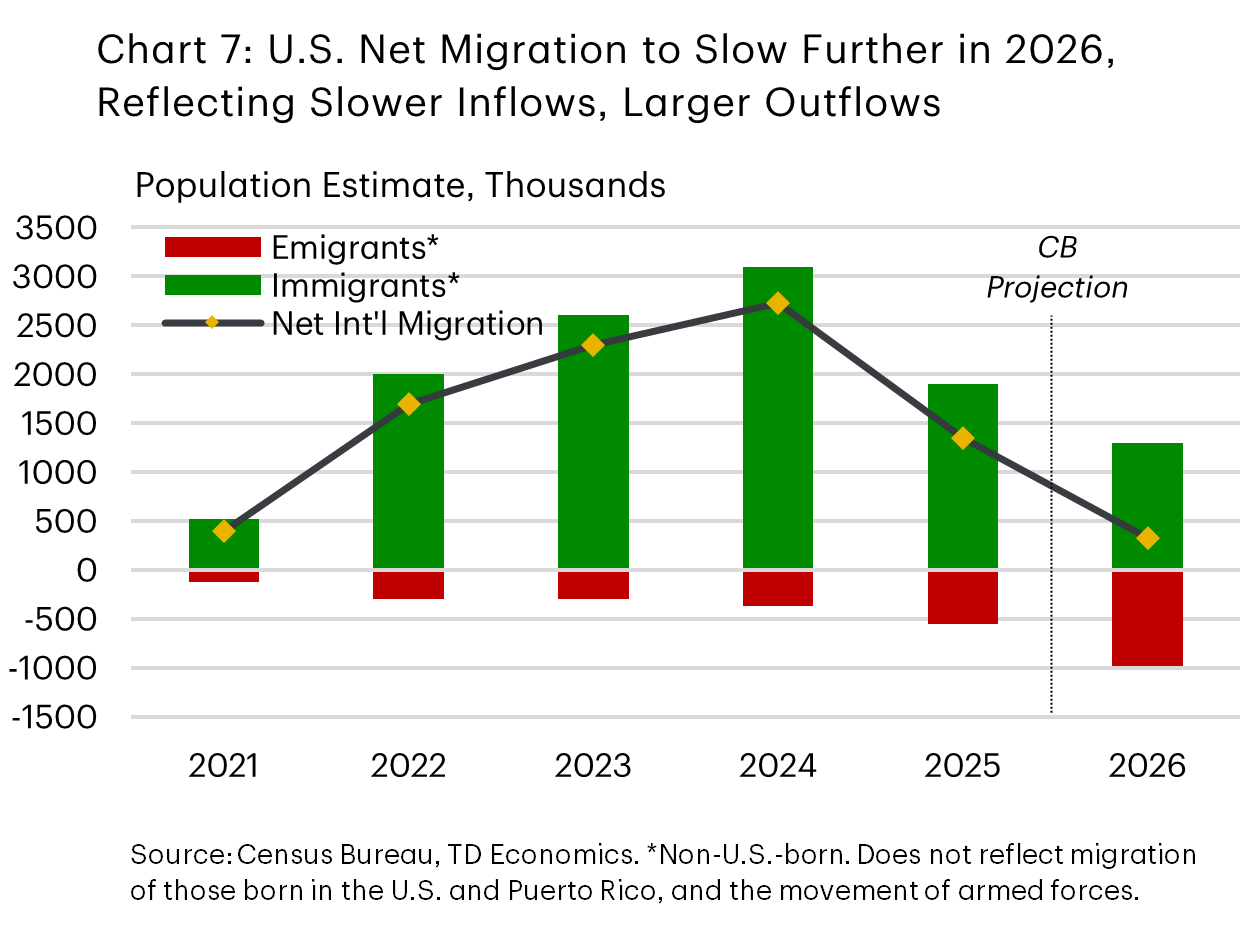
Population growth is expected to decelerate further this year as net international migration declines again. Importantly, population figures are measured at an annual midpoint, with the latest observation corresponding to July 2025, rather than a full year average. There are clear indications that tighter immigration policy since mid-2025 has reduced inflows, while outflows (emigration) have also increased somewhat. Assuming current trends persist, the Census Bureau projects net migration of non-U.S. born individuals to fall to 320,000 in 2026 (Chart 7). While the tallies in Chart 7 exclude some smaller categories – such as the movement of U.S. born individuals and armed forces – these are broadly consistent with overall net international migration trends.
With the above in mind, we estimate that a slowdown in net international migration in a range of 320,000 to 500,000 – the latter being our current base-case scenario – will lead to a further cooling in U.S. population growth to respectively 0.2% and 0.3% this year. This would mark a continued and notable softening from 1.0% and 0.5% in the two years prior. Applying our base-case immigration projection at the state level, while keeping the other components stable, suggests that instead of only three East Coast states recording zero or negative population growth last year, that number will more than double to seven.3 The primary risk to this projection lies with domestic migration, which can be more volatile and tends to have a larger impact than the natural increase in population. But, while domestic migration remains a source of uncertainty, the sheer scale of the immigration drawdown makes an East Coast population growth slowdown rather inevitable.
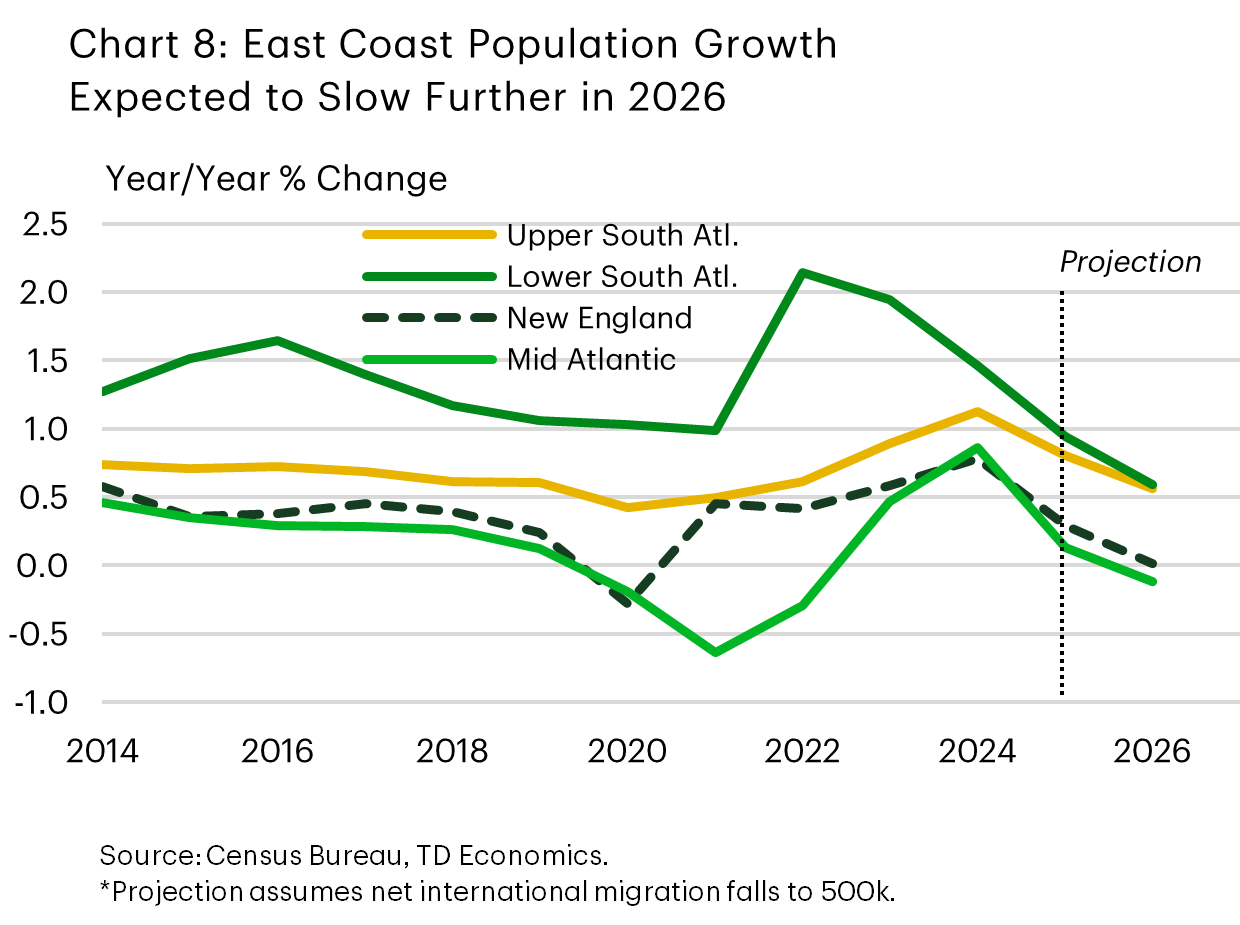
Population declines are most likely to emerge in the Northeast. New York and Vermont are expected to lead the pullback, with Massachusetts also having the potential to post a modest decline as reduced net international migration is no longer able to mask persistent domestic outflows. Given the size of some of these states, population growth in the Mid-Atlantic is likely to tip into shallow negative territory this year, while New England will likely come at a standstill (Chart 8). Additionally, Pennsylvania and Rhode Island are expected to slow to a crawl.
By contrast, the Southeast should remain on relatively firmer footing. Aside from potential stagnation in D.C. and continued mild declines in West Virginia, population growth in the Upper and Lower South Atlantic is likely to slow but converge to a still decent 0.5–0.6% in 2026 – keeping an edge over the nation. South Carolina’s lower reliance on international migration suggests it will be less affected by declining immigration inflows, with the state likely to remain at the top of the regional leaderboard on population growth this year. Florida, however, appears somewhat more vulnerable given its heavier reliance on immigration, with its long standing population outperformance likely to fade as population growth converges near the national pace this year. Downside risks remain, particularly if domestic inflows to the Southeast were to soften further from last year’s level.
Conclusion
U.S. East Coast population growth has clearly lost momentum. This reflects a sharp slowdown in net international migration, coupled with persistent domestic outflows across much of the Northeast, and reduced domestic inflows in parts of the Southeast – with Florida a prime example.
Population gains are expected to slow further this year amid a tighter immigration policy backdrop. As a result, a growing share of the region is likely to face stagnation or outright population declines. While domestic migration patterns remain a key source of uncertainty, the projected pullback in international migration points to a meaningful expansion in the number of East Coast states recording zero or negative population growth – likely more than doubling from three in 2025 to seven this year. These pressures are expected to be more pronounced in the slower growing Northeast, where reduced immigration is increasingly unable to offset ongoing domestic outflows.
End Notes
- The East Coast region we cover in this report is made up of eighteen entities: Seventeen states from Maine to Florida, plus the District of Columbia (D.C.). For simplicity, these eighteen entities may all be referred to as ‘states’.
- Note that ‘net international migration’ considers both international inflows into the U.S. (i.e., immigration) and the U.S. population outflow to other countries (i.e., emigration). Since immigration tends to be the dominant factor, and emigration is typically much smaller, the term ‘immigration’ may be used for simplicity.
- Under the more aggressive slowdown projected by the Census Bureau, the number of states facing stagnation or recording a decline in population this year would likely rise to nine, encompassing half of the East Coast region.
Disclaimer
This report is provided by TD Economics. It is for informational and educational purposes only as of the date of writing, and may not be appropriate for other purposes. The views and opinions expressed may change at any time based on market or other conditions and may not come to pass. This material is not intended to be relied upon as investment advice or recommendations, does not constitute a solicitation to buy or sell securities and should not be considered specific legal, investment or tax advice. The report does not provide material information about the business and affairs of TD Bank Group and the members of TD Economics are not spokespersons for TD Bank Group with respect to its business and affairs. The information contained in this report has been drawn from sources believed to be reliable, but is not guaranteed to be accurate or complete. This report contains economic analysis and views, including about future economic and financial markets performance. These are based on certain assumptions and other factors, and are subject to inherent risks and uncertainties. The actual outcome may be materially different. The Toronto-Dominion Bank and its affiliates and related entities that comprise the TD Bank Group are not liable for any errors or omissions in the information, analysis or views contained in this report, or for any loss or damage suffered.
Download
Share: