U.S. East Coast Office CRE Recovery:
Running at Different Speeds
Date Published: December 8, 2025
- Category:
- US
- Real Estate
- State Local & Analysis
Highlights
- The recovery of East Coast office commercial real estate (CRE) is uneven. Miami and Tampa are ahead, though recent signs of softening have appeared.
- New York and Charlotte have made progress. In New York, office space absorption is up, driven by return-to-office trends. Charlotte’s gains reflect robust employment growth.
- D.C. and Boston continue to struggle. High vacancies and weak demand persist. Boston’s elevated pipeline will likely delay recovery, with its vacancy rate set to climb higher in the near term.
- Miami’s construction pipeline is also elevated, but much of the new supply is pre-leased, limiting risk.
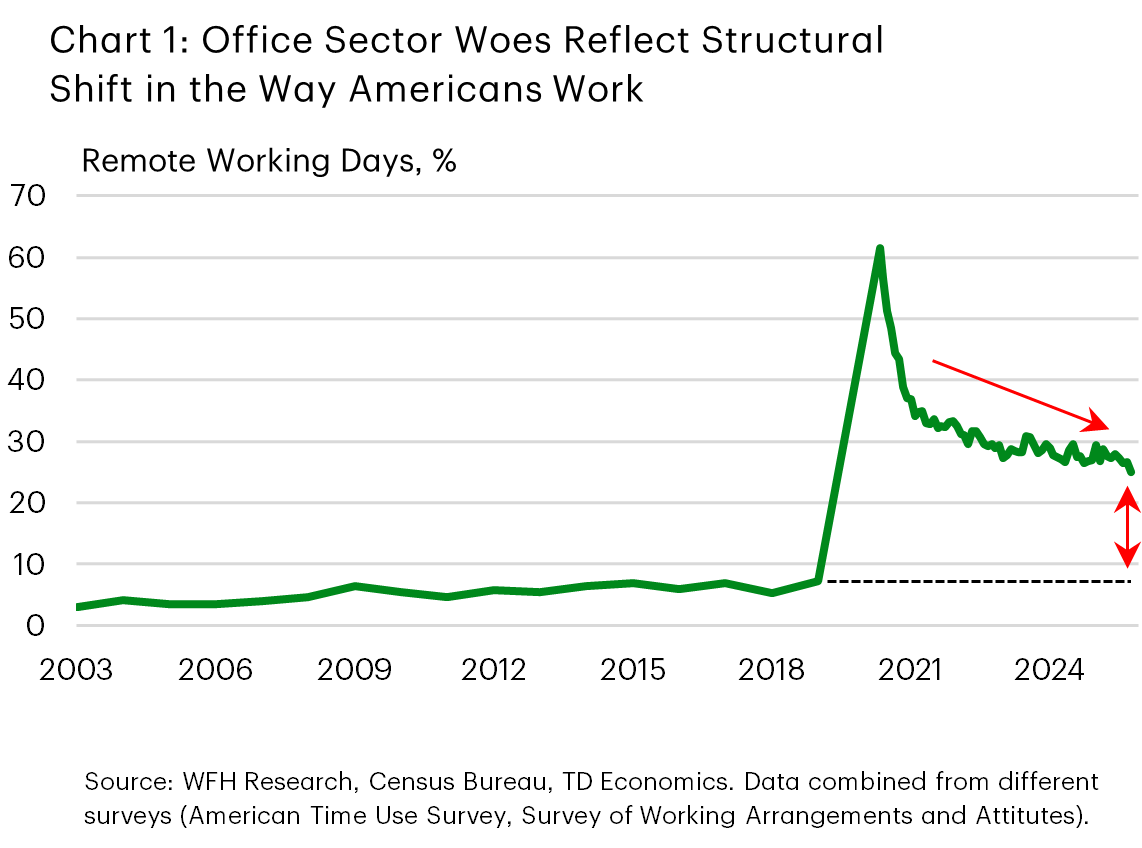
The office sector remains the hardest-hit part of commercial real estate. Its vacancy rate, near 14%, is the highest among asset classes. The fallout extends to debt markets. The delinquency rate for office CMBS has risen sixfold since before the pandemic. Still, market fundamentals show early green shoots. Office space absorption has improved slightly, and slower deliveries of new office space have helped the vacancy rate plateau. Price momentum is on the cusp of showing firmness for the first time since 2022. Renewed return-to-office efforts, especially among financial firms, hold some promise. Yet, despite these encouraging signs, we see no quick resolution in sight. The sector faces headwinds from the persistent structural shift in the way that Americans work. Remote and hybrid work arrangements still hold an expanded market share, though having eased recently (see Chart 1). Slower office-using employment growth is another near-term headwind.
Turning to East Coast markets reveals an uneven backdrop. Markets like Miami and Tampa are on relatively strong footing, while others like New York City and Charlotte have made some recent progress. At the same time, however, many large East Coast metros, including D.C. and Boston, continue to grapple with low demand and elevated office vacancies.
Modestly improving demand conditions and the slower delivery of new office should help curtail the amount of vacant space. However, metros with very elevated construction pipelines may experience a more delayed recovery. Two markets stand out on this front: Miami and Boston. Given that a large share of Miami’s upcoming supply is pre-leased, we expect any additional increase in its office vacancy rate to be limited. Softer demand conditions in Boston suggest this market will have a harder time absorbing the incoming office inventory. Its vacancy rate is likely to deteriorate further in the coming months.
Office Demand and Supply: A Slightly Better Balance
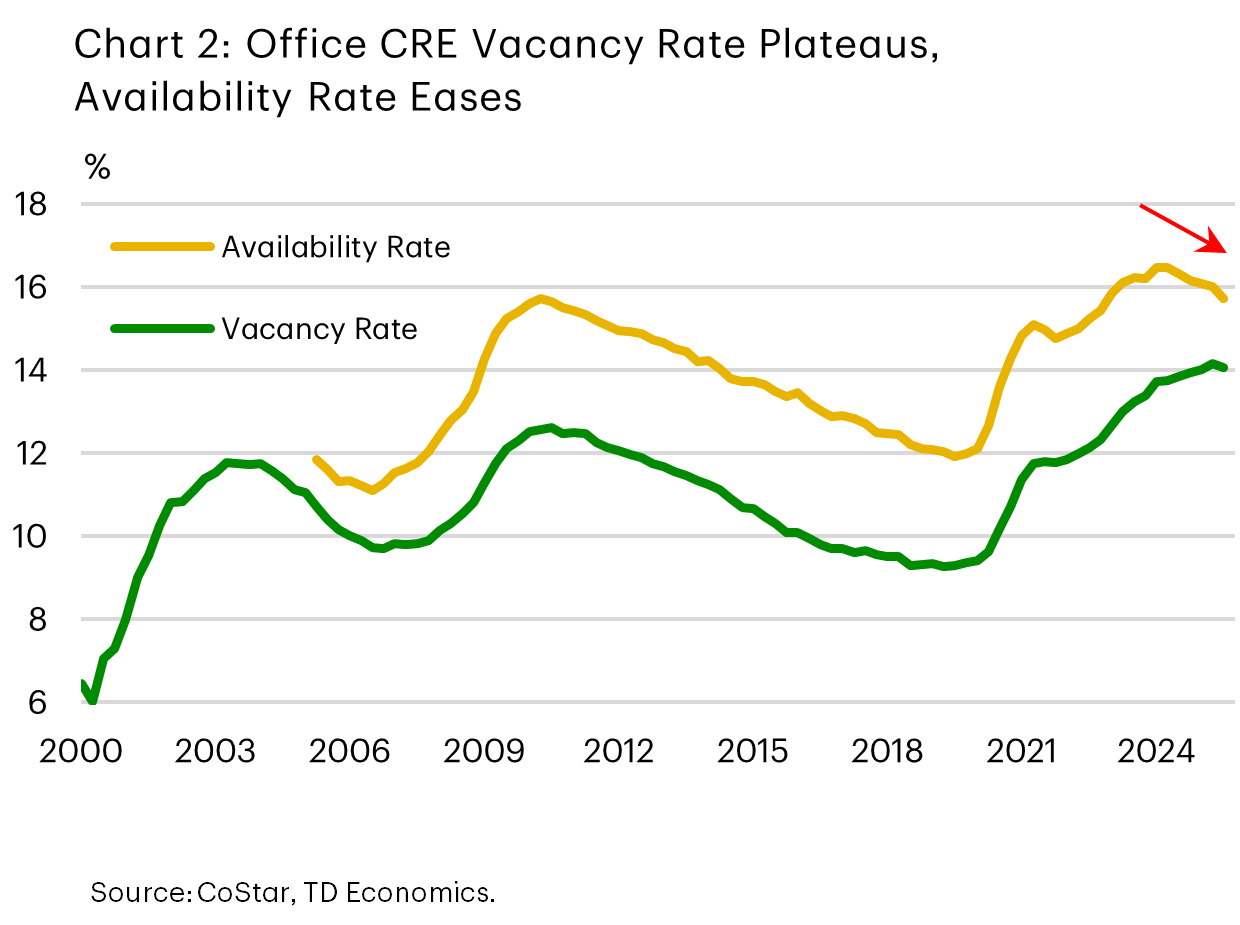
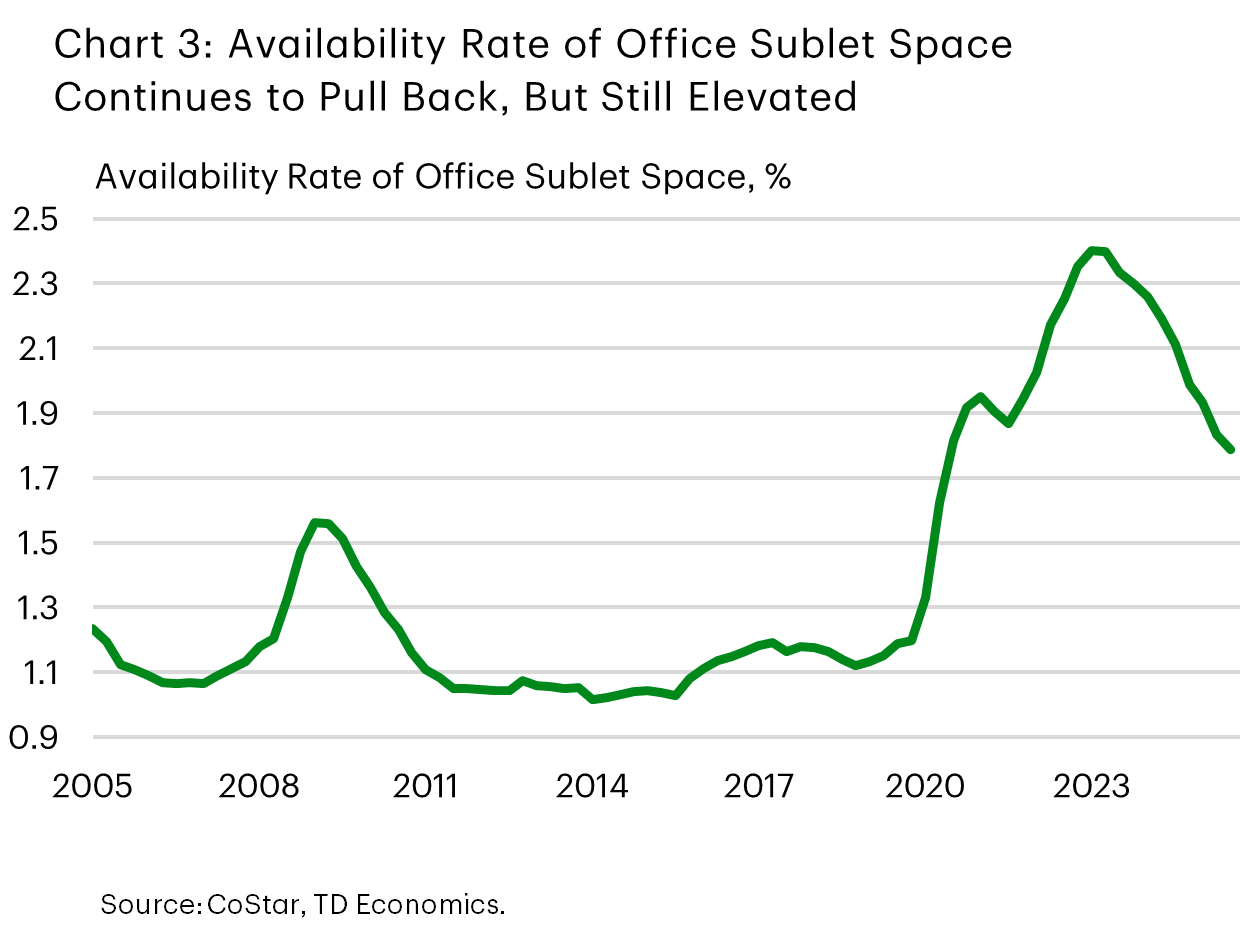
The recovery in office CRE continues to lag that of other sectors and is not yet widespread. Recent gains in office space absorption are concentrated in a handful of markets – mainly New York, followed by others like Miami, Charlotte, Houston and Dallas-Forth Worth. Leasing activity is edging higher but remains below pre-pandemic levels. Average lease sizes are still 15–20% below the pre-pandemic average, weighing on volumes. With these caveats in mind, the overall absorption of U.S. office space in the third quarter of 2025 appeared to signal a potential turning point. It turned meaningfully positive for the first time since late 2021, with the largest quarterly occupancy gain since mid-2019. Additionally, older buildings, which have underperformed in the post-pandemic period, also recorded occupancy gains for the first time since late 2018. The availability rate – a broad measure that includes any space that is available for lease regardless of whether it is vacant, occupied, available for sublease, or available at a future date – has trended down, reflecting in part the absorption of sublease space (Chart 2 and 3).
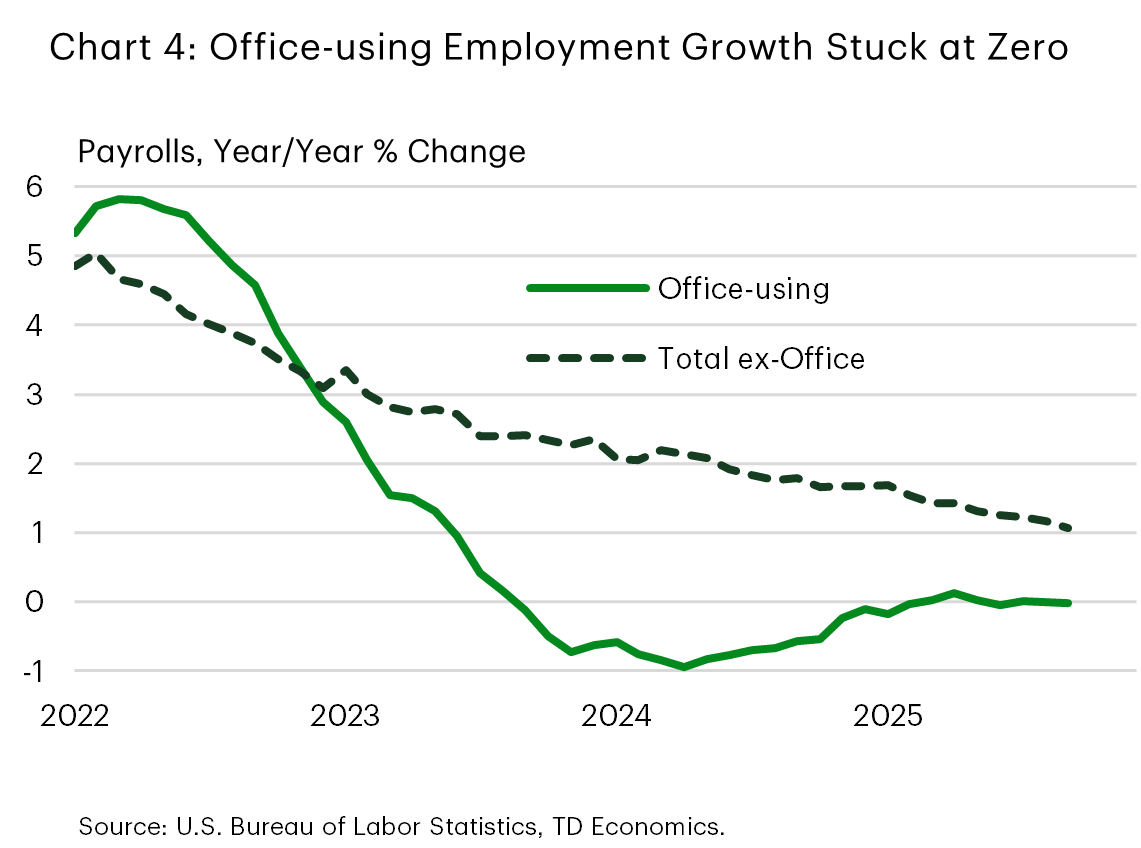
Recent progress can be partially attributed to return-to-office efforts. In October, the share of remote working days among Americans fell to just below 25% – the lowest reading in the post-pandemic period and down three percentage points from earlier this summer (refer back to Chart 1). This trend appears to be overriding a notable slowdown in office-using employment growth, with sectoral payrolls effectively stuck at mid-2024 levels (Chart 4). These trends are not mutually exclusive. A slower hiring pace shifts bargaining power to employers. The latter favor more in-office days than workers, and plan to tilt further toward in-office days in the year ahead (see here). The adoption of AI may also be contributing to slower gains in office-using jobs, with employers citing AI as a reason for close to 55,000 job cuts so far this year.
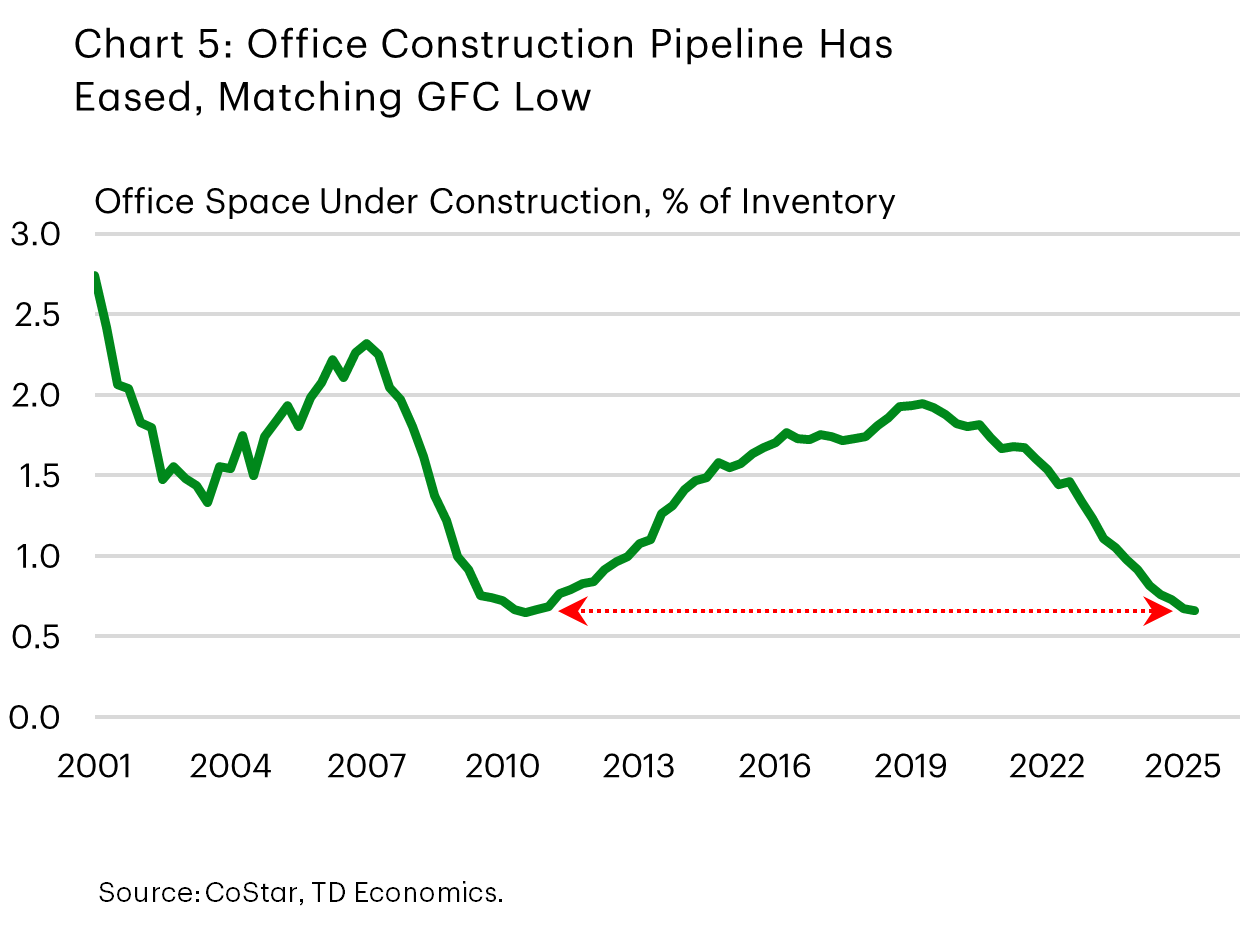
A slowing construction pipeline has helped hold back a further rise in the national office vacancy rate. Builders are taking on fewer new projects. Many are delaying existing projects, especially larger ones. According to CoStar, the typical construction timeline is up 50% from the 10–12 months common a decade ago, with most of the increase coming after the pandemic. Less new office space is hitting the market – a trend set to continue as the pipeline shrinks (Chart 5). A slower pace of new inventory should help support the backfilling of existing properties, potentially offering some support for older buildings or those not in prime locations.
Office Vacancy Rate May Have Peaked, But Any Progress Will Be Slow
We anticipate that office-using employment growth should find better footing later next year, alongside an expected strengthening in overall U.S. hiring. Rising employment, coupled with a further tilt toward in-office workdays should set the stage for incremental improvement in demand. With fewer new office projects coming to market, the vacancy rate is expected to remain stable and should decline modestly over the medium term, likely staying in the 13.5-13.9% range for the foreseeable future.
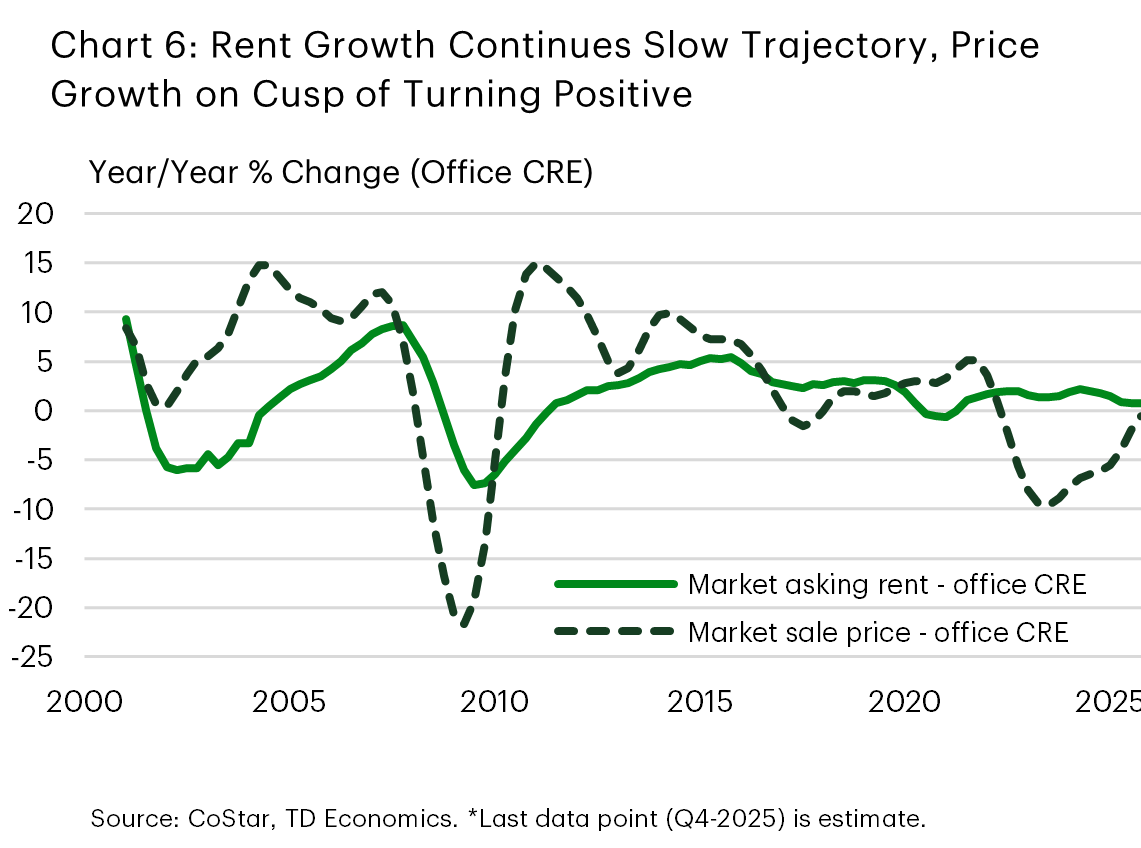
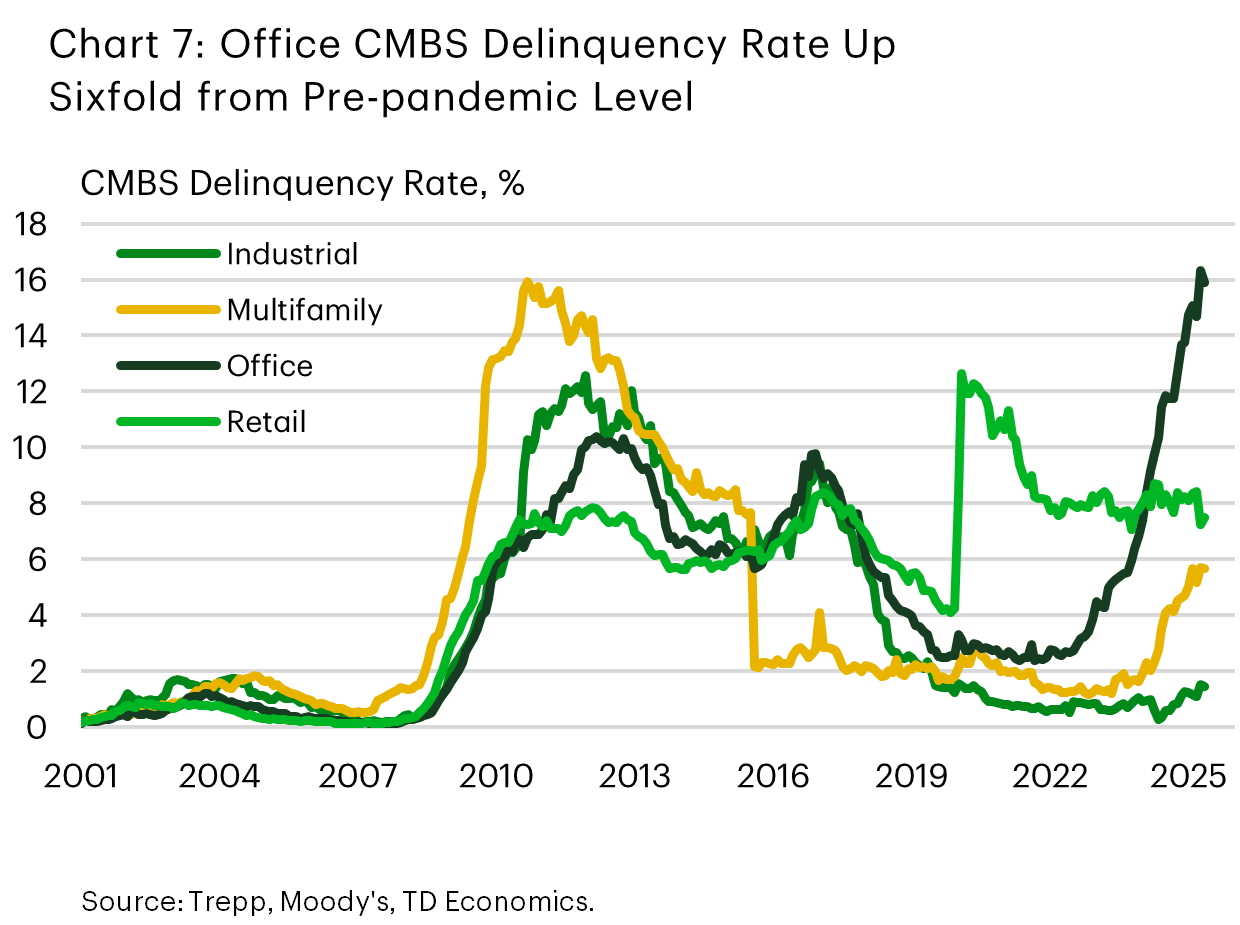
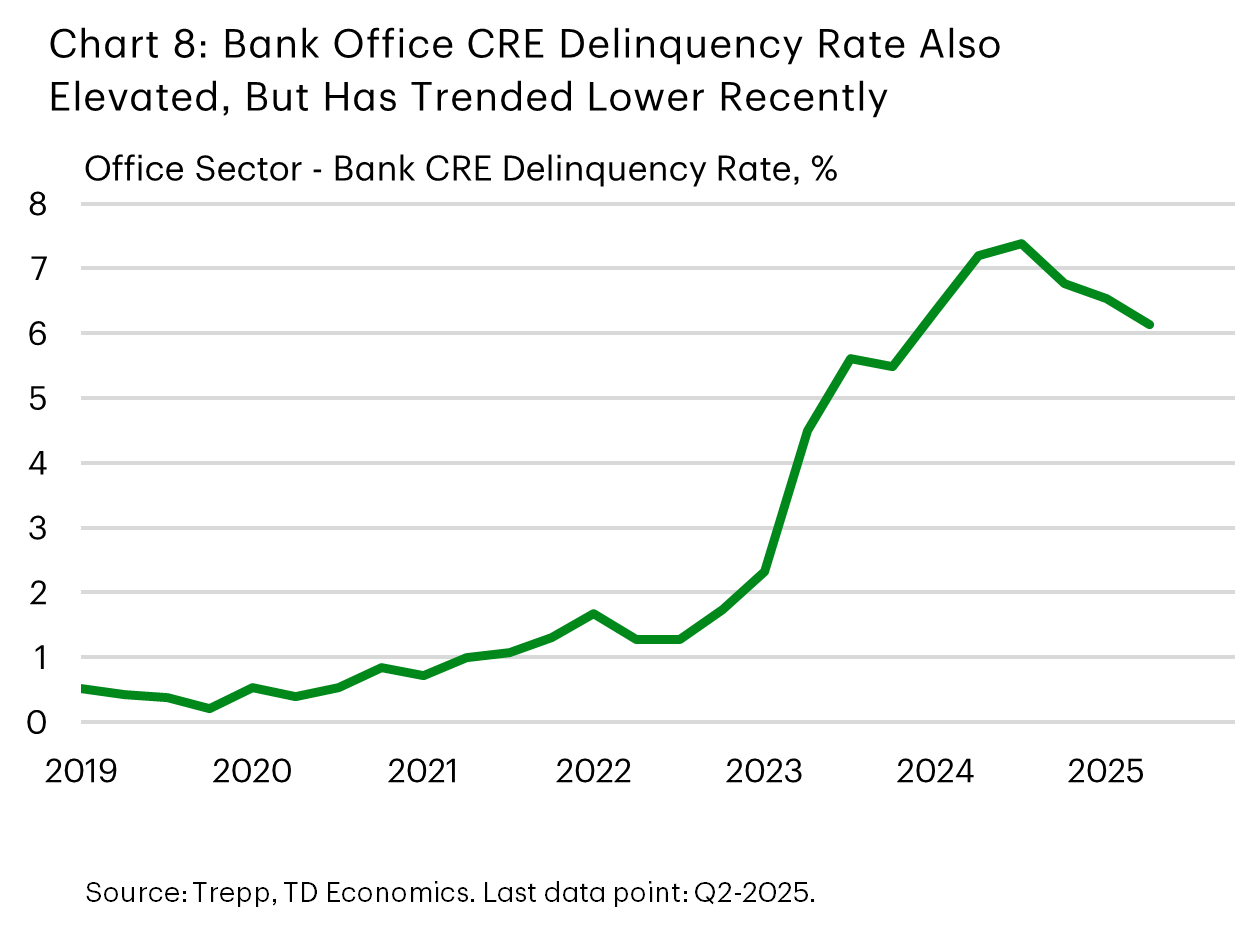
The slight firming of conditions should lend a hand to rents, whose performance continues to lag that of other CRE sectors. Price growth, more volatile than rent growth, is on the cusp of entering positive territory and should also get some support (Chart 6). An additional easing in the Fed policy rate is also expected to help. Still, developments in the office debt space will bear careful watching. As we pointed out in a report last year, debt maturity risks linger CRE, especially in the office segment. The office CMBS delinquency rate has continued to rise and is near its all-time high of 16.3% set in September. The rate is up sharply from 2.5% before the pandemic (Chart 7). CMBS makes up only a small portion of office CRE debt, but timely stats in this space help provide a quick read on recent trends. The delinquency rate of office loans held by banks was much lower as of mid-2025, near 6%.1 This rate is down from its recent peak but still stands well above its pre-pandemic average of 0.4% (Chart 8). With the tough office market backdrop now in its fifth year, as some eased lender conditions and extensions expire, there is potential for losses to be realized. This could add a further headwind to the expected recovery in office prices.
East Coast Office CRE Recovery Remains Uneven
Faring worse: D.C., Boston
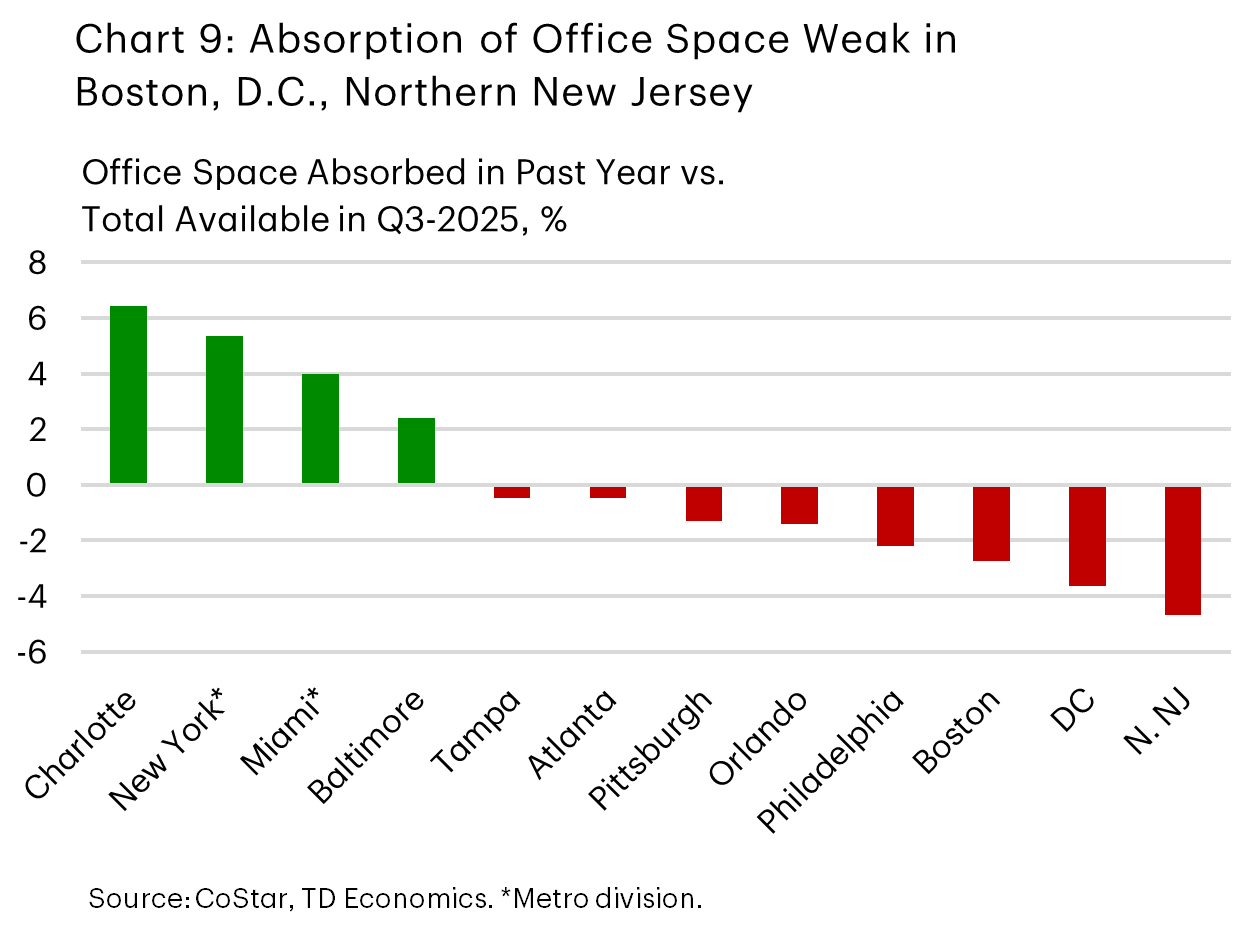
Close to one fifth of office space in D.C. and Boston was available for lease in the third quarter of 2025 – the highest share across the 12 major metros examined in this report (Table 1). Meanwhile, the absorption of office space is among the worst in the group (Chart 9). Weak absorption stems from negative office-using employment growth and little progress in the return-to-office movement. Both D.C. and Boston lag the national average on these fronts. D.C.’s difficulties are partly tied to the federal government sector, which plays a key role in office leasing. Federal government employment makes up 10% of non-farm payrolls in D.C. – more than five times the national average. Incorporating the recent hiring weakness of this sector alongside general office-using employment points to an even weaker demand backdrop. Cost-cutting measures that have the potential to result in the further headcount reduction and space consolidation present additional downside risk. In Boston, the life sciences sector, once a strong anchor, has failed to provide meaningful support in recent quarters. Weaker demand in Boston is running up against a slew of new inventory that has hit the market, causing its vacancy rate to reach new all-time highs. An elevated supply pipeline, second only to Miami, carries additional risk. While remote work could dissipate and lend some support to demand, we anticipate elevated deliveries to remain the driving force in the quarters ahead. As a result, Boston’s vacancy rate is likely to climb further in the near term. The delayed recovery will add pressure to distressed assets, increasing the likelihood of repricing among less-desired properties.
Making Good Strides: New York, Charlotte
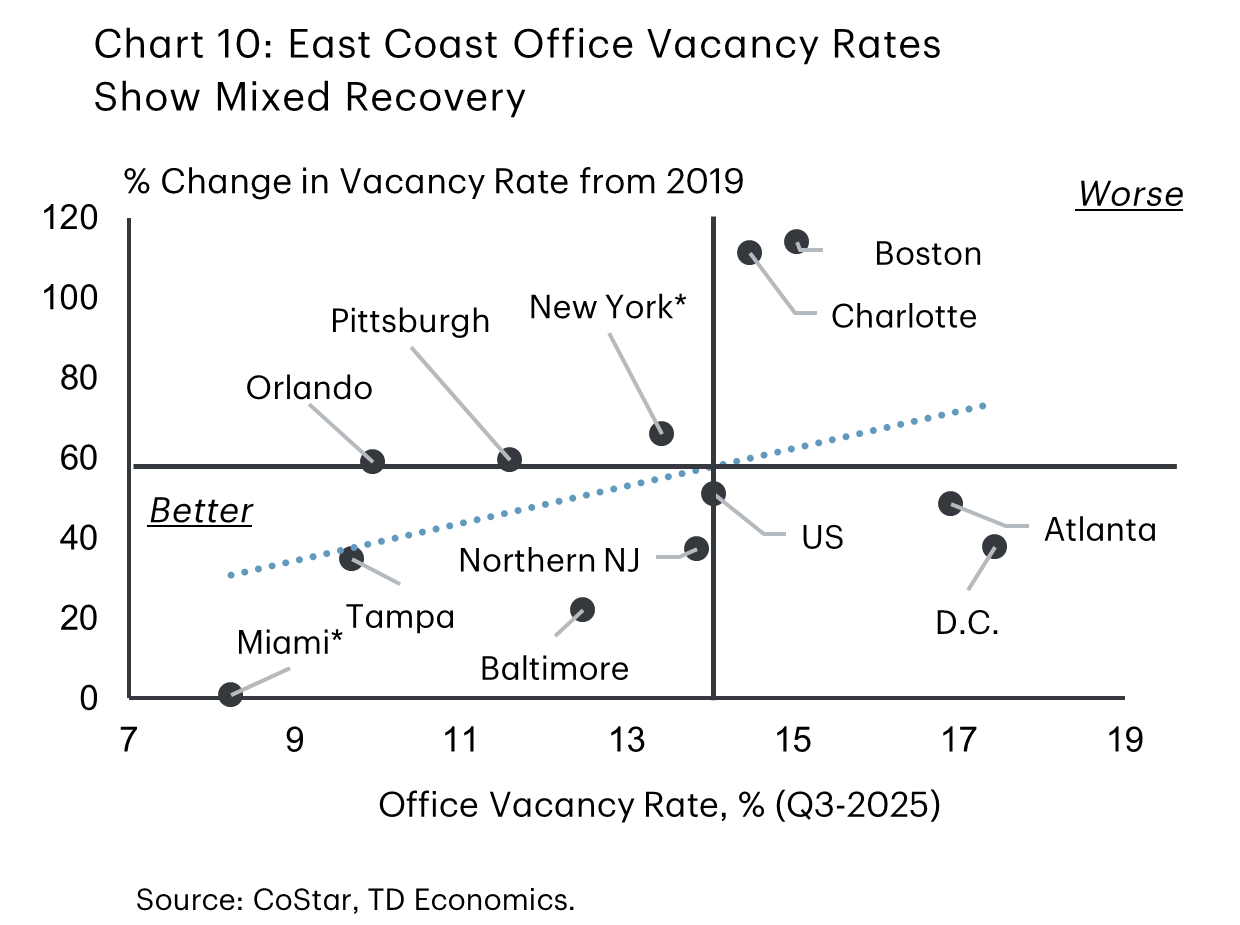
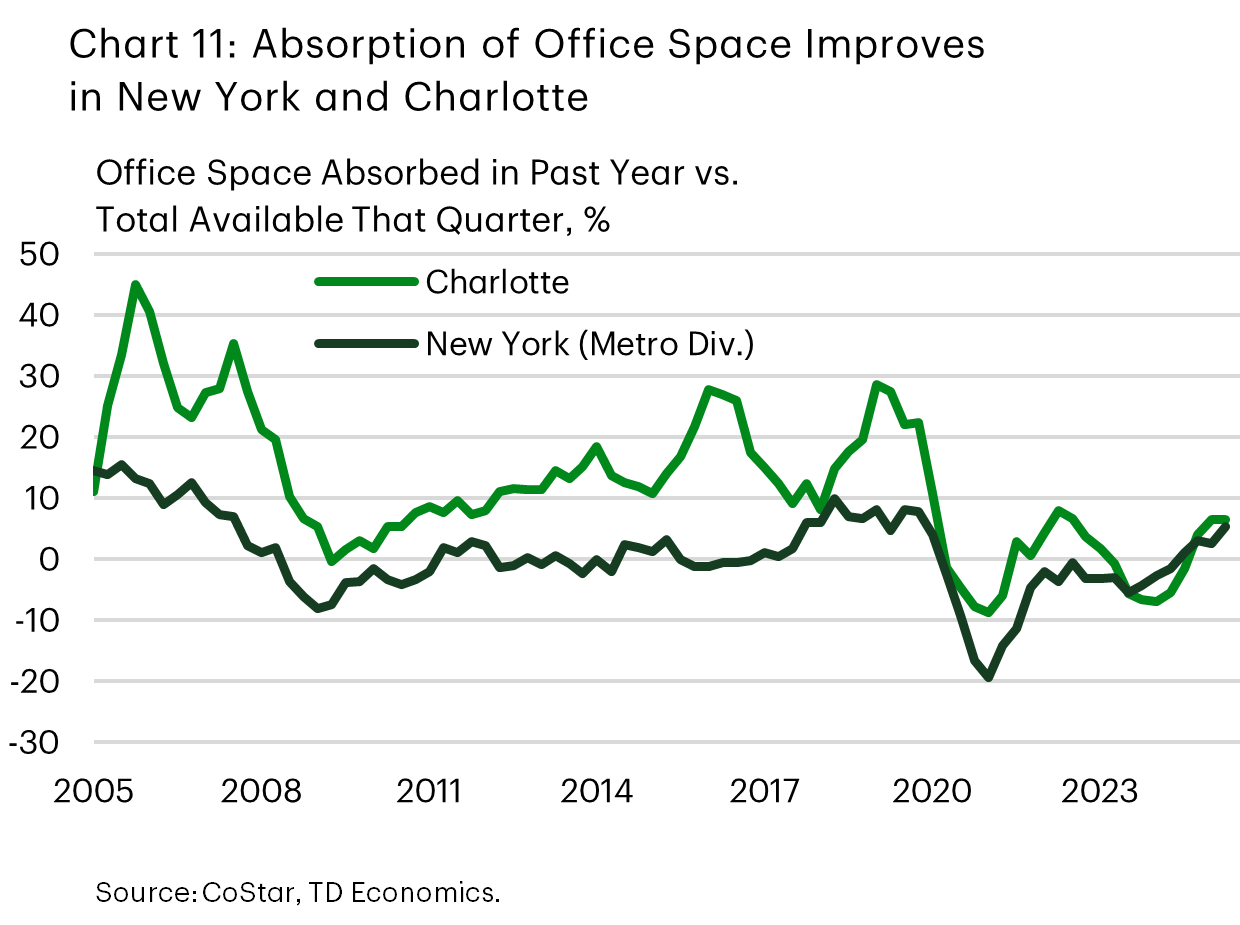
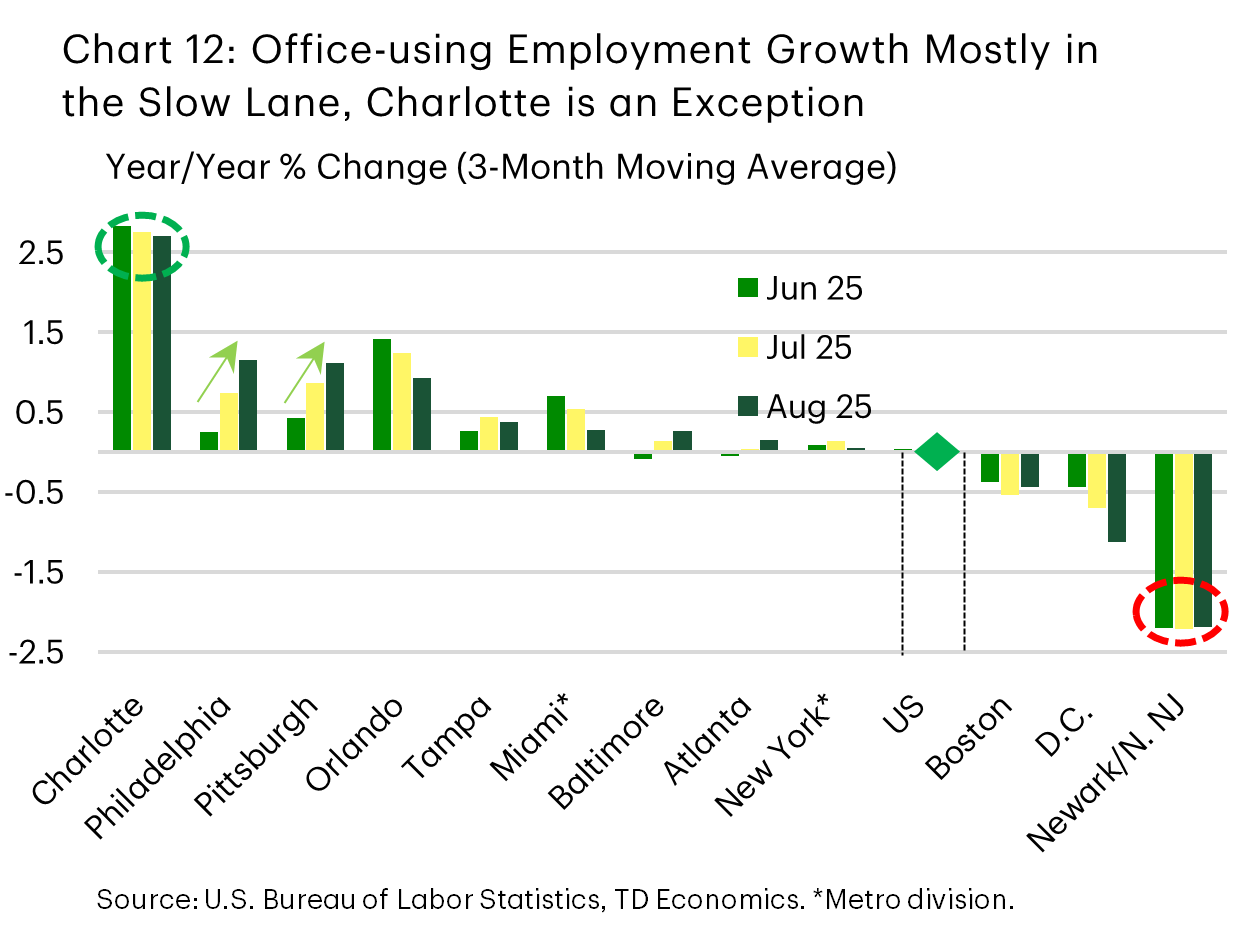
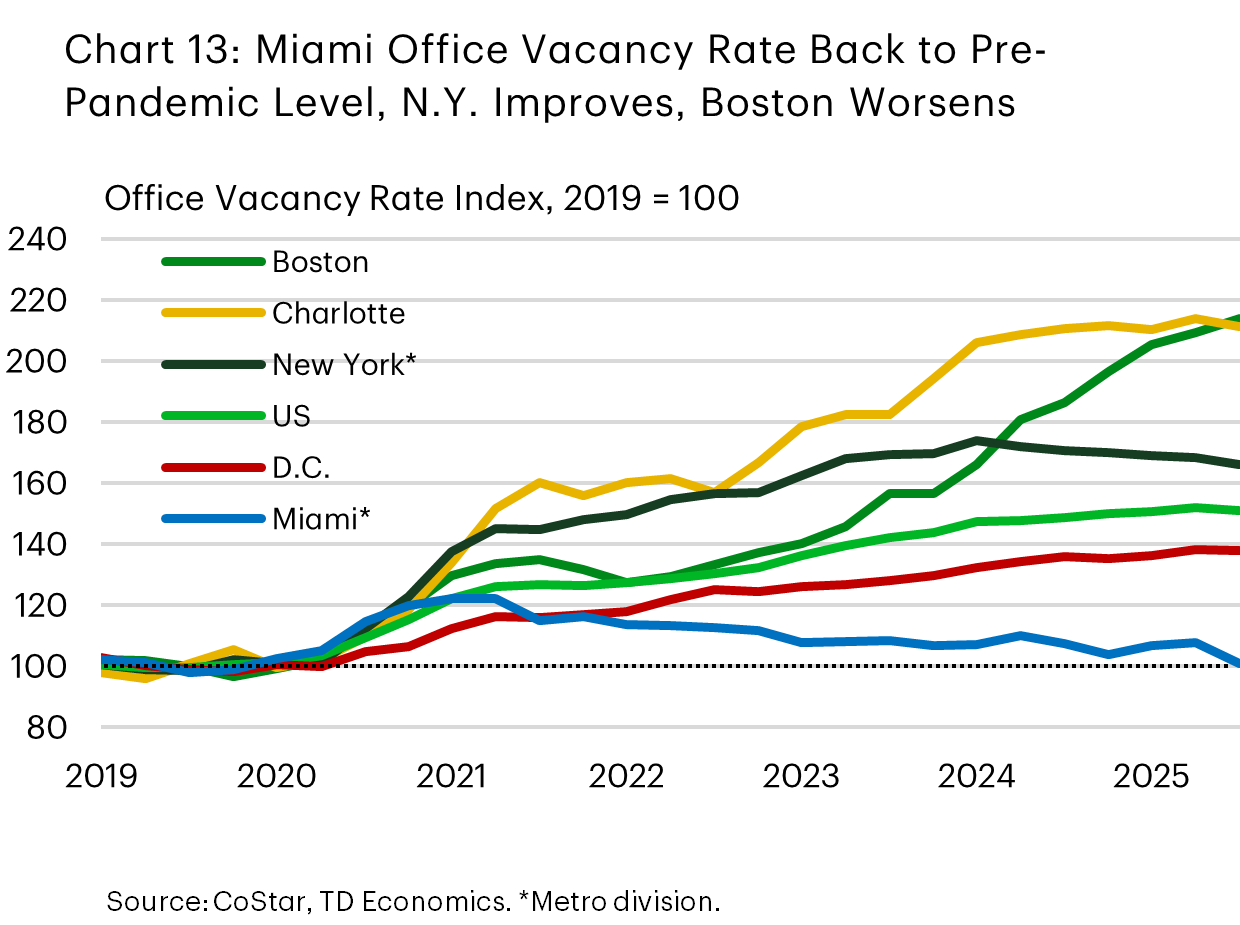
The office vacancy rates of New York and Charlotte are not far off the national average. But both are much higher compared to their pre-pandemic levels, with Charlotte’s rate up more than double and New York’s up by two thirds (Chart 10). Still, the most striking development in these two markets is the meaningful progress they’ve recorded recently. The amount of absorbed office space over the past year has made a clear U-turn in both markets (Chart 11). The driving factors differ. Charlotte is seeing the largest gains in office-using employment growth of any East Coast metro in this report (Chart 12). New York’s office-using employment growth is near zero, but the region has enjoyed a stronger recovery in the return-to-office movement. Strong deliveries of new office space have masked progress in Charlotte, where the vacancy rate remains elevated. Improvement is more visible in New York (Chart 13), where slower deliveries and office-to-apartment conversions have allowed for a more rapid drawdown of vacant inventory (for more on office-to-apartment conversions, see our previous report here). Still, it’s worth noting that concessions and discounts also remain a popular tool in supporting leasing activity in the Big Apple, with rent discounts reportedly in the upper single digits.
Strengthened demand positions will eventually trickle down to rent and price growth, both of which are still on the softer end relative to many other metros considered in this report (Table 1). The fact that Charlotte’s and New York’s construction pipelines have been curtailed substantially and are now running broadly in line with the national average, will also lend a hand in this regard.
Faring Much Better: Miami, Tampa
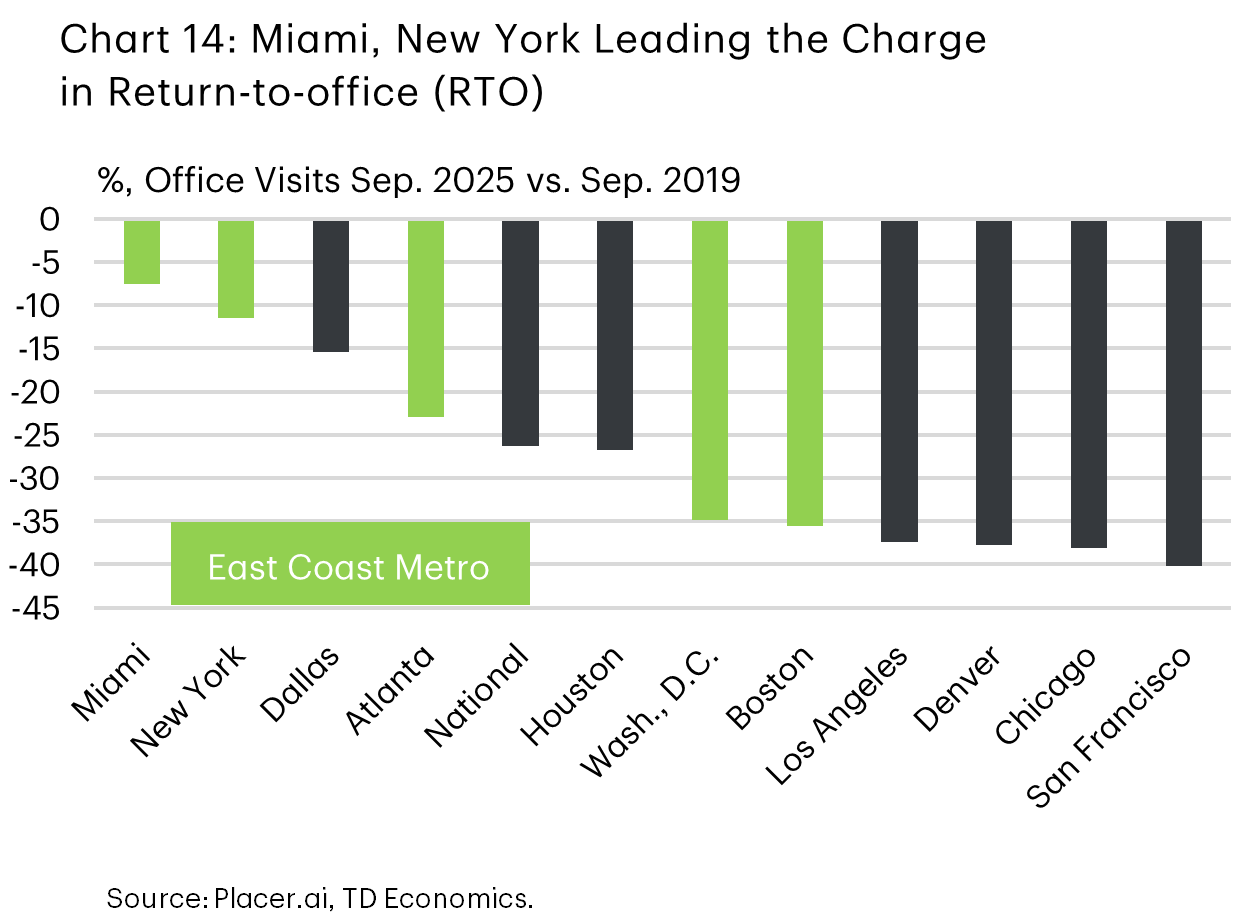
The Miami core and Tampa are two of the better-performing office markets in the region. Their vacancy rates are not only below the national level but also show below-average increases relative to pre-pandemic levels. Both markets benefited from an influx of workers and businesses during the pandemic, which supported office space absorption and slowed the increase in vacancy rates. At its worst, Miami’s vacancy rate in 2021 was up only 20% from its 2019 level. Miami is currently the only market in the group to record a full recovery. Its success also reflects a deeper rebound in the return-to-office trend (Chart 14). Tampa’s indicators are slightly softer but still show a much better performance compared to East Coast peers and the national average (Table 1). Of note, Tampa’s office availability rate is near its pre-pandemic level, and rent growth is moving at a pace of +3% – similar to Miami’s.
More recently though, some red flags have emerged. Over the past year, the absorption of office space has remained in negative territory in Tampa, reflecting a clear divergence across asset classes. Underperformance of low and mid-tier properties has overridden the strong trend in higher-end properties. Absorption has also slowed in Miami. Though still decent, it is running at about a third of its cyclical peak in mid-2022. These trends are tied to slow office-using employment growth, which has converged at a pace of sub-0.5% year-on-year in both markets. Population trends paint a similar picture. Domestic net migration has slowed to a crawl in Tampa, while Miami recorded stronger domestic out-migration last year (international migration remained positive for both). Tampa’s construction pipeline is lean, limiting absorption risks ahead. Miami’s is very elevated. Office space under construction in Miami makes up close to 2% of total inventory – almost triple the national average. This raises questions about the direction of its vacancy rate. The silver lining for Miami is that much of the new supply is concentrated in about half a dozen towers in the downtown core. This points to more muted supply pressures elsewhere in the metro division. More importantly though, most of the incoming inventory near the downtown core is reportedly pre-leased. Overall, there’s scope for Miami’s office vacancy rate to trek higher, but its upward path should be muted, especially as office-using employment growth eventually improves.
Bottom line
The U.S. office vacancy rate has stabilized at an elevated 14%, with recent improvements in office space absorption and a leaner construction pipeline offering cautious optimism. Yet, any recovery won’t be swift, given that the office sector remains challenged by persistent structural shifts in the way Americans work.
Along the East Coast, the office CRE landscape reflects the pandemic’s deep and lasting impact, but the sector’s recovery is running at different speeds across markets. Miami and Tampa have been faring better. New York and Charlotte have shown meaningful progress recently – the former due to more workers returning to the office and the latter due to sheer strength in office-using employment growth. In contrast, D.C. and Boston continue to struggle with high vacancies and weak demand. Boston’s elevated construction pipeline will present additional challenges, with its vacancy rate likely to climb higher before showing signs of improvement.
Table 1: East Coast Office CRE Performance is Uneven
Table 1 displays several important data points regarding office CRE market performance for the U.S. and 12 East Coast metros. The data is organized in five blocks: Vacancy rate, availability rate (including that of sublet space), office space under construction relative to inventory, rent growth, and sales price growth. The data is color-shaded such that weaker showings are in dark red, and better showing are in dark green. The metros are ranked using the second column, which shows the increase in the vacancy rate relative to the pre-pandemic level. The color shading helps reinforce strong vs. weak performance, with Miami and Tampa generally stronger, and markets like Boston and D.C. generally weaker.
| Large East Coast Office Markets | Vacancy Rate, % (Q3-25) |
** Ranked ** Vac. Rate Change (Q3-25 vs. 2019) |
Availability Rate, % (Q3-25) |
Avail. Rate Change (Q3-25 vs. 2019) |
Sublet - Availability Rate, % (Q3-25) |
Sublet - Avail. Rate Change (Q3-25 vs. 2019) |
Under Construction As a % of Total Inventory (Q3-25) | Market Asking Rent Growth (Q3-25, Y/Y % Chg.) |
Market Sale Price Growth (Q3-25, Y/Y % Chg.) |
| Boston | 15.1% | 113.8% | 18.9% | 88.8% | 3.1% | 150.6% | 1.4% | 0.7% | -4.7% |
| Charlotte | 14.5% | 111.1% | 14.3% | 50.7% | 2.1% | 197.8% | 0.6% | 0.9% | -0.3% |
| Washington | 17.4% | 37.8% | 19.6% | 21.3% | 1.6% | 26.7% | 0.2% | 1.3% | -4.6% |
| Atlanta | 16.9% | 48.4% | 17.6% | 24.7% | 1.9% | 107.8% | 0.4% | 1.2% | -3.0% |
| New York* | 13.4% | 66.1% | 13.9% | 23.9% | 2.0% | 15.5% | 0.7% | 0.1% | -4.2% |
| U.S. | 14.0% | 50.9% | 15.7% | 30.9% | 1.8% | 59.7% | 0.7% | 0.7% | -2.0% |
| Northern NJ | 13.8% | 37.3% | 15.4% | 19.4% | 1.6% | 8.4% | 0.0% | 1.1% | -0.3% |
| Orlando | 9.9% | 58.9% | 11.3% | 30.7% | 1.6% | 133.5% | 0.5% | 0.0% | -0.1% |
| Philadelphia | 10.9% | 36.6% | 14.2% | 27.0% | 2.0% | 94.8% | 0.8% | 0.1% | -0.9% |
| Pittsburgh | 11.6% | 59.5% | 13.4% | 38.1% | 0.8% | 25.2% | 0.4% | 1.0% | -6.3% |
| Baltimore | 12.5% | 21.9% | 13.4% | 15.1% | 1.2% | 92.9% | 0.1% | -0.2% | -1.4% |
| Tampa | 9.7% | 34.7% | 10.3% | 8.2% | 1.5% | 56.7% | 0.4% | 3.3% | 1.4% |
| Miami* | 8.2% | 0.8% | 10.5% | -3.4% | 0.9% | 5.8% | 1.9% | 3.2% | 3.2% |
End Notes
- Note that the series may not be directly comparable to the CMBS measure.
Disclaimer
This report is provided by TD Economics. It is for informational and educational purposes only as of the date of writing, and may not be appropriate for other purposes. The views and opinions expressed may change at any time based on market or other conditions and may not come to pass. This material is not intended to be relied upon as investment advice or recommendations, does not constitute a solicitation to buy or sell securities and should not be considered specific legal, investment or tax advice. The report does not provide material information about the business and affairs of TD Bank Group and the members of TD Economics are not spokespersons for TD Bank Group with respect to its business and affairs. The information contained in this report has been drawn from sources believed to be reliable, but is not guaranteed to be accurate or complete. This report contains economic analysis and views, including about future economic and financial markets performance. These are based on certain assumptions and other factors, and are subject to inherent risks and uncertainties. The actual outcome may be materially different. The Toronto-Dominion Bank and its affiliates and related entities that comprise the TD Bank Group are not liable for any errors or omissions in the information, analysis or views contained in this report, or for any loss or damage suffered.
Download
Share: