Easing Rates, Limited Relief:
U.S. Housing’s Gradual Recovery
Date Published: October 30, 2025
- Category:
- U.S.
- Real Estate
Highlights
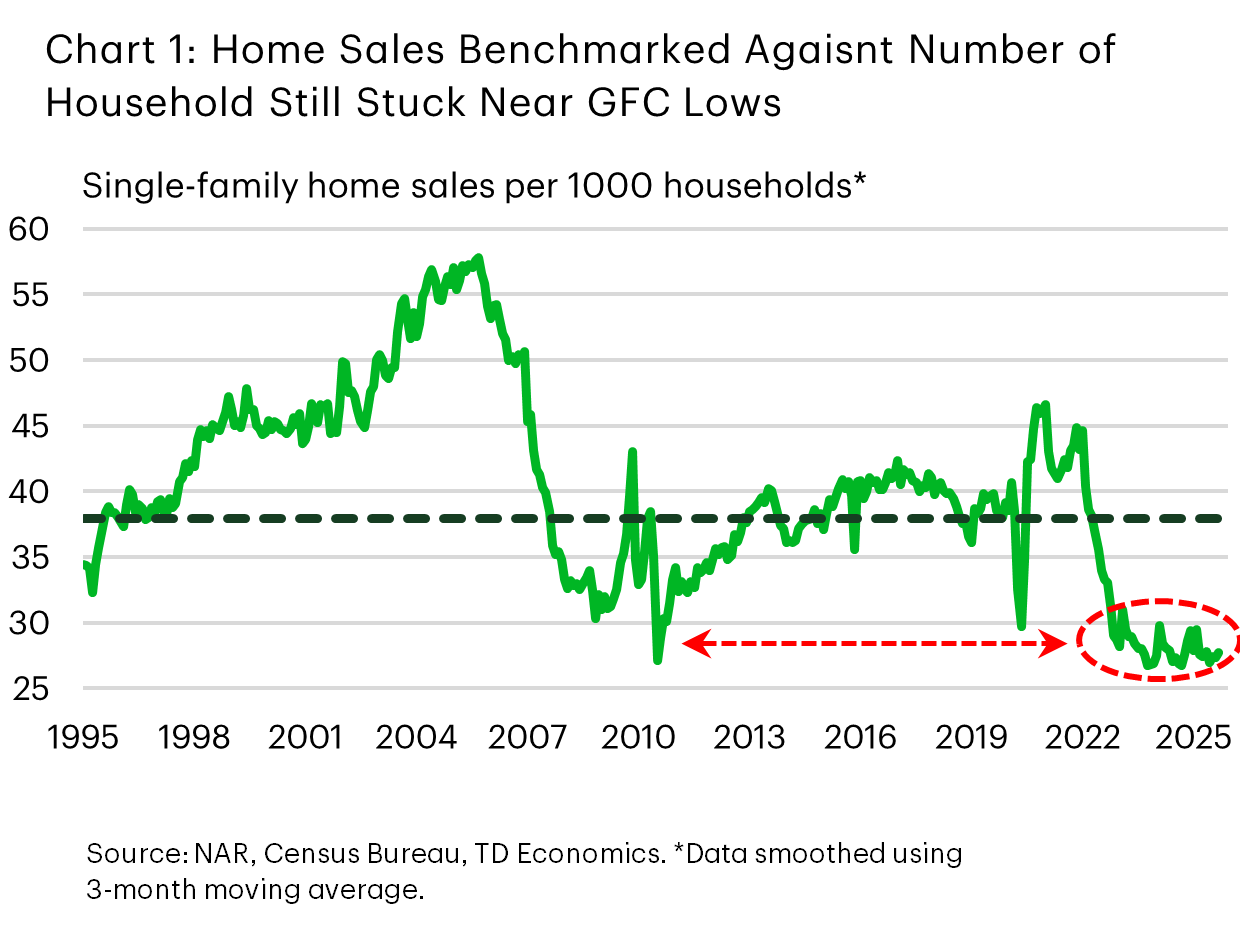
- Home sales are stuck near the lows reached during the Global Financial Crisis, as elevated interest rates and economic uncertainty continue to restrain activity.
- The effects of higher rates have been two-fold: increasing the barrier to entry for new home buyers while deterring existing homeowners from listing given that most are locked in at a much lower rate.
- We see a bit more room for mortgage rates to fall by next summer, which alongside some fiscal tailwinds from the One Big Beautiful Bill Act and more certainty on the trade front, should lead to pick up in sales activity.
- However, with home prices more than 50% above pre-pandemic levels and mortgage rates likely to settle somewhere in the 5.75-6% range , cost of housing challenges will remain a headwind for the housing recovery.
- Sales are expected to rise by 5% in 2026 followed by another 10% in 2027, leaving them 5% below 2019 levels – underscoring the gradual nature of the expected recovery.
The U.S. housing market remains in a tough spot. Home sales remain over 20% below their pre-pandemic level. Elevated interest rates remain the single biggest culprit undermining the housing recovery. The 30-year fixed mortgage rate currently sits at 6.2%, down significantly from the 8% high in 2023, but still elevated relative to pre-pandemic levels when mortgage rates were closer to 4%. The effects on housing activity have been two-fold. Not only has it stretched the cost of entry for new homebuyers, but it has also deterred homeowners from listing properties given that most are locked in at a much lower interest rate.
We expect a bit more downward drift on mortgage rates – likely getting down to 5.75%-6%. This means mortgage rates will remain structurally higher relative to pre-pandemic levels. We expect that this will contribute to housing cost challenges for the foreseeable future. Emerging signs of strain in the labor market add insult to injury and are likely to keep a lid on sales activity through the remainder of this year. By next year, the combination of more certainty on trade and government policy more generally, looser monetary policy, and fiscal tailwinds stemming from the One Big Beautiful Bill Act should help to breathe some life back into the labor market. A gradual recovery across the housing sector is likely to take hold, which could lift home sales (existing and new) by about 5% followed by another 10% in 2027. But even under this relatively optimistic forecast, total sales would still be 5% below pre-pandemic levels – underscoring the gradual nature of the expected recovery.
U.S. Existing and New Housing Markets Diverge
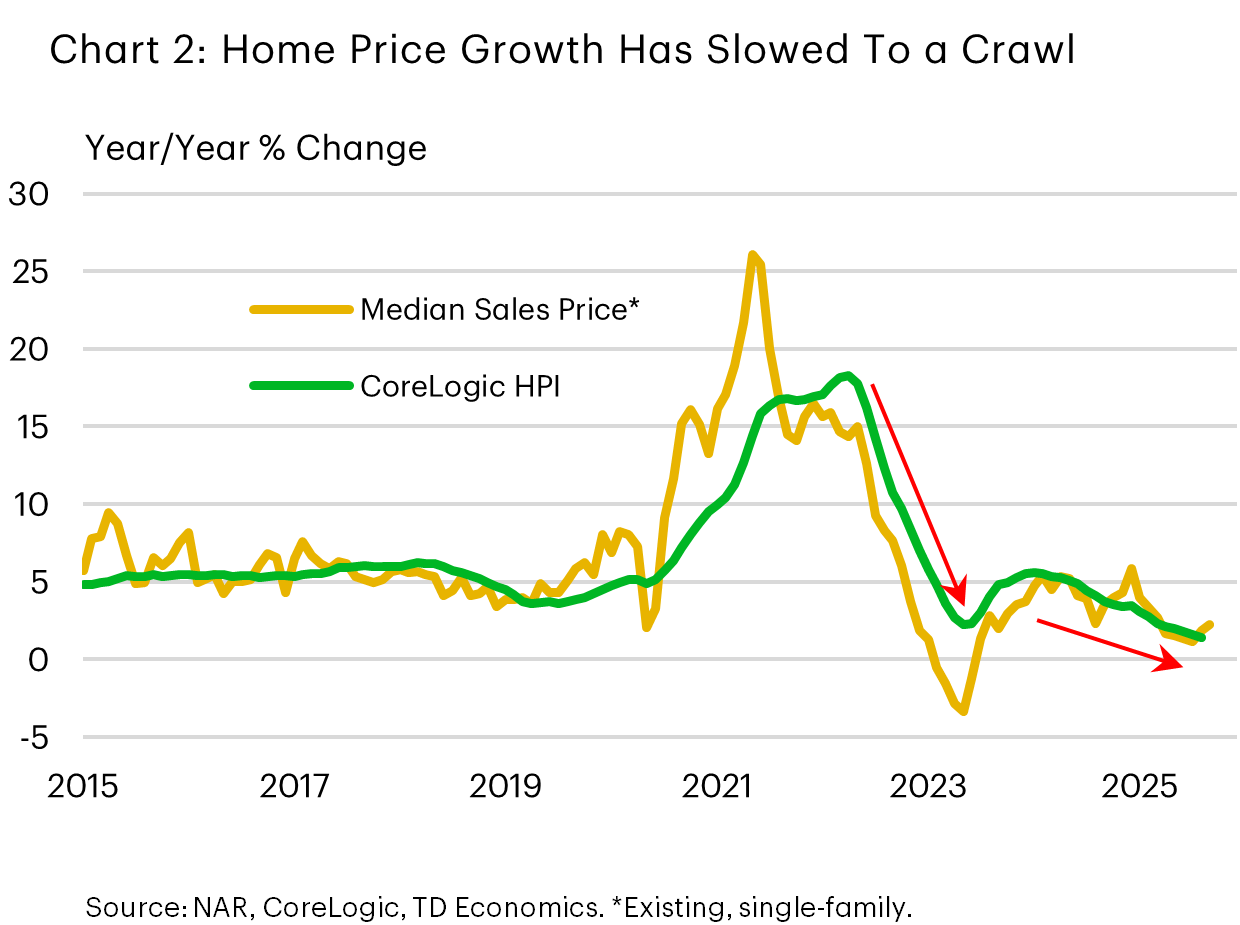
The U.S. home sale market can be broken into two segments: resale and new home sales. The resale market is by far the larger of the two, accounting for 85% of total sales activity. Existing home sales are down roughly 5% so far this year, which comes on top of three years of declines. After adjusting for the number of households, existing sales are running at a similar pace to the depths of the Global Financial Crisis, while price growth has also slowed notably (Chart 1 and 2). The weakness in activity has been pervasive across all four Census Regions and that trend has continued though this year with sales down 7% on the year in the Northeast, 6% in the Midwest, and roughly 5% in both the South and West.
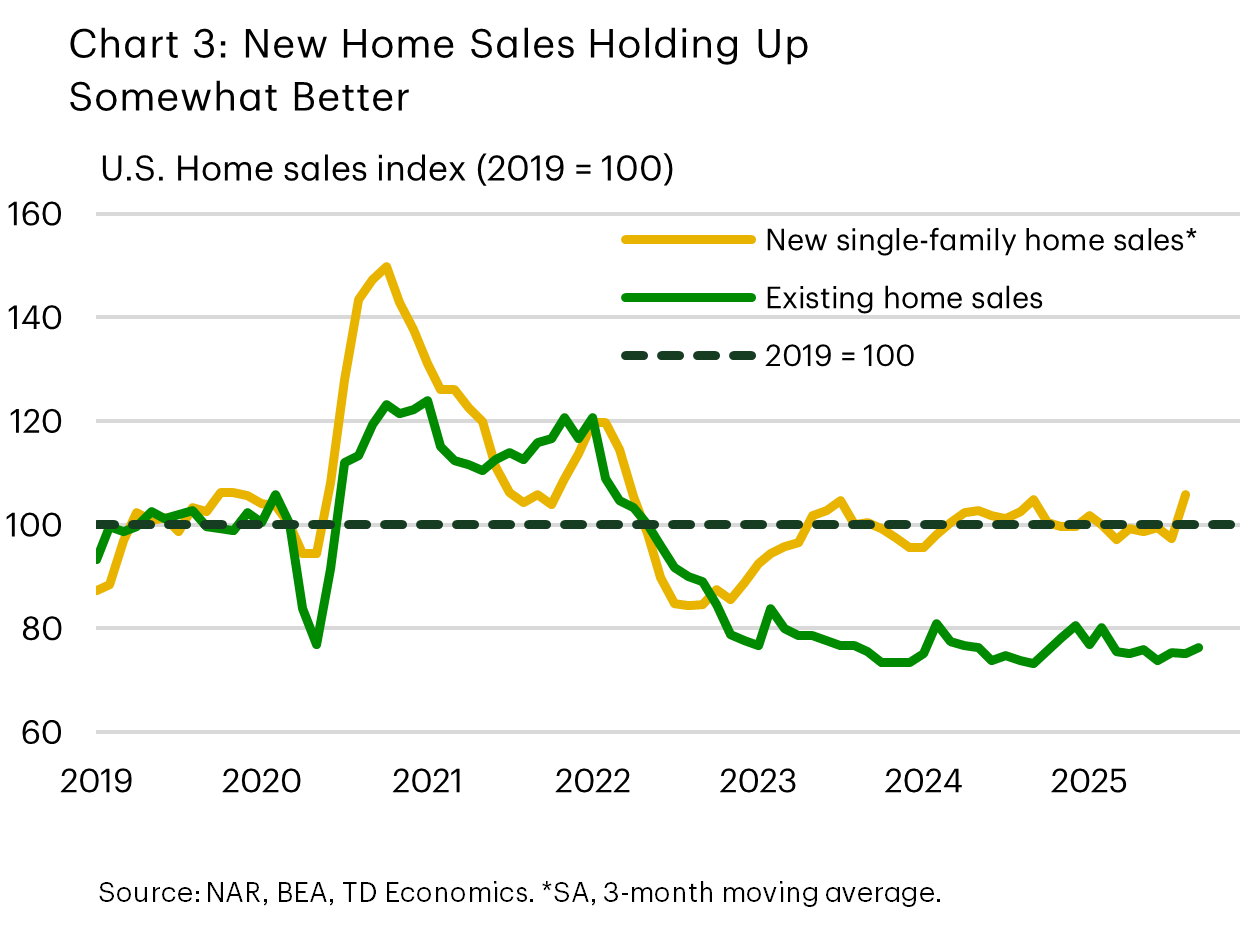
New home sales have fared somewhat better, moving broadly in line with their pre-pandemic level over the last two years and are up 11% year-to-date (Chart 3). However, much of the recent strength can be chalked up to a sharp gain in August, where national sales rose over 20% month/month. Given the lack of a catalyst and the fact that this series is inherently volatile, it’s likely that there will be some giveback in the months ahead. Should sales fall back to a level more consistent with the average seen over the prior three months, that would suggest that new home sales would be down by about 9% on the year.
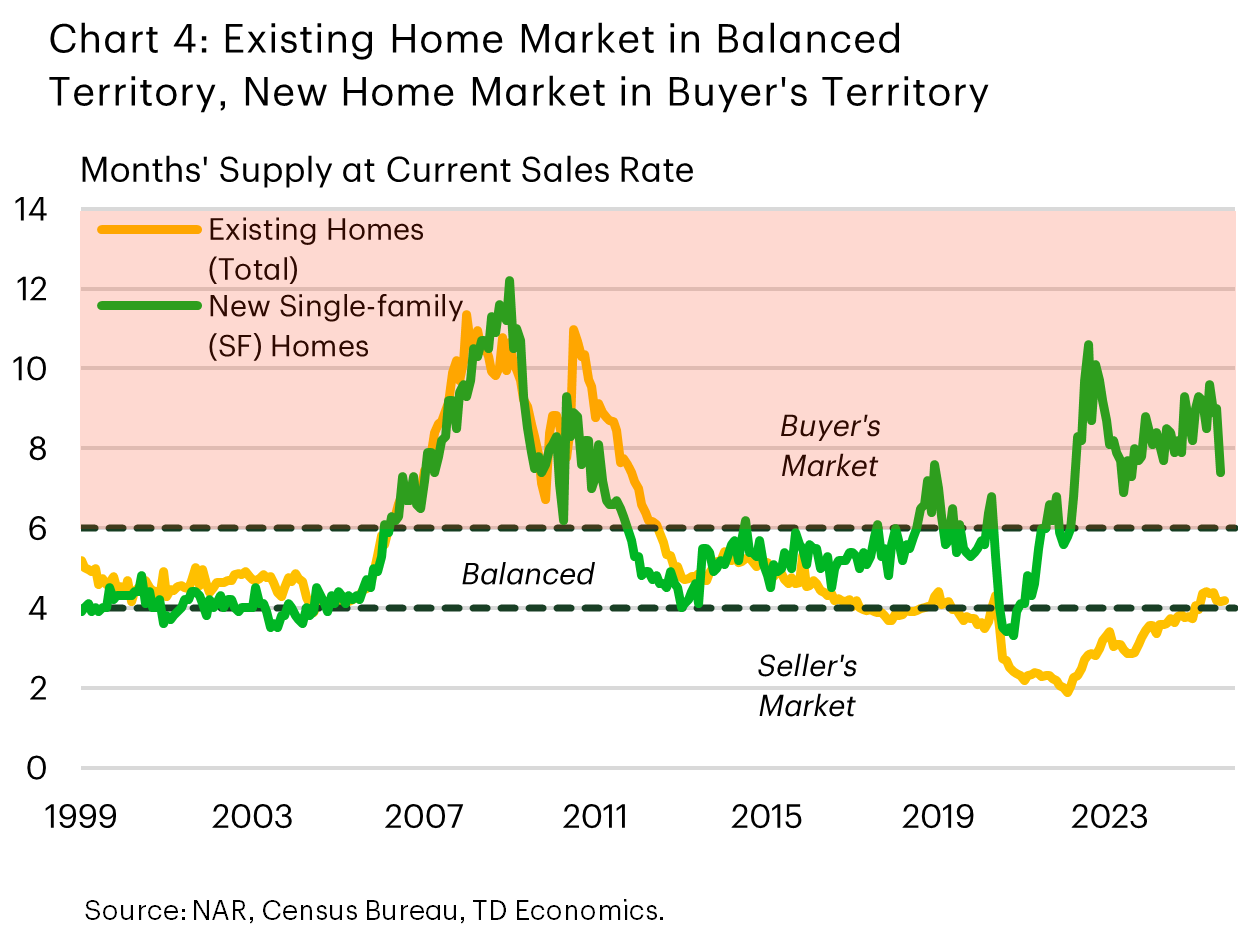
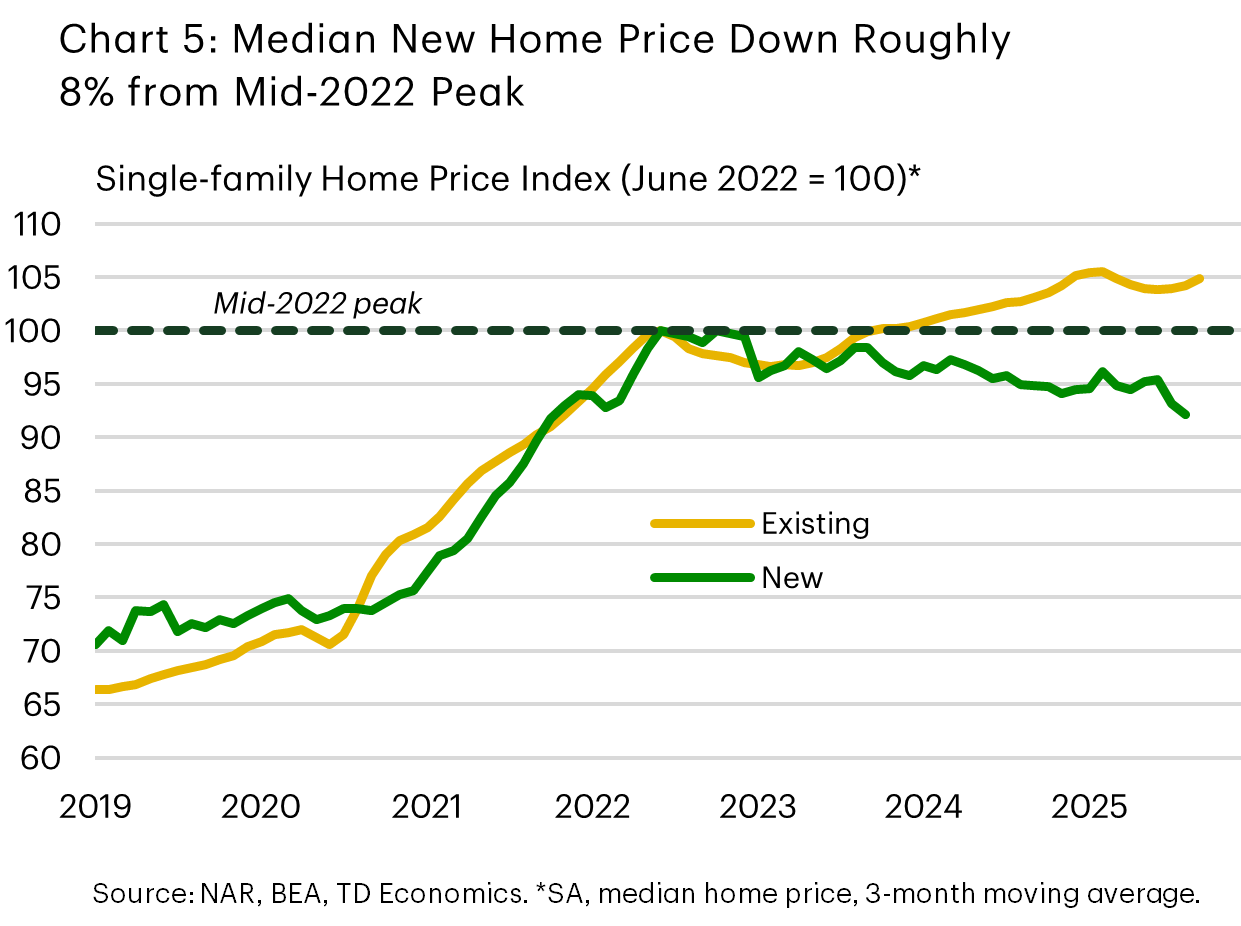
In large part, the outperformance of new home sales can be chalked up to a large supply glut that formed following strong building activity through the pandemic. After smoothing through recent volatility, current inventory – as measured by months’ supply – sits at 8.4 months, which is much higher than its pre-pandemic level and remains well in “buyers’ territory” (Chart 4). Looser conditions have meant that inventories have not been an impediment to sales, like they have in the resale market. However, price growth has suffered, with prices of new single-family homes having trended lower since 2022 and are now 8% below their post-pandemic peak (Chart 5). The elevated supply backdrop has also resulted in builders deploying a range of incentives to entice buyers who may otherwise be priced out of the resale market. Surveys indicate that about two-thirds of homebuilders are using sales incentives, while nearly 40% of builders are reported to be cutting prices – the highest proportion in the post-pandemic period.
Slightly Lower Rates Unlikely to be a Game Changer
After peaking near 7% in early summer, the 30-year fixed mortgage rate has trended lower and is now near 6.2%. The downtrend in rates appears to be attracting some buyers back into the market, with existing home sales ticking up in September. But sales are bouncing off a very low level and with the cost of housing set to remain a constraint, it’s unlikely that we’re headed for a sea change anytime soon.
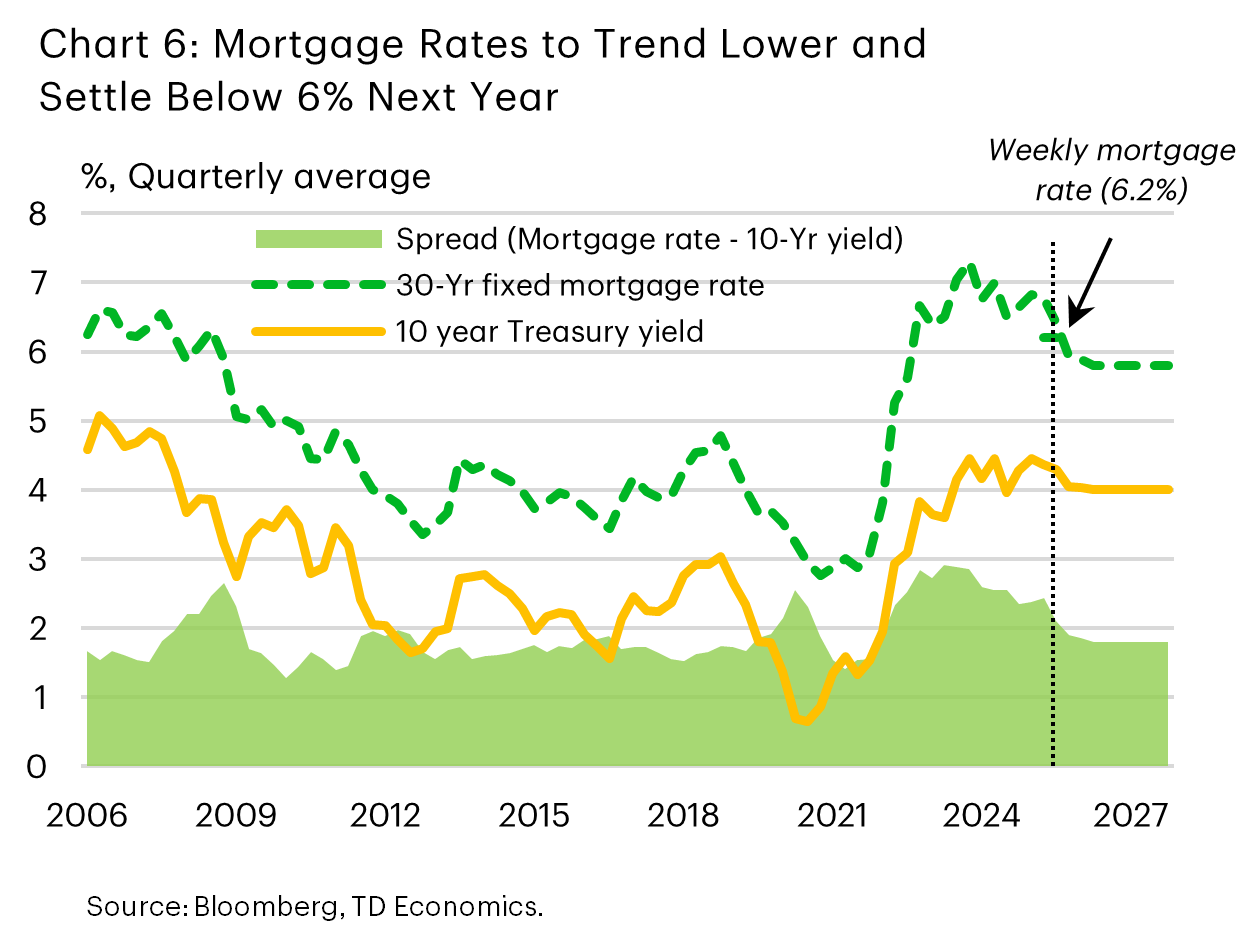
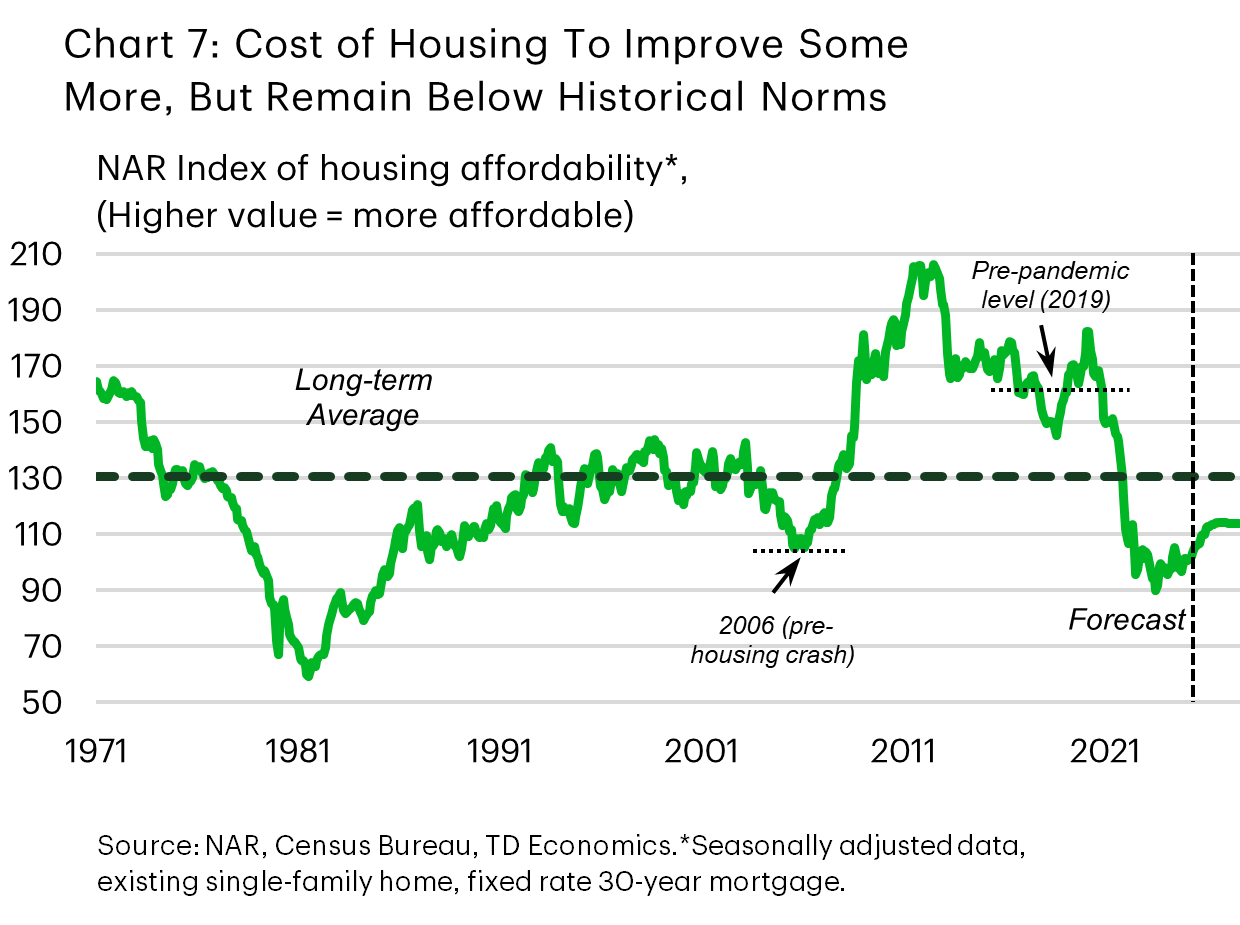
Relative to 2019 levels, housing costs (factoring in today’s mortgage rate, median household income and the price of a ‘typical’ home) have worsened by 35%, reflecting both higher interest rates and the sharp increase in home prices that occurred during the pandemic-driven ‘race for space‘. By our estimates, today’s elevated mortgage rate accounts for roughly three-quarters of that deterioration. In our view, there’s scope for mortgage rates to drift a bit lower, but probably no more than 50 basis points (bps) or so, suggesting a floor in the 5.75%-6% range or 200 basis points above pre-pandemic levels (Chart 6). Assuming modest income and home price growth over the medium term, the cost of housing is likely to improve only slightly over the coming years. Nevertheless, it will likely remain below its long-term average and continue to pose a headwind for home sales (Chart 7).
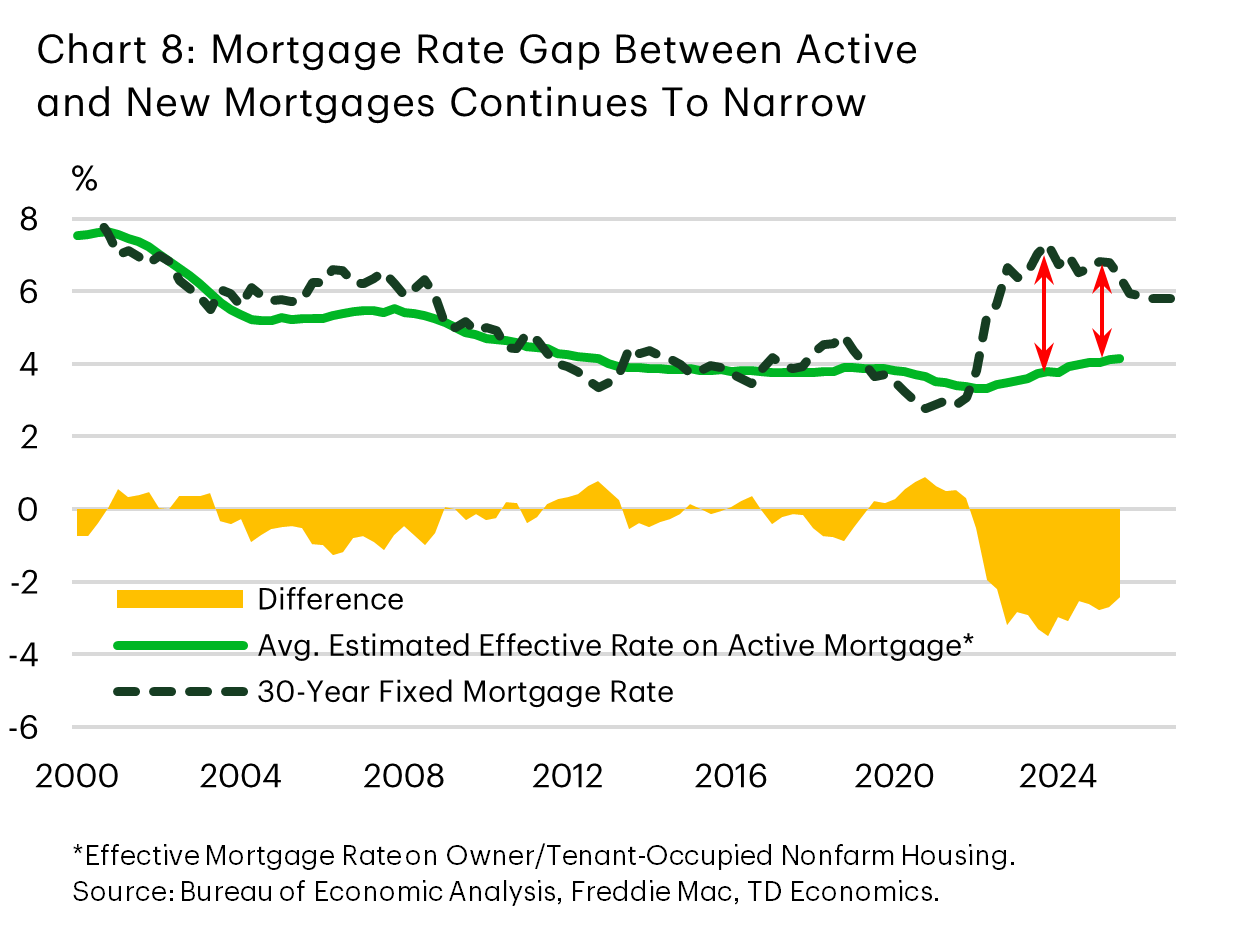
Another factor weighing on sales is the fact that most homeowners who have a mortgage are paying a much lower rate than today’s prevailing rate, providing a strong disincentive to move. According to data compiled by the New York Federal Reserve, only 15% of mortgage holders are servicing a mortgage with a rate above 6%, while another 10% are between 5%-6%. Today’s ‘effective mortgage rate’ (i.e., the average interest paid on the outstanding mortgage debt) is 4.1%, over 200 basis points below today’s posted rate (Chart 8). This is what’s commonly referred to as the mortgage ‘lock-in effect’ and is one of the bigger factors keeping many ‘would-be’ sellers on the sidelines.
So, what rate would we need to see to pull some of these would-be sellers off the sidelines? A recent Bankrate survey showed that 54% of homeowners said there’s no rate that would make them comfortable to sell this year, while 27% said they would consider selling if mortgage rates were to drop below 6%. Similarly, 51% said there’s no rate that would entice them to purchase a new home this year, though 40% would consider it if rates dipped below 6%.
Textbox: Adjustable-rate mortgages (ARMs) gain some traction
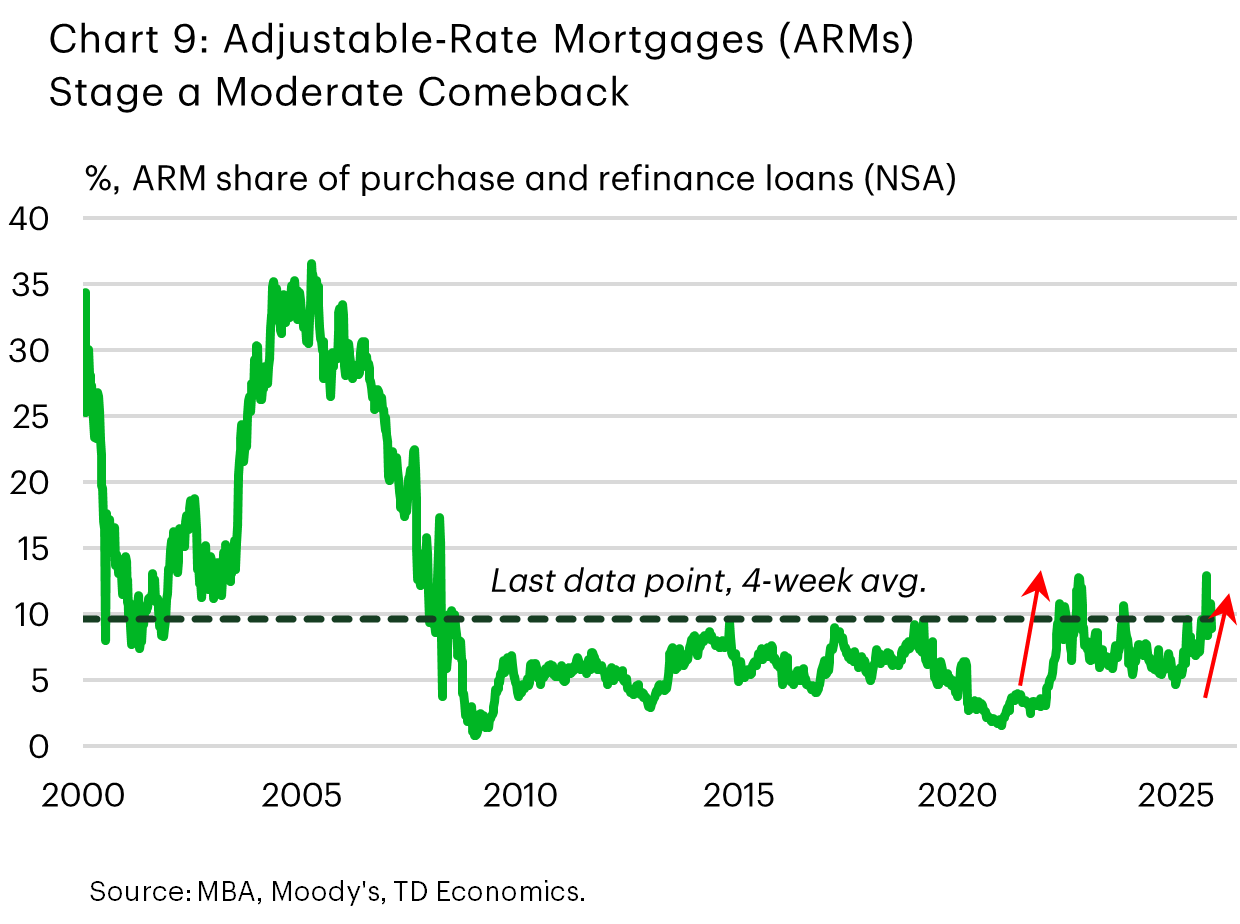
The stigma from the 2008-09 housing crash continues to weigh on the popularity of adjustable-rate mortgages (ARMs) – with originations in this space accounting for just fraction of its early-2000 share. However, uptake has increased more recently and ARMs are now accounting for about 10% of total mortgage applications – or roughly double the level at the start of the year (Chart 9). The last time we saw a similar uptrend in ARMs was when the Fed began to raise rates in 2022. Back then, the typical 30-year fixed rate mortgage became much higher than some ARM products. The latest uptrend in ARMs appears to be more nuanced. The rate advantage of the 5/1 ARM (which carries a fixed rate for the first 5 years and allows to the rate to adjust each year thereafter) has narrowed over the past year to 50 bps – half what it was a year ago. Meanwhile the 7/6 SOFR ARM (fixed rate for seven years, readjusts every 6 months thereafter) that offers a long-term fixed portion has widened from roughly 10 to 40 bps. The bottom line is that ARMs still offer an advantage, and at a time of stretched affordability, they can be an attractive alternative to the traditional 30-Year fixed term. The fact that the Federal Reserve is expected to lower policy rates over the medium term could be reducing the perceived risks of facing a higher rate down the road (when the fixed term portion ends and the rate re-adjusts) and thus encouraging a higher uptake of ARMs.
Uncertainty Another Knock Against Housing
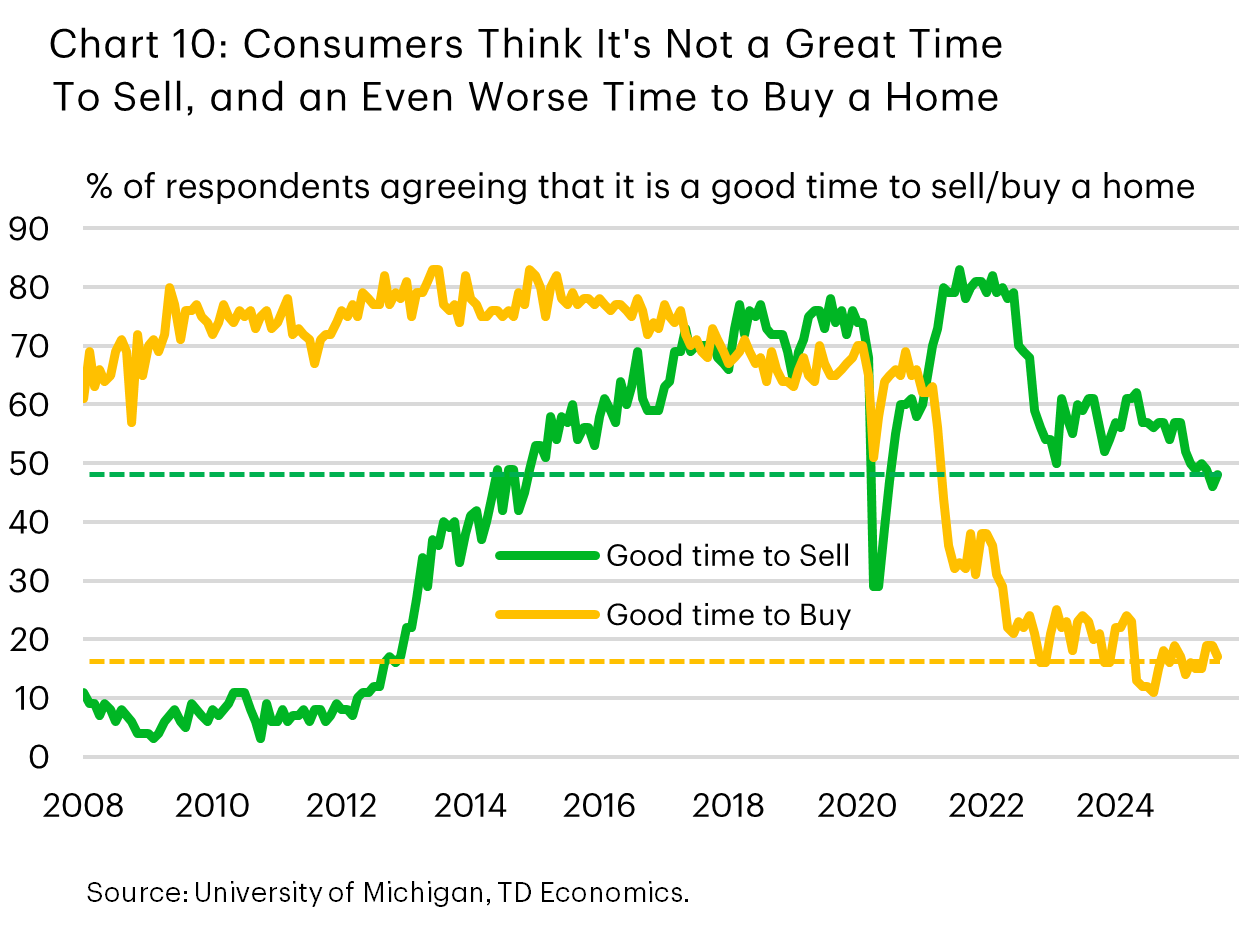
The other concern for the housing market is uncertainty about the economy in the face of significant policy shifts under the new administration. From tariffs to government cutbacks, many households are feeling a lot less secure about their economic prospects. Job growth has slowed notably through this year, pushing the unemployment rate to a new cycle high. While the government shutdown has temporarily delayed the release of official statistical agency data, private sector data has shown a bit more weakening in job growth and some further pullback in job openings. However, layoffs and quits remain low and broadly stable, suggesting current conditions are steadying in a ‘low hire, low fire’ environment. For now, this limits the downside risk to the broader economy but does little to encourage perspective homebuyers that ‘now is a good time to buy’. This is exactly what we’re seeing in survey measures of consumer confidence, where households are noting that both buy and sell conditions remain at very depressed levels (Chart 10).
As we move into 2026, our forecast assumes some moderate improvement in the labor market and the economy. Ongoing trade negotiations are assumed to yield further bilateral agreements, leading to more certainty on the trade landscape. At the same time, fiscal stimulus from the One Big Beautiful Bill Act should start to be felt through a combination of household tax breaks, lucrative incentives for businesses to invest and increased defense spending. Less restrictive monetary policy should also work to stimulate growth. The combination of forces should lead to a pick-up in job creation and help to pull more buyers off the sidelines. However, the rebound in home sales is likely to be gradual at best, with sales (new and existing) expected to rise by just 5% in 2026 followed by a stronger 10% in 2027. But even under this forecast, sales will still be 5% below pre-pandemic levels, reflecting the ongoing constraints from the structurally higher cost of housing.
New Home Sales Likely to Retain a Larger Share of the Market in the Year Ahead
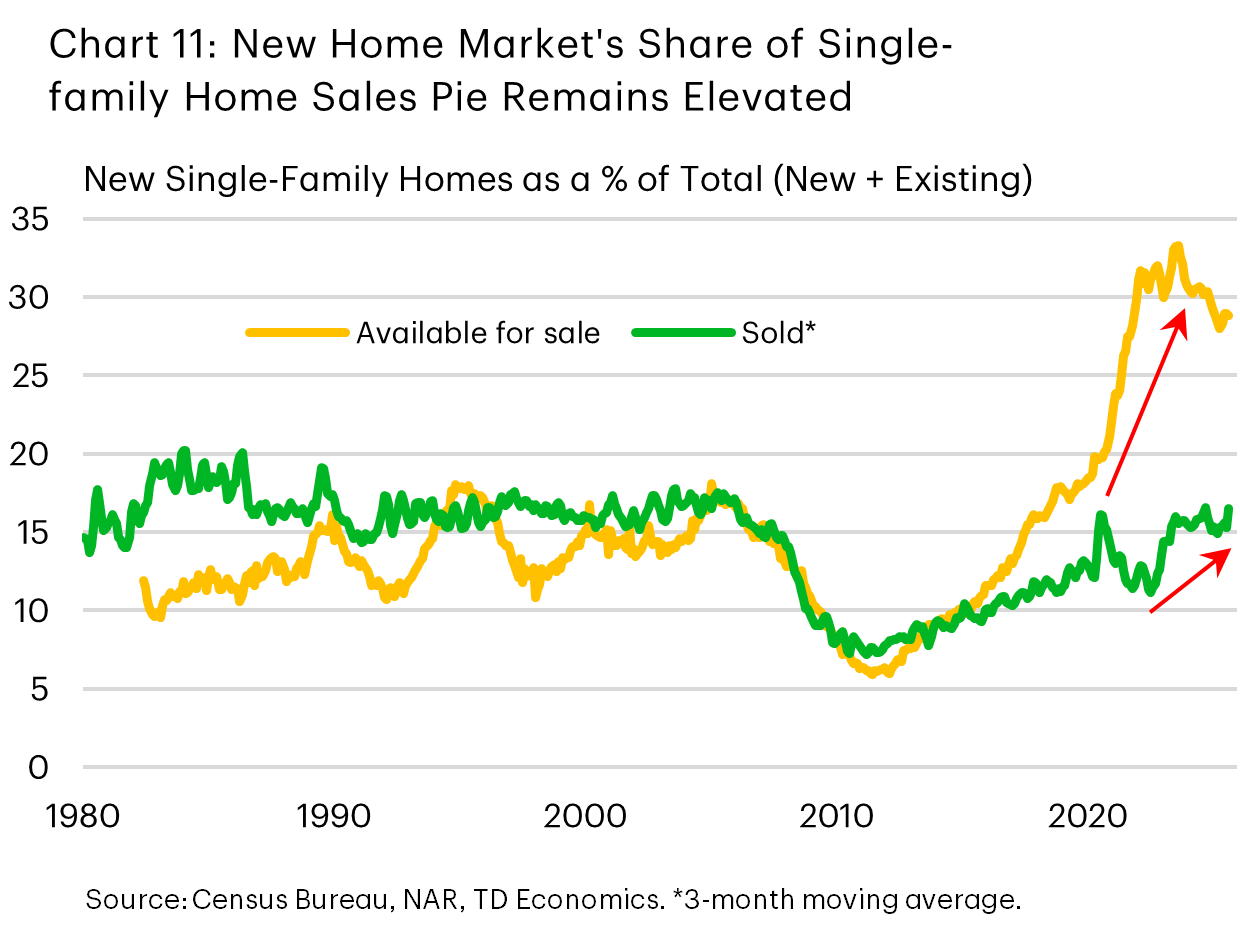
With the lock-in effect preventing a higher share of homeowners from moving, buyers are likely to rely more heavily on the new home market, where inventories remain ample. Since the Fed began raising interest rates in March 2022, new homes share of total sales has increased by several percentage points and currently sits around 15%. However, based on current listings, new homes account for nearly 30% of the single-family inventory (Chart 11) – two-thirds of which are concentrated in the South.
With inventories historically elevated, the price premium for new homes – typically 16% higher than a resale – has vanished and are now selling at a small discount. This dynamic is likely to persist for at least another year, suggesting the new home market will continue to account for a larger share of overall sales.
Bottom Line
Mortgage rates have eased to 6.2% recently and are likely to fall a bit further, although not by much. The moderate improvement in rates will lend modest support to the housing recovery, as it makes homebuying slightly more affordable, and it encourages some owners with existing low rates to put their homes on the market. Still, with mortgage rates to remain structurally higher relative to pre-pandemic levels, the expected improvement will do little to alter the overarching theme of structurally higher housing costs. Assuming some modest turnaround in consumer confidence and the labor market, a further loosening in monetary policy, and some fiscal tailwinds from OBBBA, we anticipate total home sales will rise by 5% in 2026 and 10% in 2027. This will still leave sales activity roughly 5% below pre-pandemic levels – underscoring the gradual nature of the expected recovery.
Disclaimer
This report is provided by TD Economics. It is for informational and educational purposes only as of the date of writing, and may not be appropriate for other purposes. The views and opinions expressed may change at any time based on market or other conditions and may not come to pass. This material is not intended to be relied upon as investment advice or recommendations, does not constitute a solicitation to buy or sell securities and should not be considered specific legal, investment or tax advice. The report does not provide material information about the business and affairs of TD Bank Group and the members of TD Economics are not spokespersons for TD Bank Group with respect to its business and affairs. The information contained in this report has been drawn from sources believed to be reliable, but is not guaranteed to be accurate or complete. This report contains economic analysis and views, including about future economic and financial markets performance. These are based on certain assumptions and other factors, and are subject to inherent risks and uncertainties. The actual outcome may be materially different. The Toronto-Dominion Bank and its affiliates and related entities that comprise the TD Bank Group are not liable for any errors or omissions in the information, analysis or views contained in this report, or for any loss or damage suffered.
Download
Share: