Highlights
- The U.S. is outperforming most other developed countries on many indicators of economic health. Despite this, U.S. consumers are still reporting levels of sentiment more consistent with an economy emerging from a recession, rather than one that has consistently outperformed.
- Several explanations have been suggested to account for the discrepancy. These generally revolve around inflation, interest rates and consumer’s internalized anxiety about the current social and geopolitical climate.
- While the current strength in consumer spending may contradict their self-reported sour mood, if historical relationships reassert themselves, consumer spending may be headed for a soft patch.
According to official data, the U.S. economy is performing exceptionally well and is outperforming many of its G7 peers (see here). Inflation has come down from near double-digit highs, unemployment is historically low, employment growth is strong, real wages are starting to rise and GDP is growing at a healthy clip (see TD forecasts). The problem – consumers remain relatively glum.
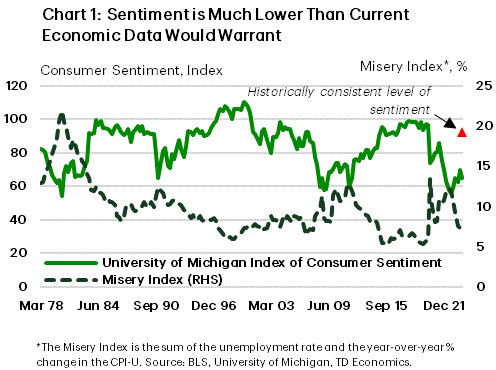
Measures of consumer sentiment have been notably lower than what such strong economic data would normally merit. Historically, moderate inflation and low unemployment would result in a rather elevated level of consumer sentiment. Take for example the misery index, which is the sum of the unemployment and inflation rates. It currently stands at 7.1%. Historically, when the misery index is that low, consumer sentiment, as measured by the University of Michigan’s Index of consumer sentiment, is generally around 92 points (Chart 1). The most recent sentiment measure of 76.5 however is notably below that mark. The same is true of the Conference Board’s consumer confidence measure, which at 104.7 is also below its historically consistent value of around 113. Thus, despite recent upticks, consumer sentiment is still significantly below the level normally associated with such robust economic data. In short, there appears to be a general disconnect between consumer mood and U.S. economic performance in the hard data.
The Interplay Between Sentiment and Spending
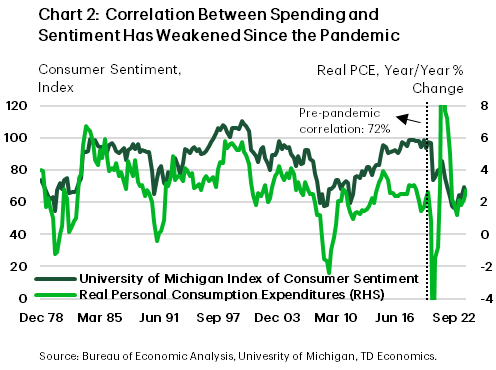
First off, previous research has shown that there is a correlation between consumer spending and consumer sentiment.1 In fact, the correlation between the Michigan consumer sentiment index and growth in total personal consumption expenditure was more than 70% prior to the pandemic (Chart 2).2 This historically strong link between the two variables suggests that confidence may be helpful in predicting consumer spending.
To delve deeper, the question of whether or not consumer sentiment provides meaningful information about future consumer spending beyond that already contained in other economic data has already been examined in the economic literature. The general finding is that it does, but with caveats. Earlier studies found a direct link between sentiment and spending such that movements in sentiment could directly help to forecast movements in consumer spending.3 The relationship was small but significant. More recent authors have found, however, that controlling for variables omitted in these earlier studies, sentiment affects spending, but only indirectly.4 In this view, sentiment simply foreshadows the overall outlook for the economy, by between one to four quarters ahead. It’s a reflection of emerging economic conditions. When consumers are optimistic about the economic outlook, they give positive responses to interviewers. On average, those expectations are validated and spending eventually increases as sentiment suggested it would.
Reasons for the Disconnect Between Sentiment and Economic Data
Given the historical and empirical connection between sentiment and economic data, the current divergence between the two is even more interesting. There are several reasons that have been proposed and they fall into three broad categories relating to inflation, interest rates and consumer’s internalization of external non-economic factors (aka “referred pain”).
Price Changes and Levels
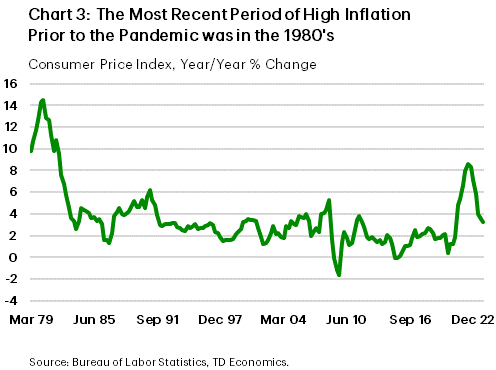
Firstly, high inflation coming out of the pandemic likely dampened consumer’s mood. Many consumers have not experienced inflation as high as 9.1% in their lifetime. The last time inflation exceeded 9.1% was over 40 years ago (Chart 3). The memory and shock of it may still be lingering and affecting sentiment. Consumers tend to have long memories when they experience a negative shock such as rapidly rising prices, and it will take a sustained period of much lower price increases to counteract that effect.
Inflation (Mis)Calculation
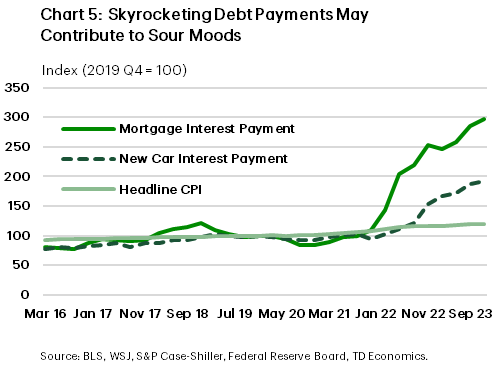
Another aspect to the inflation-induced malaise is one recently suggested by former Treasury Secretary Larry Summers and co-authors7 – inflation is still high. They argue that if interest rates, or “the cost of money”, was included in the prices used to measure inflation, inflation would be a lot higher. The current CPI basket does not account for interest expenses. Consequently, it is likely to understate the pain that many consumers feel as rising rates make it more expensive to undertake major purchases that are typically done on credit, such as homes and vehicles (Chart 5). This is how inflation was measured at the turn of the century, and using a reconstructed CPI measure, Summers et al (2024) estimate that homeownership costs in the CPI would have more than doubled since the pandemic. If interest costs associated with mortgages were directly included in the CPI, then inflation would have peaked at 18% not 9.1%, and current inflation would be measuring closer to 8%, not 3%.8 Their calculations suggest that consumers are experiencing a higher rate of inflation than what is measured in the official numbers, and this is dampening their moods.
Referred Pain
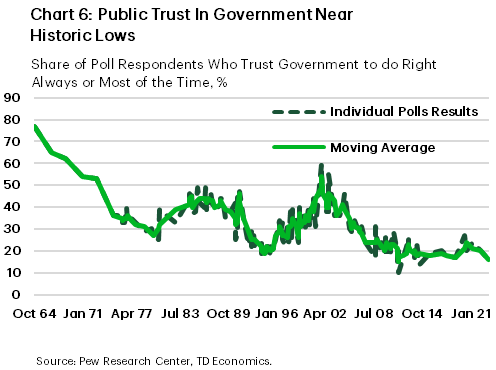
Another thesis attempting to explain unusually low consumer sentiment amidst such robust economic data is the “referred pain” hypothesis.9 This hypothesis suggests that non-economic concerns now drive economic sentiment such that consumers’ gloomy mood is due to increases in political distrust, rising cultural conflict and general dissatisfaction with institutions (Chart 6). In essence, pessimism about the economy may reflect dissatisfaction with other elements in the country or even the wider world. There is a general sense among some Americans of tenuous long-term financial stability susceptible to upheavals from wide-ranging social and political actions.10 This is perhaps understandable given that in the past 15 years many adults have lived through major life altering events such as the global financial crisis and U.S. housing collapse (2007/2008) and the Covid-19 pandemic, which significantly altered many aspects of everyday life. This general sense of living through precarious and unpredictable times, with little support from the social and cultural institutions meant to offer it, has left many feeling weighed down under a general sense of pessimism, divorced from seemingly good economic times.
Bottom Line
Despite low unemployment, strong GDP growth, declining inflation and solid wage gains, many Americans are still feeling less optimistic than the data would suggest. The reasons proffered for the widespread malaise have largely centered around the various impacts of inflation, high interest rates and deep-rooted concerns about the general social, cultural and geopolitical climate. While consumer spending has so far defied the downbeat mood reported on sentiment surveys, it may be just a matter of time before spending also retreats as previous analysis has shown a high correlation between the two. A cooling in spending, while lending an assist to the Fed’s inflation fighting regime, does remove one of the major divers of America’s current strong economic performance.
End Notes
- See Bram, Jason, and Sydney Ludvigson. 1998. “Does Consumer Confidence Forecast Household Expenditure? A Sentiment Index Horse Race.” Federal Reserve Bank of New York Economic Policy Review 4 (June): 59-78.
- The pre-pandemic correlation between the Conference Board’s consumer confidence index and consumption growth was slightly lower at almost 60%. The analysis in the paper does not change regardless of the measure of confidence used. For brevity and consistency, we will refer to the Michigan Index of Consumer Sentiment throughout.
- See Carroll, Christopher D., Jeffrey C. Fuhrer, and David W. Wilcox. 1994. “Does Consumer Sentiment Forecast Household Spending? If So, Why?” American Economic Review 84 (December): 1397–1408.
- Mehra, Yash P. and Elliot Martin 2003. “Why Does Consumer Sentiment Predict Household Spending?” Federal Reserve Bank of Richmond Economic Quarterly Volume 89/4 (Fall)
- The U.S. Department of Agriculture has in fact reported that the portion of Americans’ income spent on food has reached a three-decade high. In 1991, U.S. consumers spent approximately 11.4% of their disposable personal income on food. After falling notably in the intervening years, by 2022 (the most recently available USDA data), the figure was back up to 11.3%.
- See Ulrike Malmendier, F. D’Acunto, J. Ospina and M. Weber 2021. Exposure to Grocery Prices and Inflation Expectations. Journal of Political Economy, May 2021, vol. 129 (5), pp. 1615-1639
- See Larry Summers et al 2024. The Cost of Money is Part of the Cost of Living: New Evidence on the Consumer Sentiment Anomaly. NBER
- The authors used actual home ownership costs (such as home prices and mortgage rates) instead of the currently used owner equivalent rent in the official index to recreate a CPI index which accounted for the actual cost of this major purchase to a prospective buyer.
- See Greg Ip 2023. The Economy Is Great. Why Are Americans in Such a Rotten Mood?
- See Aaron Zitner et al 2024. Why Americans Are So Down on a Strong Economy.
Disclaimer
This report is provided by TD Economics. It is for informational and educational purposes only as of the date of writing, and may not be appropriate for other purposes. The views and opinions expressed may change at any time based on market or other conditions and may not come to pass. This material is not intended to be relied upon as investment advice or recommendations, does not constitute a solicitation to buy or sell securities and should not be considered specific legal, investment or tax advice. The report does not provide material information about the business and affairs of TD Bank Group and the members of TD Economics are not spokespersons for TD Bank Group with respect to its business and affairs. The information contained in this report has been drawn from sources believed to be reliable, but is not guaranteed to be accurate or complete. This report contains economic analysis and views, including about future economic and financial markets performance. These are based on certain assumptions and other factors, and are subject to inherent risks and uncertainties. The actual outcome may be materially different. The Toronto-Dominion Bank and its affiliates and related entities that comprise the TD Bank Group are not liable for any errors or omissions in the information, analysis or views contained in this report, or for any loss or damage suffered.
Download
Share: