U.S. Corporate Profits at a Crossroads:
AI Tailwinds and Emerging Risks
Andrew Foran, Economist | 416-350-8927
Date Published: October 21, 2026
- Category:
- U.S.
- Business Investment
Highlights
- Non-financial corporate profits have reached multi-decade highs, with the renewed increase in 2026 supported by wider margins and strength in AI-related industries. Recent tax changes have provided an additional boost to after-tax cash flow.
- Although stronger profits have supported investment, corporate balance sheets, and household wealth, the benefits have been uneven as spending has shifted toward less labor-intensive assets and labor’s share of income has fallen to a record low.
- The durability of the profit cushion will depend on sustained returns from AI investment and continued economic resilience as higher energy prices and tighter credit conditions place growing pressure on demand and margins.
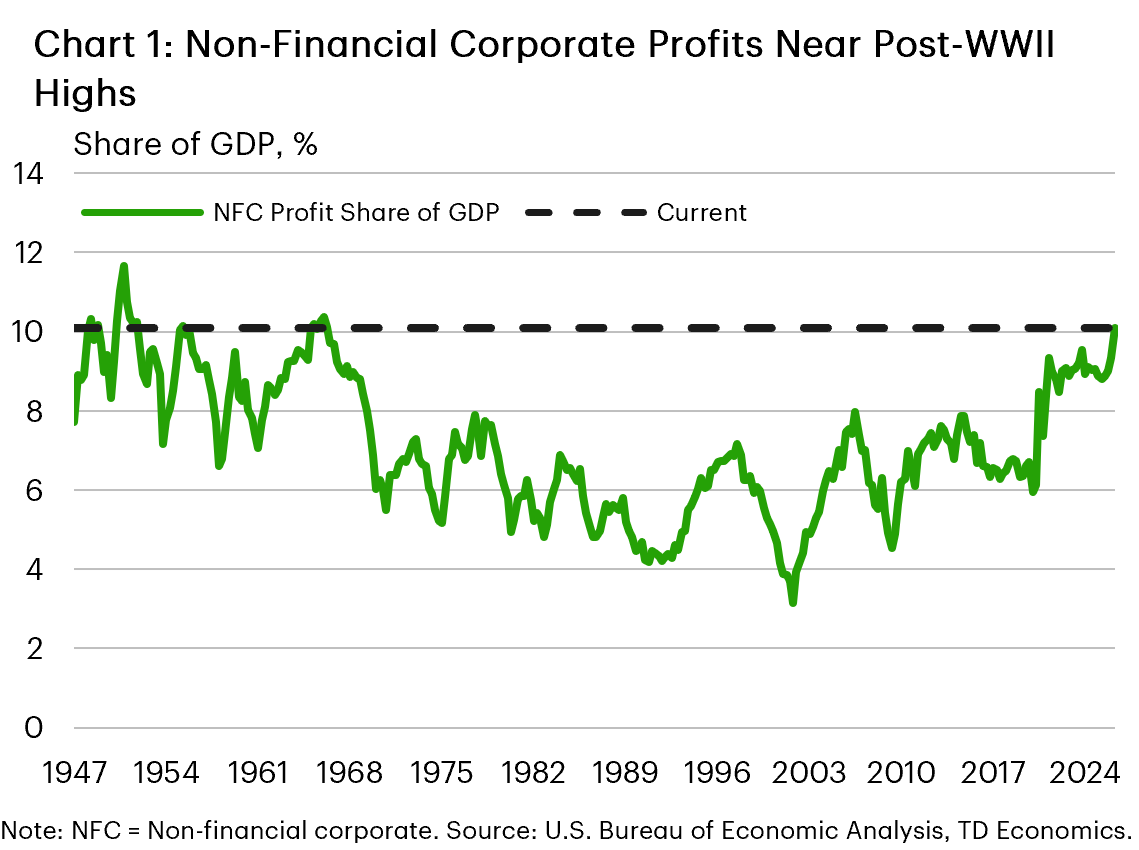
In an environment characterized by elevated inflation, higher interest rates, and heightened uncertainty, firm profitability would typically be expected to come under pressure. Instead, U.S. non-financial corporate (NFC) profits have continued to climb, accounting for a double-digit share of GDP in 2026Q2 for the first time in sixty years (Chart 1). While much of the increase occurred during the post-pandemic recovery, 2026 has brought a renewed acceleration in profit growth.
At first glance, this would appear to be a positive development, as stronger profits are generally indicative of a healthy economy and can provide a cushion against rising input costs. However, elevated profits also raise important questions about their broader economic implications. Expanding profit margins may contribute to inflationary pressures, particularly in technology-related industries where profit growth has been strongest. At the same time, the benefits of higher profits have not been shared evenly across the economy, with the labor share of NFC income falling to a record low. Taken together, these dynamics highlight both the uneven distribution of recent profit gains and the uncertainty surrounding their durability as AI-related investment matures and higher input costs weigh on broader demand.
How Did Profits Get This High?
Between 1970 and 2020, NFC profits fluctuated between 4-8% of GDP. Leading up to the pandemic, they trended near the middle of this range but jumped in the years following the onset of the pandemic to rest above 9%. This jump was supported by accommodative monetary and fiscal policy as demand rebounded rapidly following the lifting of pandemic restrictions. These factors can explain the initial jump in profits, but the lack of mean-reversion in subsequent years suggests other factors are at play.
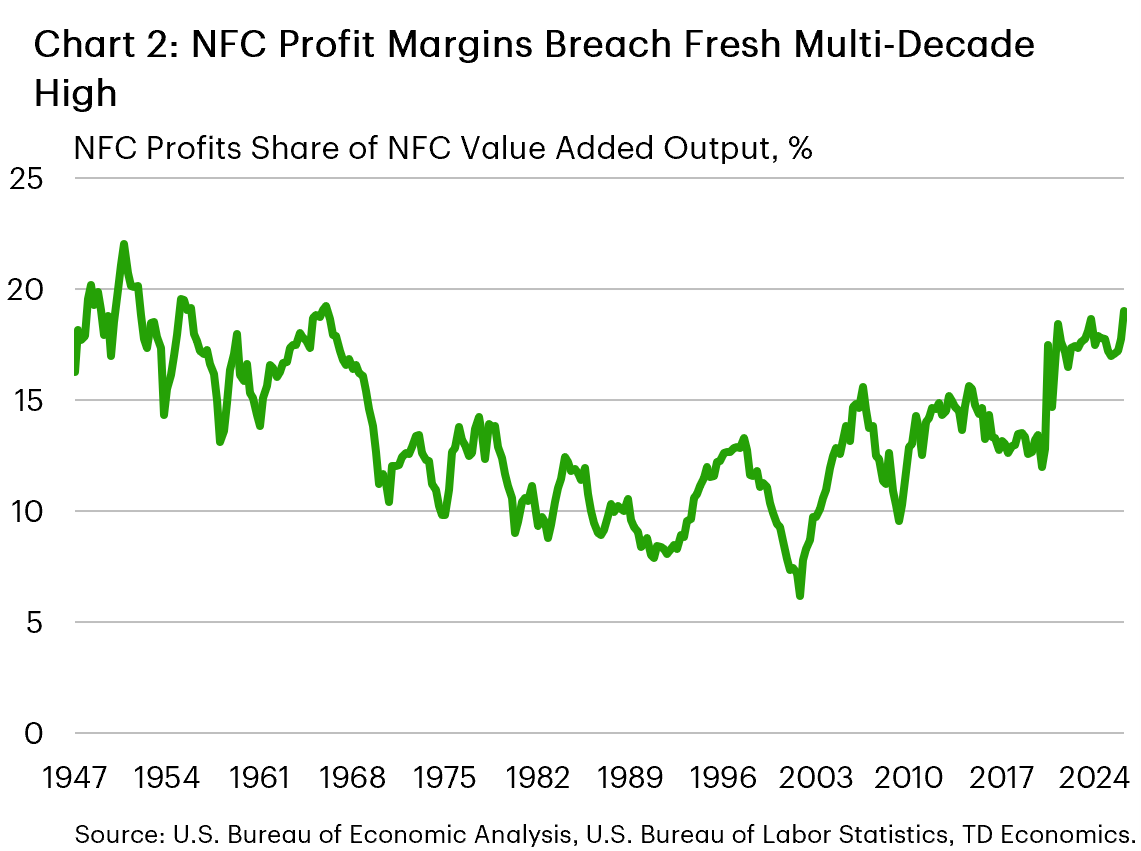
Corporate profits typically face margin pressure when economic conditions weaken, but the resilience of the economy has allowed profits to remain elevated. NFC profit margins—the share of NFC value added accruing to profits—rose by 5 percentage points during the pandemic and remained near that level thereafter (Chart 2). The renewed acceleration in profits in 2026 has been partly driven by further margin expansion, with margins now sitting just below 20%—a six-decade high.
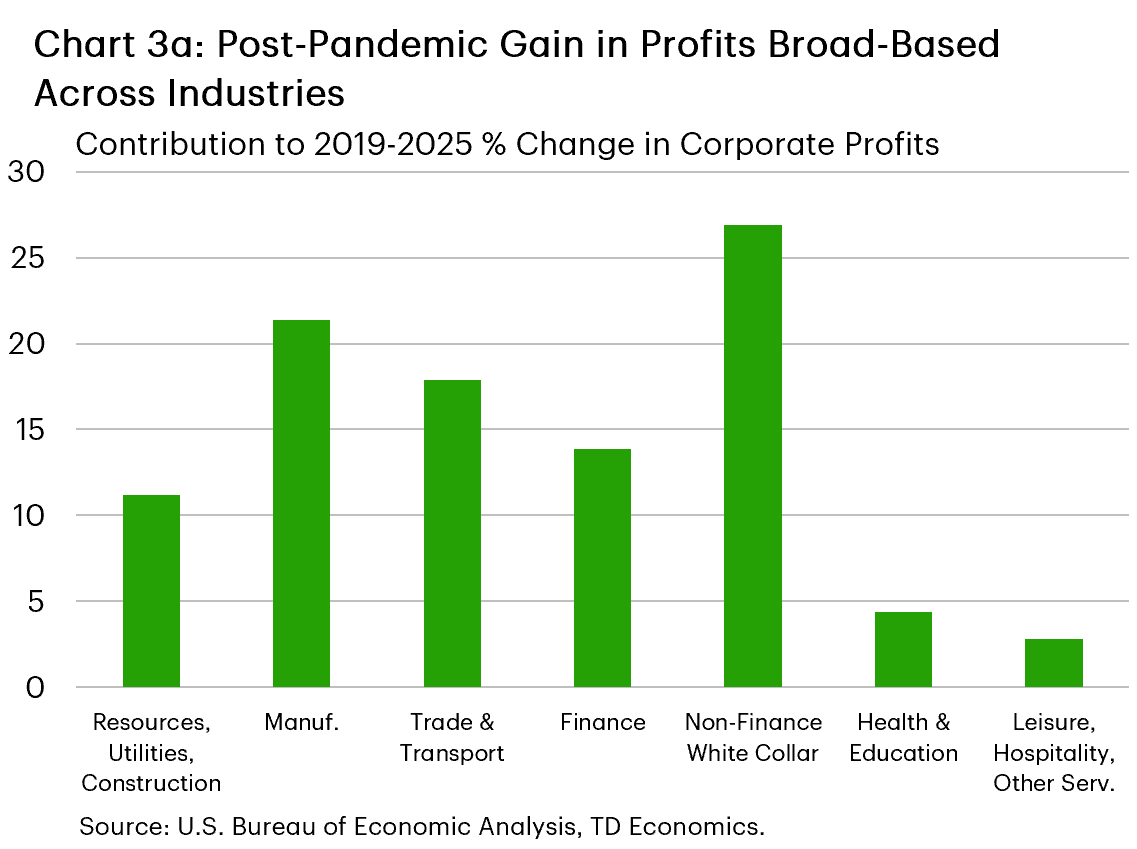
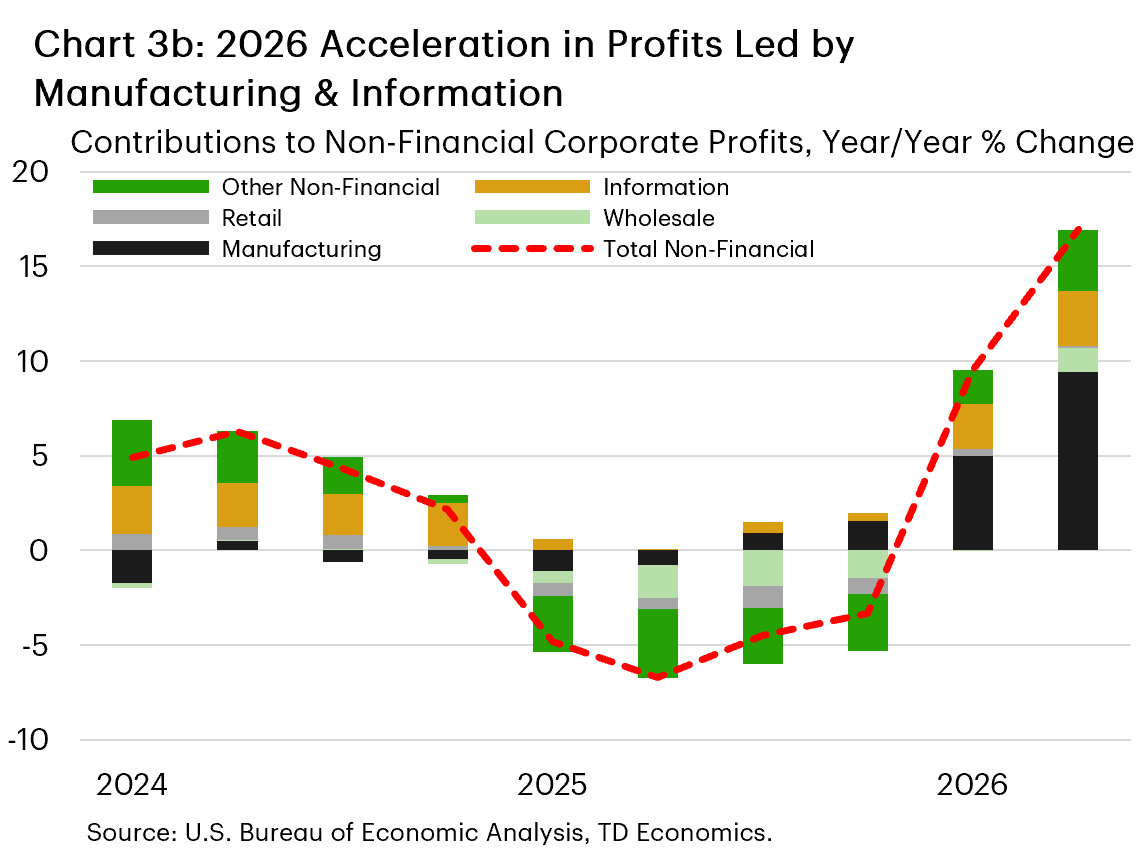
The industry-level data also show that the increase in corporate profits has been broad-based. Between 2019 and 2025, nominal profits nearly doubled, with manufacturing and non-financial white-collar industries accounting for half of the gain (Chart 3a). The remainder was distributed relatively evenly across other sectors. More recently, manufacturing and information have accounted for most of the renewed increase in NFC profits (Chart 3b). The Bureau of Economic Analysis (BEA) releases more detailed subcategory data with a lag, but the concentration of recent profit growth in manufacturing and information is consistent with an important contribution from energy and AI-related industries.
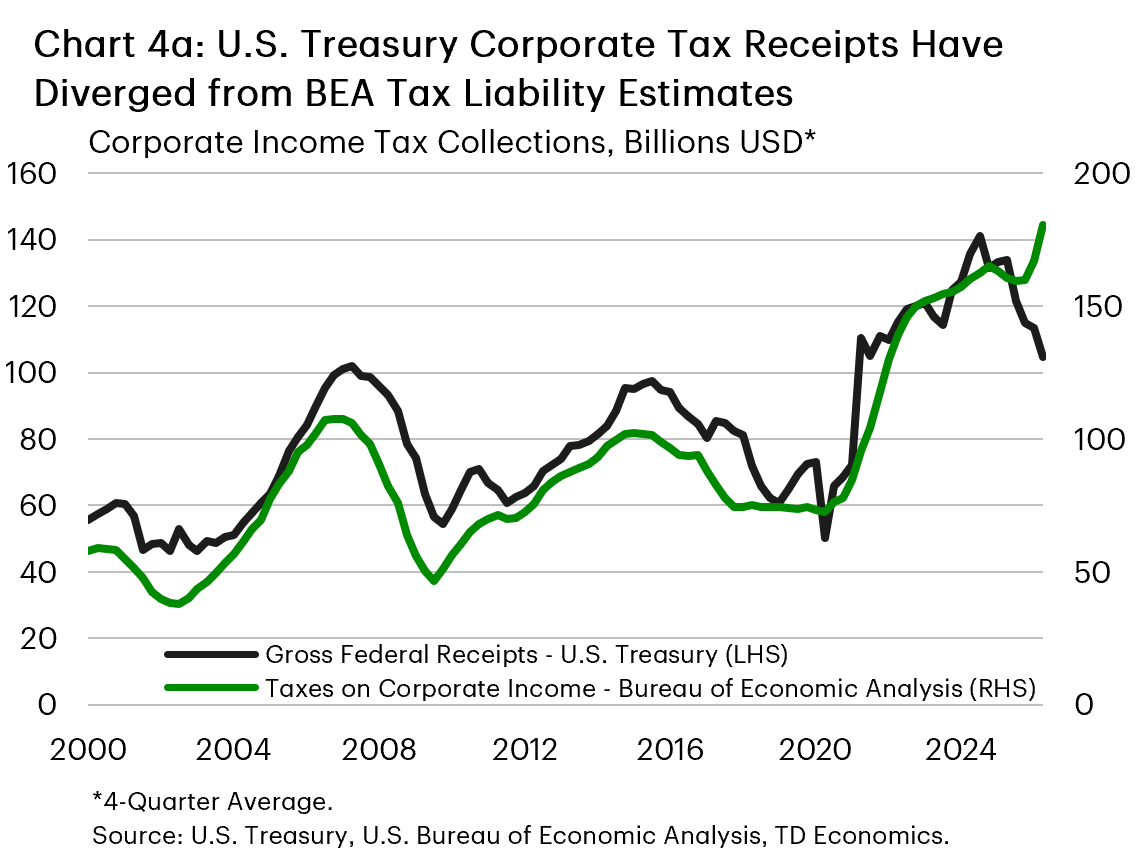
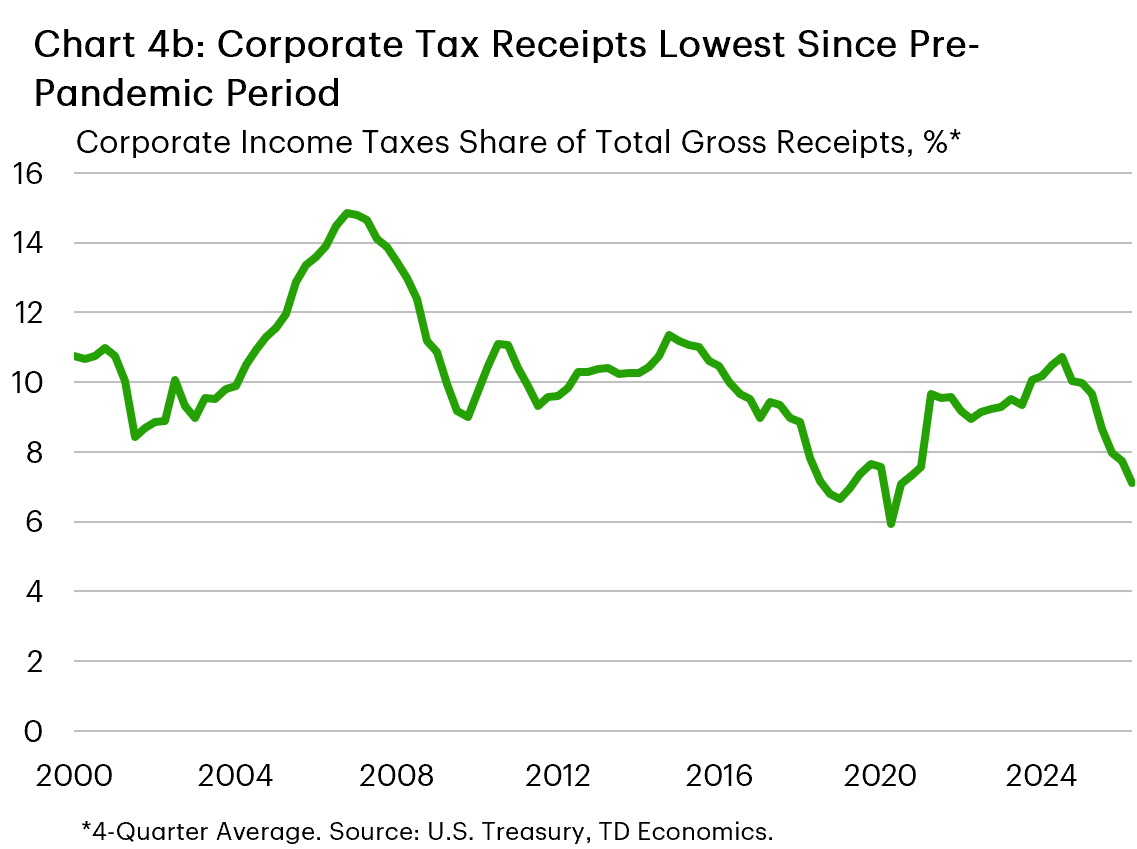
The analysis to this point has focused on pre-tax profits, but recent corporate tax policy changes are also affecting after-tax cash flow. The BEA estimates corporate tax liabilities within the national accounts, while the U.S. Treasury reports cash collections. These measures have recently diverged, reflecting differences in timing, accounting concepts, and source data (Chart 4a). The decline in Treasury collections began in the second half of 2025, broadly coinciding with the passage of the One Big Beautiful Bill Act. The legislation restored 100% bonus depreciation and expanded other expensing provisions, allowing businesses to accelerate deductions associated with qualifying investment. These provisions likely reduced near-term tax payments, although their contribution cannot be isolated from the aggregate receipts data alone. This has coincided with a decline in the share of federal tax receipts coming from corporate income taxes, which are now at their lowest level since the pre-pandemic period (Chart 4b). Combined with exceptionally strong pre-tax profit growth, lower near-term cash tax payments have provided an additional boost to corporate after-tax cash flow despite notable headwinds from higher energy prices and interest rates.
While these developments enhance the position of U.S. corporations, the increase in NFC profits has also coincided with a decline in the share of NFC income going to labor. In the latest data, the labor share of NFC income sat at 54.7%—its lowest level on record—after falling by 2.5 percentage points over the past 18 months. This also marks the sharpest decline in this series outside of a recession. It is highly unlikely that this development is a harbinger of an impending recession, but the shift in income away from labor should be monitored closely given its implications for the distribution of income.
Corporate Profits & the Economy
Corporate profits interact with the economy across multiple channels. Historically, higher profits have correlated with higher investment activity, as businesses used their earnings to expand operations and production. This typically also leads to stronger hiring activity as the expanded production footprint requires more workers. At the same time, higher profits strengthen corporate balance sheets and support equity valuations, which in turn boosts the financial position of households that hold corporate equities.
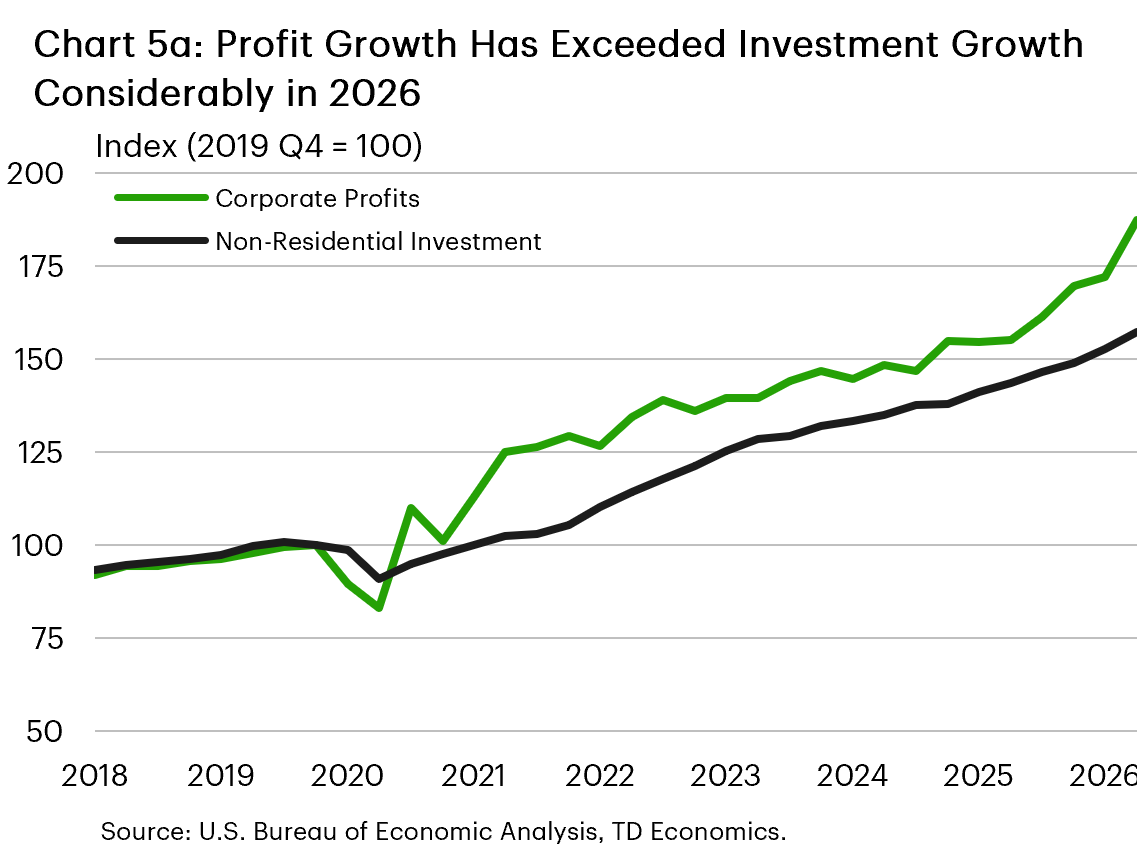
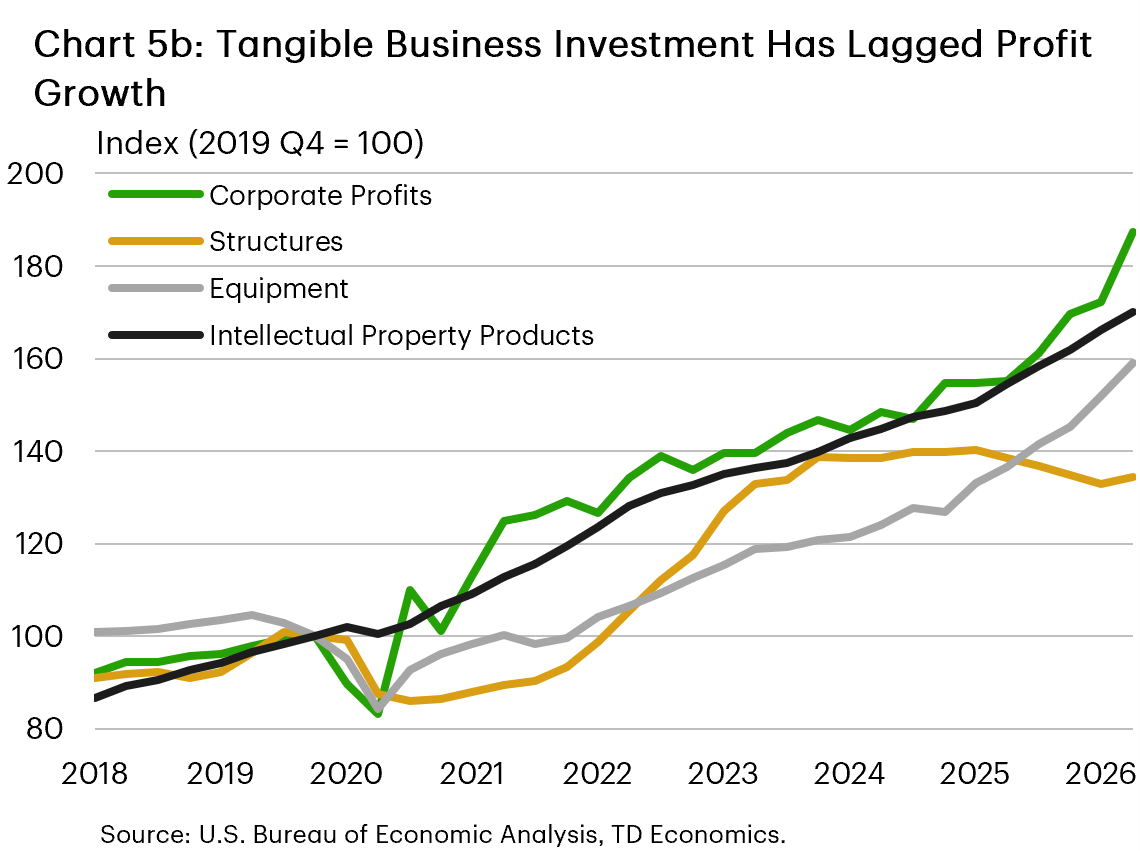
Looking at the growth in corporate profits and non-residential investment over the 2019-2024 period, the trends look relatively standard on the surface, with investment growth converging with profit growth over the long run (Chart 5a). However, looking under the surface, the details are more nuanced. First, the convergence was largely led by a sharp rebound in the structures component of non-residential investment in 2022-2023 (Chart 5b), when fiscal legislation like the CHIPS & Science Act and Inflation Reduction Act were encouraging private investment in semiconductor and green technology manufacturing. While the private investment still occurred, the role of fiscal incentives suggests that the convergence between profit and investment growth may have been weaker in their absence. This raises questions about how much of the latest increase in profits will translate into additional business investment without comparable policy support.
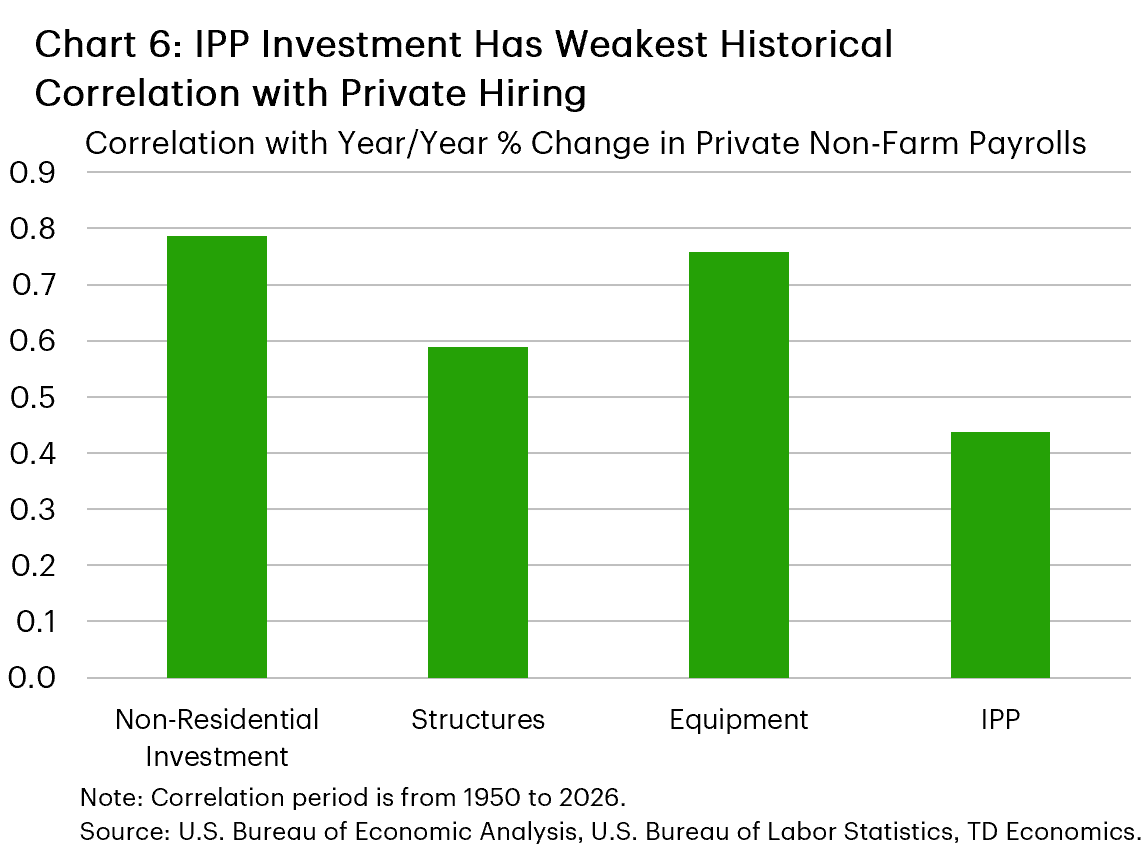
Second, a notable proportion of the increase in investment activity since 2019 has been in intellectual property products (IPP), which historically have had the weakest correlation with private hiring activity among the three major subcategories of non-residential investment—structures, equipment, and IPP (Chart 6). Furthermore, over 60% of the increase in equipment investment since 2019— which accounts for nearly as large a share of the increase in non-residential investment as IPP—has been in information processing equipment. This category also has the weakest historical relationship with private hiring among the four major equipment subcategories, with its correlation only modestly exceeding that of IPP investment. Cumulatively, IPP and information processing equipment investment have accounted for over 70% of the total growth in non-residential investment since 2019, suggesting that the employment response may be less pronounced than that following earlier investment cycles.
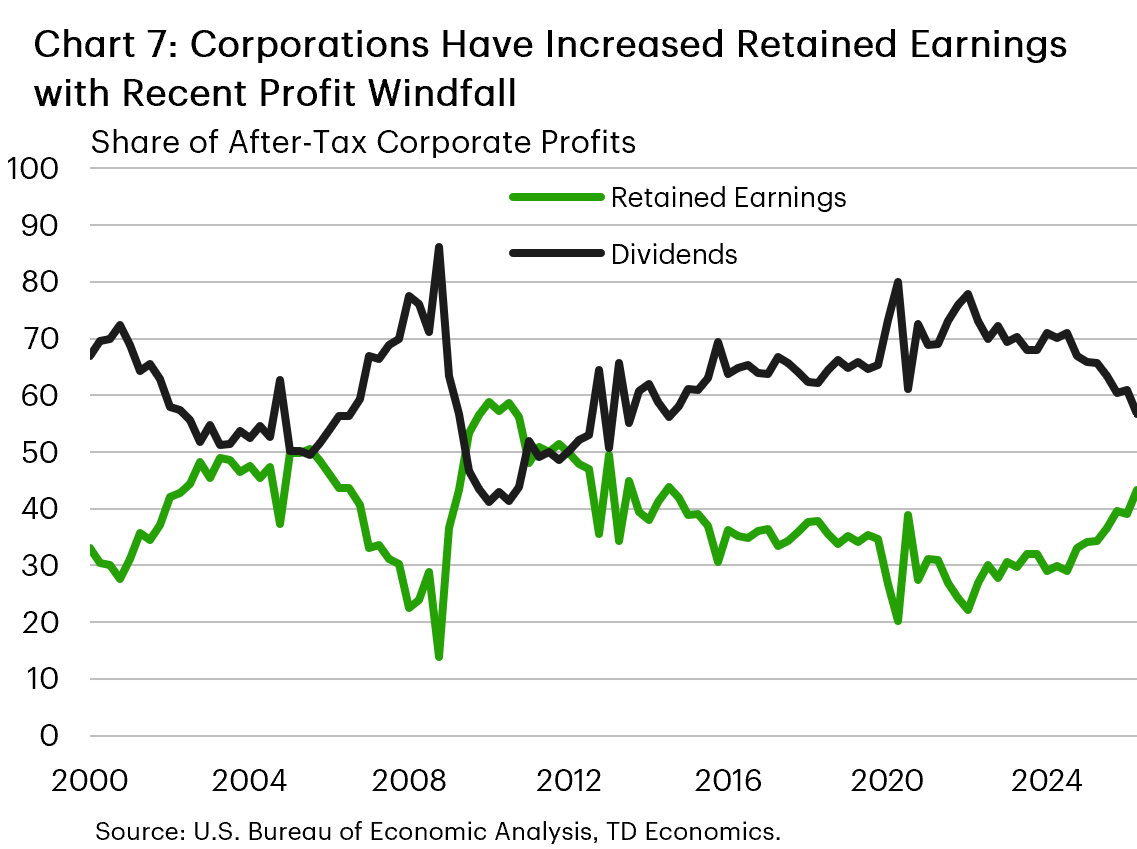
The allocation of after-tax profits between dividends and retained earnings has also shifted recently. Between 2019 and 2025, the allocation of after-tax profits remained relatively stable, with roughly 70% paid out as dividends and 30% retained. Beginning in 2025, however, the gap narrowed, reaching 57/43 in favor of dividends in 2026Q2 (Chart 7). This is the lowest share of after-tax profits allocated to dividends since 2014, and could reflect a growing preference for corporations to maintain a larger financial buffer amid persistent uncertainty. Note that share buybacks as a share of after-tax profits have not changed materially relative to the pre-pandemic period, meaning that these profit gains are largely remaining on the books of corporations.
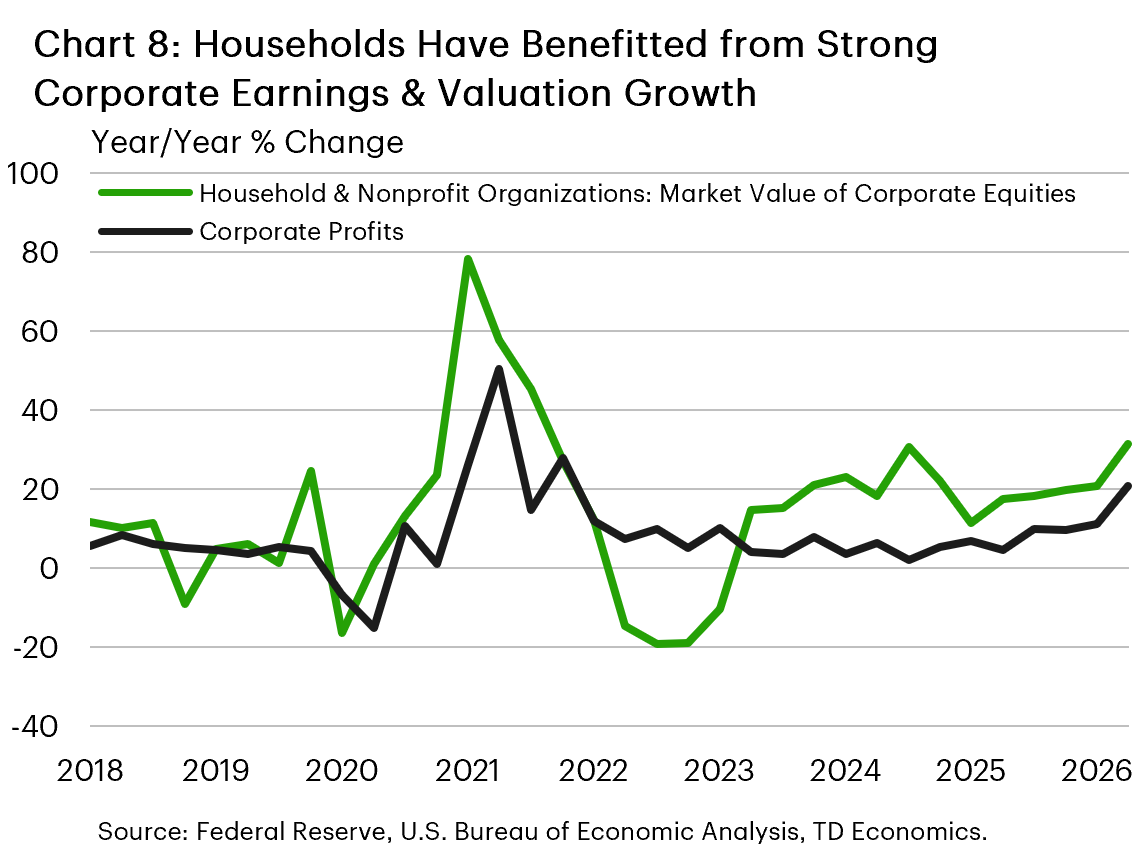
Despite these developments, exceptionally strong profit growth has coincided with considerable financial-asset appreciation, reinforced by rising valuations as investors have increased their expectations for future earnings. Combined, strong profit growth and rising valuations have contributed to sizable increases in the market value of household corporate-equity holdings, which has grown by roughly 20% per year over the past three years (Chart 8). This has strengthened household wealth and may have supported consumer spending, although the gains have disproportionately accrued to households with significant equity exposure. The ability of this wealth channel to support consumer spending is likely to be tested as energy prices remain elevated and credit conditions tighten.
How Long Could the Profit Cushion Hold?
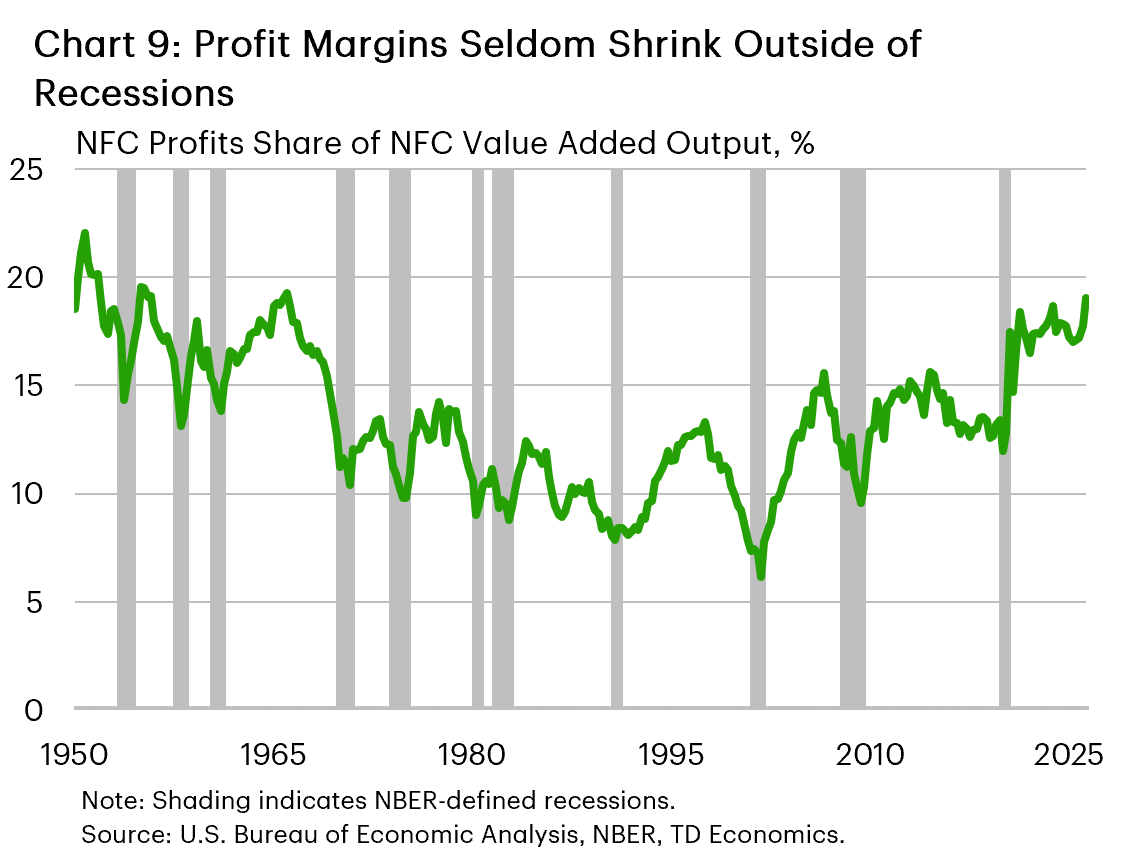
Economic slowdowns are historically the clearest source of sustained pressure on corporate profits. The relationship is strong enough that profit margins have historically served as a leading indicator for recessions (Chart 9). However, the economy has remained robust since the pandemic, which has allowed profit margins to maintain their pandemic-era gains and even build upon them more recently. The outlook has become more complicated, however. AI-related profits remain strong but face questions about their sustainability, while higher energy prices and tighter credit conditions are creating broader headwinds for businesses.
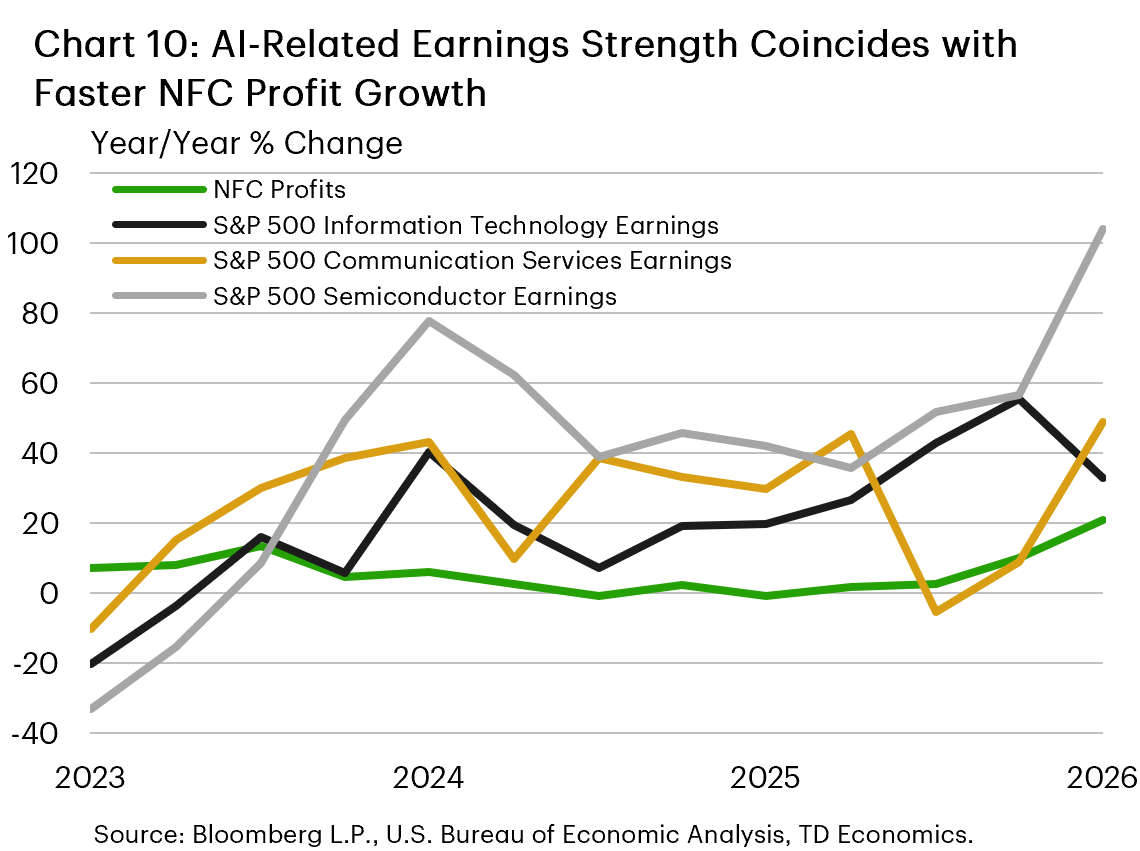
Exceptionally strong profit growth among AI-related companies has provided a significant tailwind. Earnings growth in the information technology and communication services sectors of the S&P 500 has averaged 20-30% over the past few years, while the semiconductor industry has seen growth roughly double that pace, even breaching 100% in the most recent quarter (Chart 10). One element of this strength has been expanding profit margins, with margins in the information technology and semiconductor industries 10-15 percentage points higher than they were in 2022. Although this has boosted corporate balance sheets and financial asset prices, it has also coincided with renewed inflationary pressure across several consumer and enterprise technology products (see here). Sustaining these gains will ultimately require large technology companies to generate sufficient returns on the trillions of dollars being invested in AI infrastructure. Whether end demand can grow quickly enough to validate this spending remains an open question.
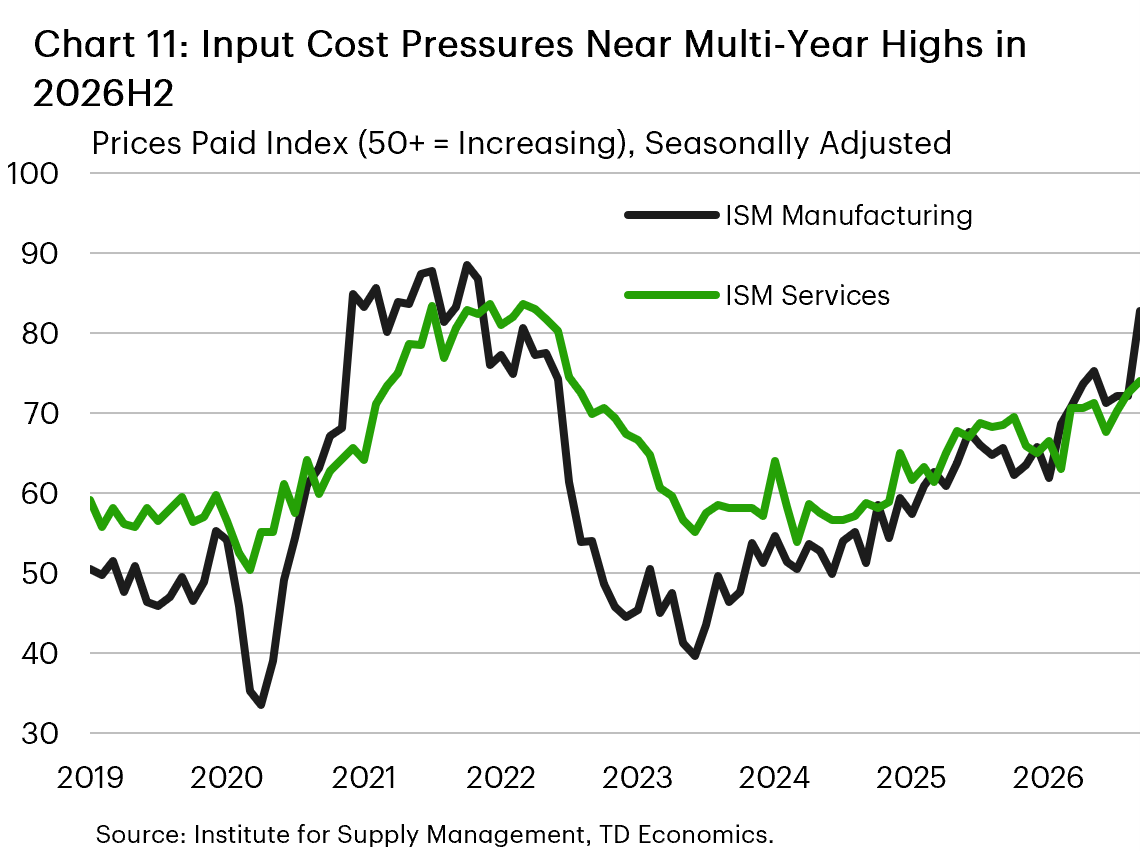
Beyond AI, the economy is also contending with the impact of higher energy prices. While higher energy prices have benefited the domestic energy industry, which is recording strong profit growth, they remain a headwind for the broader corporate sector (Chart 11). In addition to the pressure that this will add to input costs, it will also likely weigh on demand, with real wages now in decline. This in turn could limit the ability of businesses to pass on higher costs to consumers, which could ultimately lead to narrower corporate profit margins. At the same time, corporations will also continue to face pressure from higher financing costs, with U.S. Treasury yields up by roughly 110 basis points relative to where they sat prior to the onset of the Iran conflict in late February. Non-financial corporate debt as a share of GDP remains below its pre-pandemic level, supported by stable spreads relative to U.S. Treasury yields, but tighter credit conditions are still expected to weigh on investment activity over the near term.
Bottom Line
Corporate profits have reached multi-decade highs, supported by wider margins and strength in AI-related industries, while recent tax changes have provided an additional boost to after-tax cash flow. These gains have supported corporate balance sheets, investment, and household wealth, but their broader economic benefits have been uneven as spending has shifted toward less labor-intensive assets and labor’s share of income has declined. Higher energy prices, tighter credit conditions, and uncertainty surrounding returns on AI investment could place the profit cushion under greater pressure, with its durability ultimately depending on the economy avoiding a more pronounced slowdown.
Disclaimer
This report is provided by TD Economics. It is for informational and educational purposes only as of the date of writing, and may not be appropriate for other purposes. The views and opinions expressed may change at any time based on market or other conditions and may not come to pass. This material is not intended to be relied upon as investment advice or recommendations, does not constitute a solicitation to buy or sell securities and should not be considered specific legal, investment or tax advice. The report does not provide material information about the business and affairs of TD Bank Group and the members of TD Economics are not spokespersons for TD Bank Group with respect to its business and affairs. The information contained in this report has been drawn from sources believed to be reliable, but is not guaranteed to be accurate or complete. This report contains economic analysis and views, including about future economic and financial markets performance. These are based on certain assumptions and other factors, and are subject to inherent risks and uncertainties. The actual outcome may be materially different. The Toronto-Dominion Bank and its affiliates and related entities that comprise the TD Bank Group are not liable for any errors or omissions in the information, analysis or views contained in this report, or for any loss or damage suffered.