Highlights
- U.S. consumer spending has lost momentum. Inflation-adjusted consumption has been flat since December and growth is expected to remain sub-par through the middle of next year amid heightened economic uncertainty, a slowing labor market, higher inflation and other headwinds.
- Indeed, labor market conditions have weakened noticeably, as hiring slowed to a crawl and job gains have become concentrated in a handful of sectors.
The full impact of tariffs on consumer prices is taking longer to materialize. However, tariff-driven inflation is still set to build, with core goods prices projected to rise and keeping core inflation slightly north of 3% through mid-2026. - In addition, broader structural headwinds—including resurgent student loan burdens, tighter immigration policy, and a stagnant housing market—are further constraining consumer activity, reinforcing a cautious outlook through the first half of 2026.
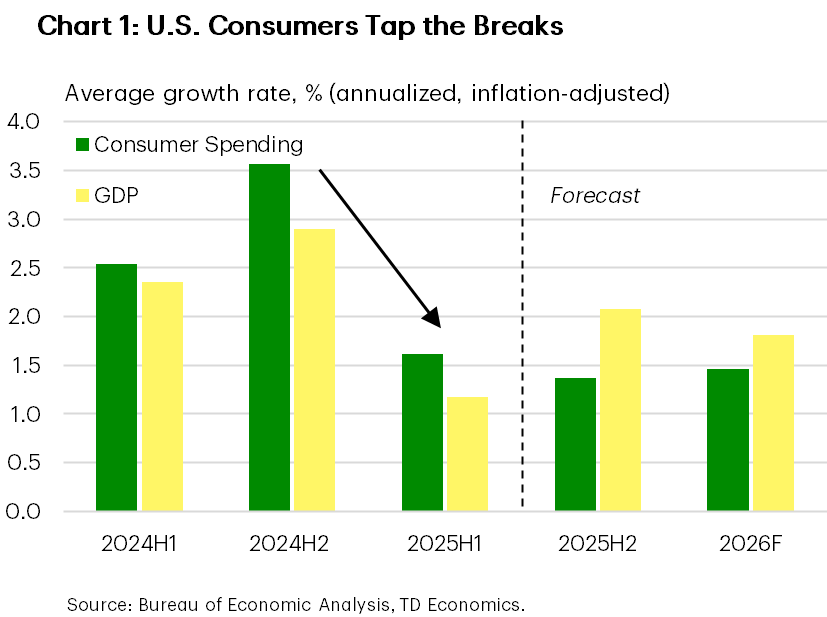
Dramatic changes in tariff policies and increased economic uncertainty have created turbulence in U.S. consumer spending this year. Early on, households accelerated purchases of many goods in anticipation of tariff hikes, leaving a spending lull in later months. When you look past these ups and downs, you see a clear slowdown: consumer spending grew at just a 1.6% annualized rate in the first half of the year, less than half of the 3.6% rate seen in the second half of 2024 (Chart 1).
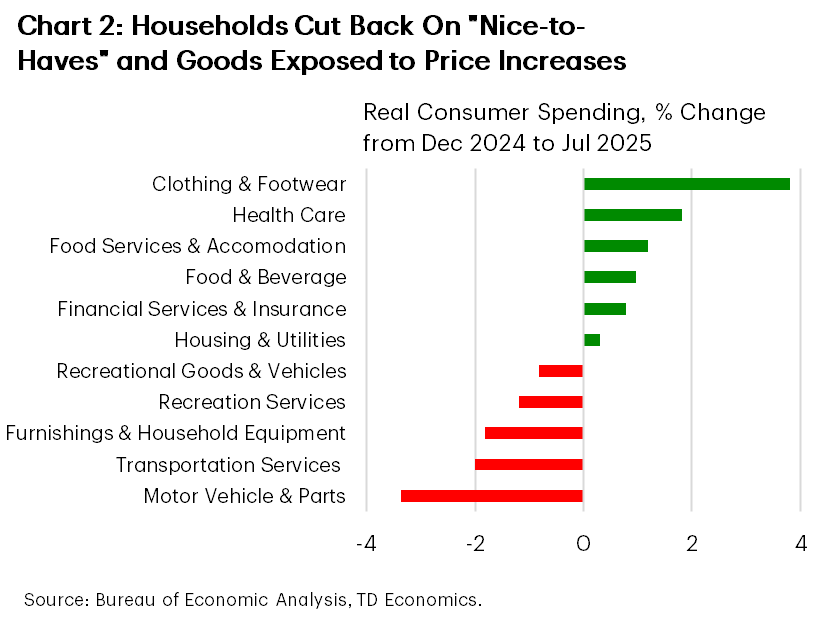
This slowdown is especially evident in discretionary spending, which is a warning sign for the broader economy. Several challenges are holding households back: a cooling job market, elevated uncertainty, tighter immigration policy, and higher prices. So far, most of the pullback has come from reduced spending on optional services—like travel, recreation, and transportation—showing people are being more cautious. Purchases of tariff-affected goods, like furniture and auto parts, have also dropped (Chart 2).
Monthly data reveals that much of the recent increase in consumer spending is attributable to higher prices. When adjusted for inflation, actual consumption has remained largely flat from December 2024 to July 2025. This suggests that consumers are highly sensitive to price changes.
All things considered, the combination of a softer labor market and rising prices alongside other headwinds is likely to keep consumers cautious through the remainder of this year and into 2026.
Labor Market Cooling Off
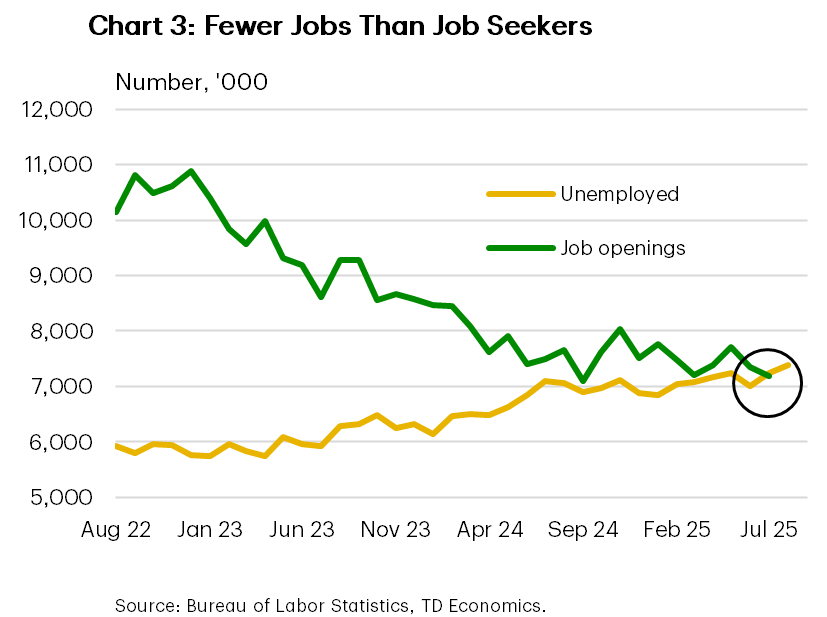
The writing has been on the wall for several months now - the U.S. job market is quickly slowing down. Recent major downward revisions to payrolls data help explain why the soft consumer spending data seemed disconnected from earlier employment reports. Revised numbers now show that job growth has been tepid since May. Over the past four months, hiring has averaged just 27,000 jobs per month, which is an anemic pace of job creation for the U.S. economy. New jobs have also become narrowly concentrated in a handful of non-cyclical sectors, such as education and health care, but even in those sectors job gains have been falling. In June, the number of job openings fell below the number of unemployed for the first time since 2021—though the margin has been narrow since mid-2024, also suggesting that it is getting harder for job seekers (Chart 3).
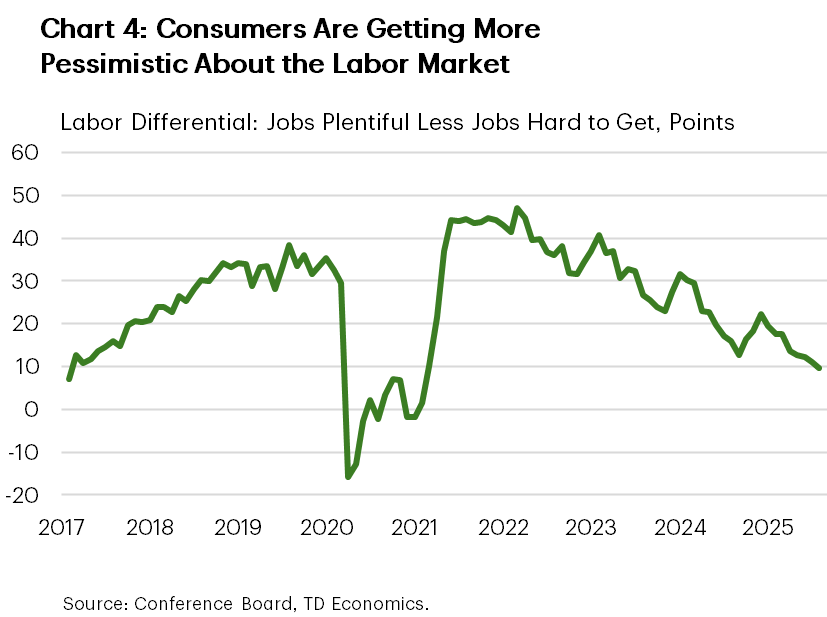
The unemployment rate has so far held relatively steady (up only 0.1 percentage point since a year ago) even as hiring slowed because there are fewer people looking for work, with reduced immigration playing a big part. Still, the steady unemployment rate does not undo the reality that the hiring rate remains weak. Consumers are taking notice: they are holding on to their jobs longer as they become increasingly pessimistic about job prospects. According to the latest Conference Board data, the gap between respondents who say jobs are “plentiful” versus “hard to get” is at its lowest level in more than eight years (excluding the pandemic period) (Chart 4).
Facing heightened economic uncertainty and higher costs, some companies are also using AI to automate tasks, reducing the need to hire, particularly for the entry-level jobs. While hard to quantify, these trends are popping up in the Fed’s Beige Book1 and in corporate earnings calls2.
On the bright side, income growth has continued to outpace inflation; however, here too the gap between the two has been narrowing, squeezing growth in real disposable income. By the second quarter of 2026, growth in inflation-adjusted disposable income is expected to slow to just 1.1% year-over-year, down from 2% in the second quarter of 2025 and 2.8% last year. An acceleration in inflation alongside a weakening labour market will erode household purchasing power, forcing consumers to keep their purse strings tight in the second half of this year and at the start of 2026.
Not the Most Consumer-Friendly Environment
Beyond tariffs and labor market issues, several other factors are affecting consumption.
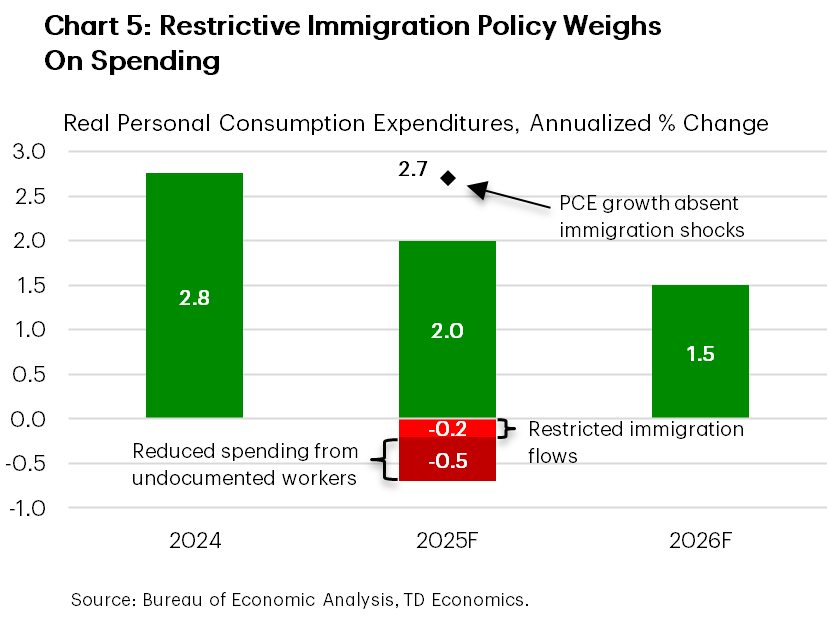
- Immigration & Population Growth: Slower population growth and the immigration clampdown have no doubt been a factor in slower consumer spending. We estimate that lower immigration and reduced spending by undocumented workers, who now work less and spend more time at home because of fear of being deported, will subtract 0.7 percentage points from consumer spending growth this year (Chart 5), pulling it below 2% on a Q4/Q4 basis.
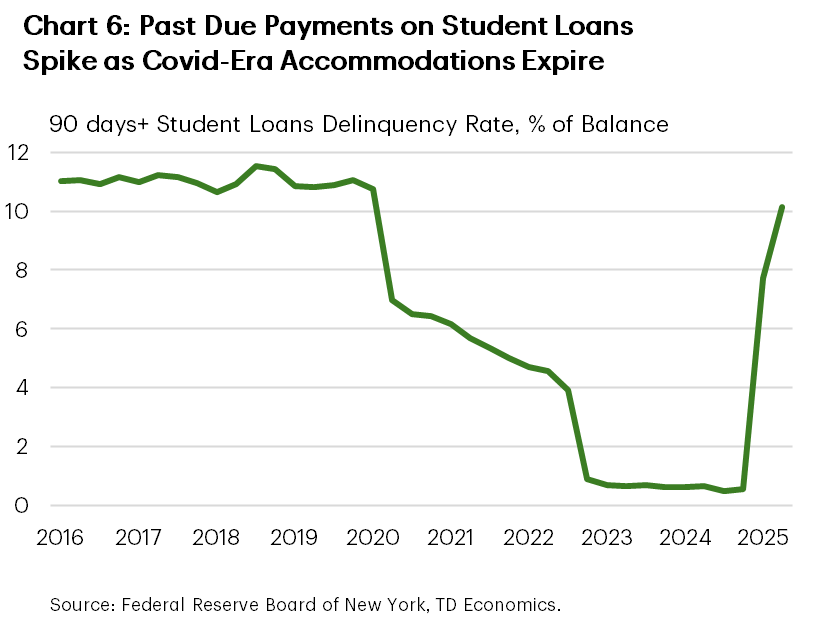
- Student Loans: The resumption of student loan payments and the reporting of past-due accounts to credit bureaus have led to a sharp rise in delinquencies (Chart 6). Defaults are expected to exceed pre-pandemic levels by year-end, with serious credit score implications for millions of borrowers. Some impacts will unfold gradually, as recent student debt reforms introduced in the OBBBA lead to higher monthly payments for many borrowers.
- Housing Market: A slump in the housing sector is also weighing on consumer spending. Home sales typically generate consumer spending on household items and renovations. However, with existing home sales stuck near post-Great Recession lows, this means lower housing-related outlays. Next year will bring a modest reprieve to the housing market with borrowing costs set to decline. This will help new home buyers but provide little impetus for existing homeowners to sell or refinance, many of whom have refinanced at low rates during the pandemic.
- OBBBA tax cuts: Offsets will come from the OBBBA’s new tax measures—such as eliminating taxes on tips and overtime, making auto loan interest deductible, and providing a $6,000 deduction for seniors (see report). However, these changes will only partially offset the impact of higher consumer prices as tariffs snake through business cost structures. Analysis by the Budget Lab found that only for households in the top 10% of the income distribution does the positive impact of the OBBBA outweighs the negative impact from tariff increases.3
Sticker Shock Is Yet to Come
It’s important to note that the full impact of tariffs on inflation is taking longer to materialize than initially assumed. As we discuss in our recent report, because new tariff policies have been volatile, many businesses likely delayed passing costs on to consumers in case tariffs proved temporary, particularly given that consumers are currently highly sensitive to price changes. Firms also ramped up inventories ahead of tariffs, delaying the need to pass on cost increases. Furthermore, businesses have shifted away from highly tariffed Chinese goods to sourcing their supplies from countries with lower tariffs. As of June, Chinese imports into the U.S. were down 45% year-over-year.
Apart from China, most countries were only subject to a 10% tariff or less between April and early August. Even after the reciprocal tariff increases implemented in August, any cargo shipped before mid-August is still taxed at the old rate. This means it will take several months for these higher costs to show up on store shelves.
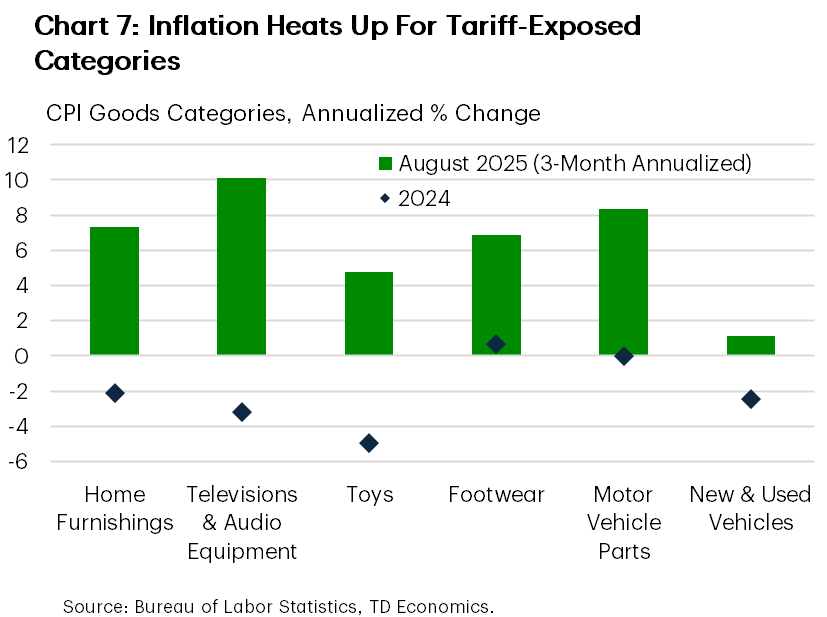
Nonetheless, we’re already seeing tariffs push up the prices of certain goods—a change from last year’s trend. The biggest price increases are in categories heavily impacted by tariffs, such as home furnishings, toys, televisions, footwear, and auto parts (Chart 7). One exception is the auto sector, where prices didn’t rise much yet as dealerships increased inventory ahead of tariffs, and automakers absorbed higher input costs. But by the time 2026-model vehicles arrive in September through October, expect higher prices.
All in all, we expect core goods prices to climb steadily through 2026, peaking at about 4–5% year-over-year by mid-year. While this is lower than the post-pandemic surge of +12%, it’s much higher than recent years or pre-pandemic averages. We estimate that if tariffs are sustained at today’s level and half of the tariff costs are passed on to consumers, the average household’s cost of living will rise by about $2,500 annually from today’s level. This impact is only partially offset by the tax cuts in the OBBBA mentioned above.
Bottom Line
After several months marked by policy shocks and uncertainty, the American consumer is showing signs of strain with real consumption flatlining and discretionary purchases falling off. Households are feeling the squeeze from many sides: a weakening job market, still-high borrowing costs, higher bills on student debt, and a restrictive immigration policy. Higher prices due to tariffs are taking longer to materialize, but they too are expected to hit consumer spending power at the tail-end of this year, with inflation rising above 3% and staying there until the middle of 2026. Tax cuts in the OBBBA will provide some modest reprieve but that will show up in households’ bank accounts only during the next year’s tax filing season. All in all, consumers are expected to stay on a cautious footing, with growth in consumer spending staying below 2% until the second half of 2026, when headwinds and uncertainty will begin to abate.
End Notes
- Federal Reserve. The Beige Book: Summary of Commentary on Current Economic Conditions by Federal Reserve District: August 2025. Federal Reserve System. https://www.federalreserve.gov/monetarypolicy/files/BeigeBook_20250903.pdf
- Francis, Theo. (2025, September 2). Behind this season’s bumper earnings: Job cuts, price hikes, glum workers. The Wall Street Journal. https://www.wsj.com/business/earnings-cost-cutting-productivity-e022418a?mod=djem10point The Wall Street Journal
- The Budget Lab at Yale. (2025, August 12). Combined distributional effects of the One Big Beautiful Bill Act and of tariffs. Yale University. Retrieved from https://budgetlab.yale.edu/research/combined-distributional-effects-one-big-beautiful-bill-act-and-tariffs-0
Disclaimer
This report is provided by TD Economics. It is for informational and educational purposes only as of the date of writing, and may not be appropriate for other purposes. The views and opinions expressed may change at any time based on market or other conditions and may not come to pass. This material is not intended to be relied upon as investment advice or recommendations, does not constitute a solicitation to buy or sell securities and should not be considered specific legal, investment or tax advice. The report does not provide material information about the business and affairs of TD Bank Group and the members of TD Economics are not spokespersons for TD Bank Group with respect to its business and affairs. The information contained in this report has been drawn from sources believed to be reliable, but is not guaranteed to be accurate or complete. This report contains economic analysis and views, including about future economic and financial markets performance. These are based on certain assumptions and other factors, and are subject to inherent risks and uncertainties. The actual outcome may be materially different. The Toronto-Dominion Bank and its affiliates and related entities that comprise the TD Bank Group are not liable for any errors or omissions in the information, analysis or views contained in this report, or for any loss or damage suffered.
Download
Share: