U.S. Automotive Outlook 2026:
Energy Price Shock Raises New Questions for Industry
Andrew Foran, Economist | 416-350-8927
Date Published: April 17, 2026
- Category:
- U.S.
- Commodities & Industry
Highlights
- U.S. light vehicle sales are expected to fall modestly to 16 million units in 2026, as fiscal support helps to counter broader headwinds.
- Gasoline prices above $4/gallon - up ~40% since late February - could weigh on demand and shift the mix away from less fuel-efficient vehicles if sustained.
- The continued passthrough of tariff costs to consumers, in addition to the uncertainty surrounding the upcoming USMCA review are likely to remain challenges for the industry.
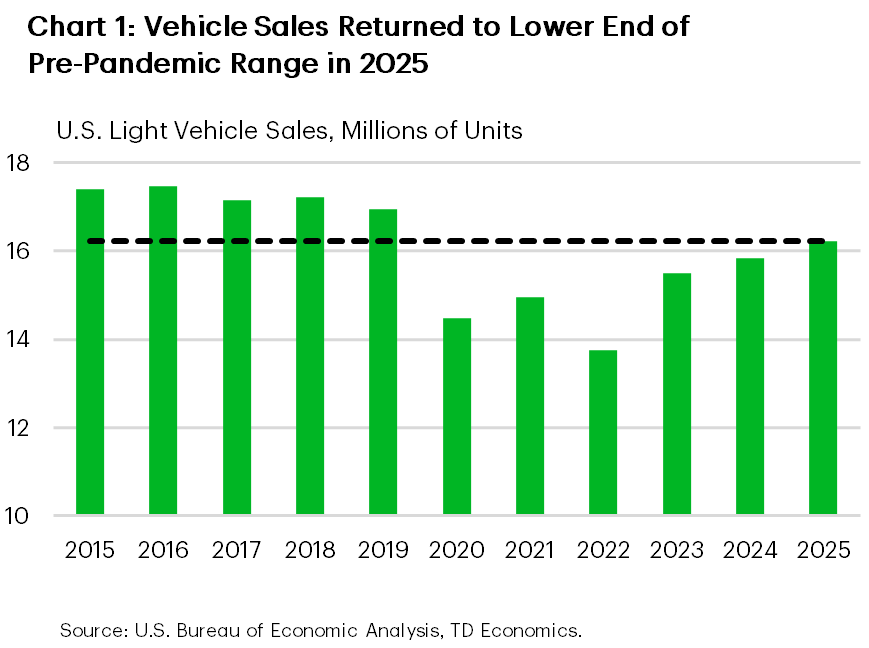
The U.S. automotive industry had a solid 2025 on aggregate, with sales rising 2.2% to a new post-pandemic high (Chart 1). However, the industry was also subject to notable volatility, as the implementation of tariffs and the expiration of electric vehicle (EV) subsidies led to significant and episodic front-loading of purchases by consumers. Sales activity over the past 6 months has remained stable overall, with support provided by lower financing rates, but 2026 is shaping up to be another year of volatility.
The notable increase in oil prices since the start of the conflict in the Middle East at the end of February has led to material impacts on domestic gasoline prices. The national average for gasoline prices is now above $4/gallon – the highest level since the 2022 Russian invasion of Ukraine. While the duration, and by extension the ultimate impact of the oil price shock, remains unknown, it would be expected to become a material headwind for the automotive industry should it be prolonged.
Aside from the recent developments in the Middle East, the U.S. automotive industry also continues to contend with the impacts of varied tariff policies. While the level of tariffs on automobiles is lower today than it was one year ago when the tariffs were first introduced, it remains higher than it was at the start of 2025. Higher production costs related to the tariffs have been partially offset by increases in vehicle prices, but the ability of automakers to continue to pass on these costs may be curtailed by higher consumer price sensitivity related to higher energy prices. The industry will also be closely monitoring the first USMCA review later this year, with the potential for positive or negative developments on the trade policies. Summarily, we expect vehicle sales to modestly exceed 16 million units again in 2026 but note that risks to the outlook remain fraught.
U.S. Vehicle Sales Enter 2026 on a Softer Footing
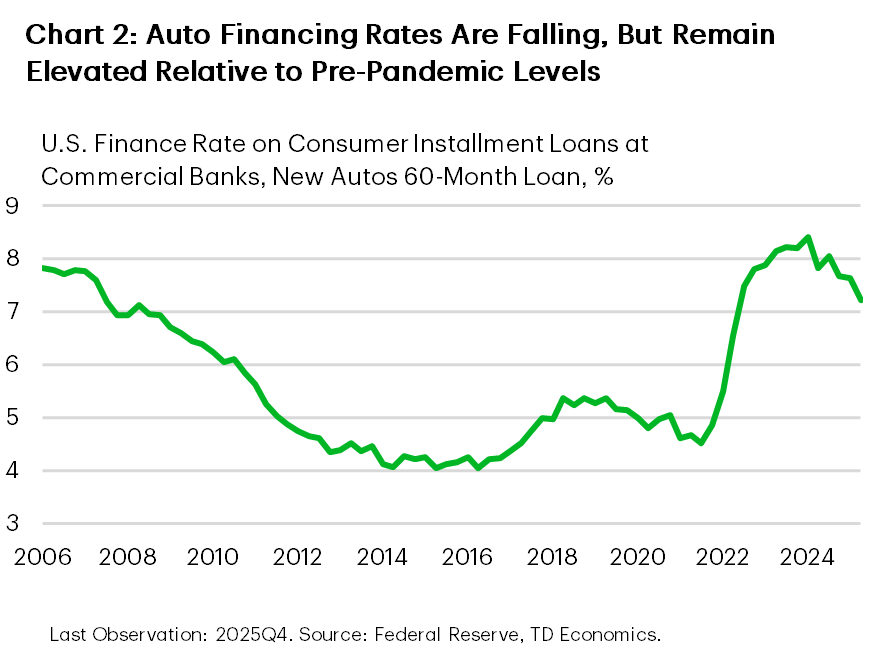
Vehicle sales in 2025 came in above 16 million units, putting sales squarely back into the pre-pandemic range. Solid economic growth, robust income and wealth gains, and a modest decline in interest rates (Chart 2) all helped to keep vehicle sales on a stable footing despite elevated uncertainty. However, uncertainty still led to notable volatility in sales activity, with strength concentrated earlier in the year as consumers took advantage of pre-tariff pricing and federal EV subsidies while they remained in effect. By the fourth quarter, the EV subsidies had expired, resulting in a material drop in sales in this category. At the same time, new model year vehicles were rolling onto dealer lots, with many incorporating higher production costs related to tariffs. Combined, this led to a 5% decline in sales in the fourth quarter (Chart 3).
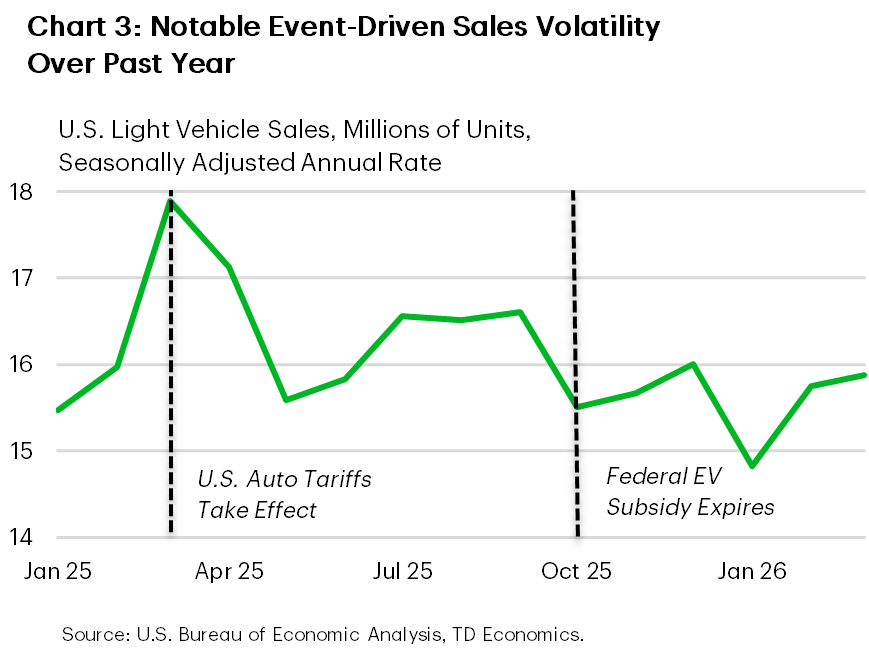
Shifting into 2026, the first quarter was on course to recover from its Q4 dip, but inclement weather across much of the nation in January weighed on sales during the month. February and March were more stable, but the impacts of higher energy prices will likely become a greater factor over the coming months.
Gas Prices Broach 2022 Highs on Oil Price Spike
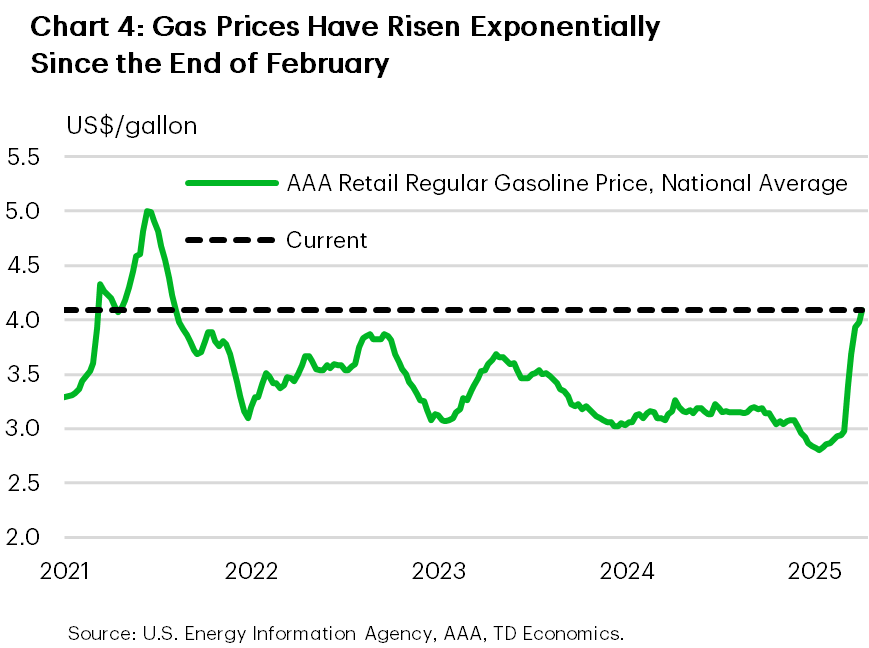
The evolving conflict in the Middle East between the U.S., Israel, and Iran has led to a sharp increase in the price of crude oil. This in turn has pushed gasoline prices higher. Since the end of February, gas prices have risen by nearly 40% to more than $4/gallon at the end of March (Chart 4). While news of a 2-week ceasefire in early April is a positive development for global energy markets, energy prices are still expected to remain elevated relative to the levels recorded prior to the conflict. This is both a function of the near-term uncertainty regarding a sustained end to the conflict and the likelihood for markets to price in a higher premium owing to the potential for supply disruptions to reoccur in the future. Outside of the macroeconomic impact of higher energy costs on household and business finances, this may also lead to impacts on the demand for motor vehicles.
Historically, it has taken several months for elevated energy prices to influence vehicle consumption trends. However, this is also the second energy price shock in the past 5 years, which could shorten the feedthrough to consumer expectations and decisions. The extent to which this shock impacts consumers will likely be less than past episodes, as vehicles have become less sensitive to energy price shocks in recent decades. This is likely because of enhancements to fuel efficiency standards and the rising share of the market accounted for by alternatives to internal combustion engine vehicles. In many ways, past energy price shocks were a notable catalyst for these structural developments designed to partially insulate domestic consumption from global energy price shocks. Nevertheless, a 40% increase in gasoline prices, if sustained, would likely act as a headwind on sales activity over the coming months.
It’s important to keep in mind that the duration of the spike in energy prices will be the main determinant of the impact on the automotive industry and the broader economy. If the conflict in the Middle East is sustainably resolved over the near term and energy prices fall over the coming months, the impact would likely be modest for the year. Alternatively, if the price shock intensifies or lingers, then demand destruction would likely occur. Both scenarios would also likely include segmental reallocation of demand, with larger, less fuel-efficient vehicles losing market share. Note that a prolonged energy shock would also likely incorporate a more material slowdown in economic growth, a softer labor market, and a less accommodative Federal Reserve, which cumulatively would also weigh on vehicle sales. Our baseline is for slower sales activity over the coming months, followed by a rebound through year-end as global energy shipments normalize and fiscal policy supports demand. Provisions in the One Big Beautiful Bill are expected to improve tax returns for many households this year, which, when combined with the new deduction for auto loan interest payments, should help to partially offset emerging headwinds. However, energy prices are still likely to remain elevated through this year, which we expect to shave just under 2 ppts off sales growth for the year, putting sales slightly above 16 million units. In a more adverse scenario where energy prices remain higher for longer, we would expect greater demand destruction and a sales reading for the year in the 15.5-million-unit range.
Trade Policy in the Sideview, Not Rearview
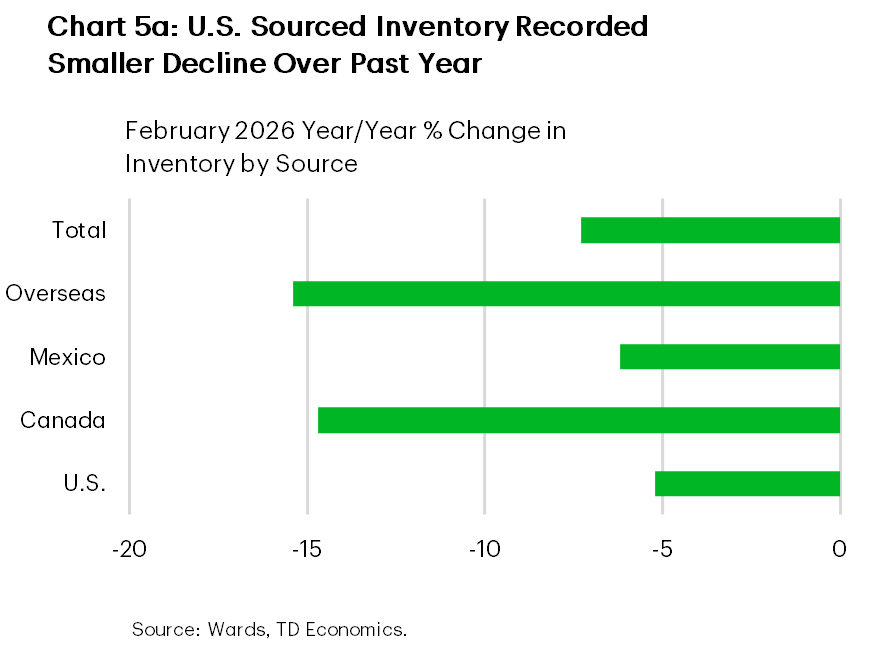
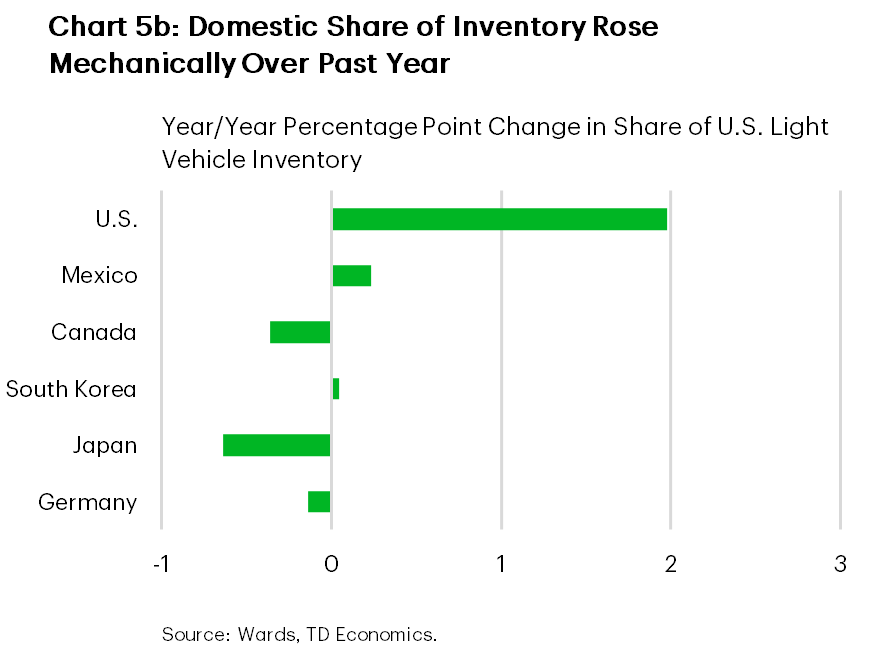
Beyond the energy price developments, the trade background is also still a factor in 2026. Automakers are actively passing on higher production costs to consumers, both directly through vehicle price increases and indirectly through higher transaction fees. Automakers have also taken steps to mitigate tariff exposure, including some reallocation of production. However, this has not taken the form of higher U.S. production; rather, automakers have decreased production across the board but by less in the U.S. This has resulted in slightly tighter vehicle inventory levels. Inventory levels have declined by 7.3% over the past year (Chart 5a), with a smaller decline recorded in U.S.-based inventory (-4.0%) than other North American (-7.8%) and overseas sources (-15.4%). Mechanically, this has increased the share of inventory accounted for by U.S.-produced vehicles (Chart 5b).
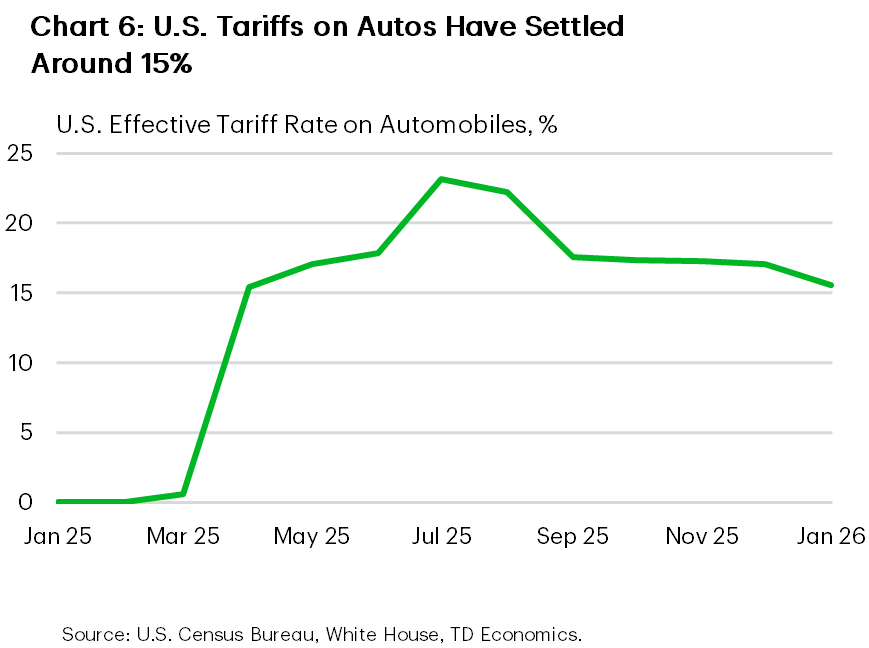
U.S. tariffs on automobiles have settled around 15% globally at the end of last year (Chart 6) and have remained near that level for close to a year. These are Section 232 tariffs and were not affected by the Supreme Court ruling against IEEPA tariffs in February. These tariffs also extend to non-USMCA automobile parts, but the administration provides an exemption that allows up to 15% of the content of domestically produced vehicles to be accounted for by non-USMCA parts. Originally, this exemption was scheduled to be halved this year and then fully eliminated next year, but last October the administration extended the full exemption through April 2030.
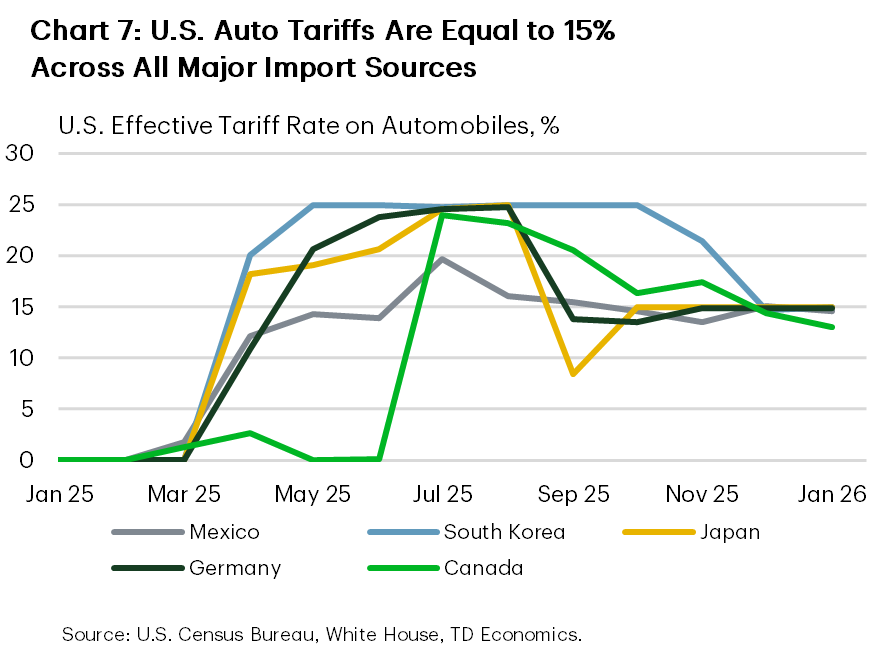
The influence of these tariffs is expected to wane gradually through this year, as the one-time price shock continues to filter through the industry. However, it is important to note that further trade policy modifications are possible and could lead to renewed volatility in the future. Potentially the most consequential trade policy development coming up will be the first review of the USMCA later this year. While the purpose of the review is simply to decide whether the agreement will be extended beyond its expiration date in 2036, the review is shaping up to be a renegotiation of sorts, comparable to the reciprocal tariff trade deals negotiated by the administration over the past year. Currently, Canada and Mexico are subject to the same automotive tariffs as other countries outside of North America (Chart 7), largely defeating the purpose of the USMCA for the automotive industry. Given the magnitude of integration in North American automotive supply chains, it is possible we see lower tariffs from the upcoming USMCA review. However, it is also possible that the review of the agreement results in no changes or potentially even greater intraregional trade restrictions. Cumulatively, 2026 is expected to be another year of elevated uncertainty for the U.S. automotive industry.
Production: Adaptation Amid Waves of Uncertainty
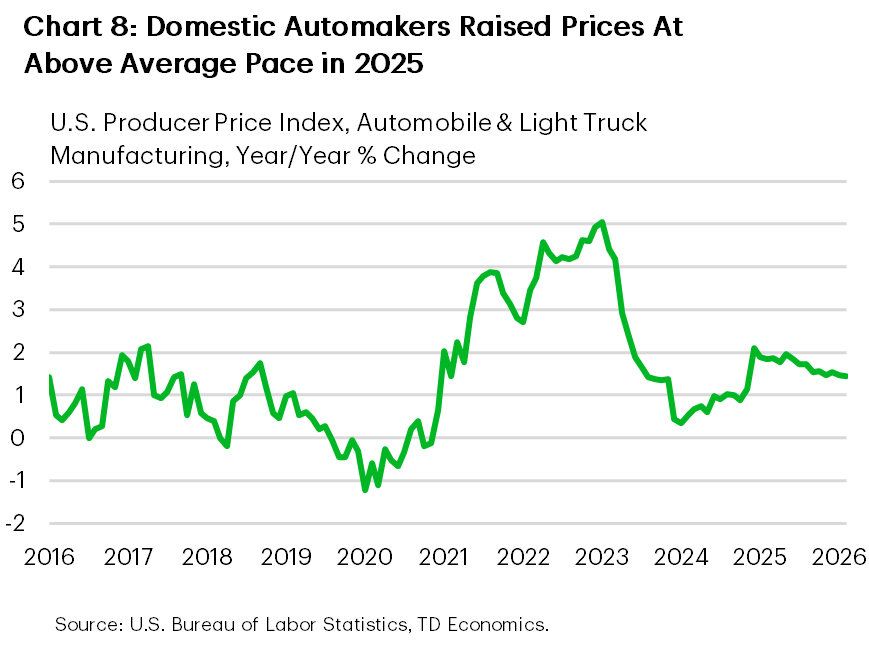
Despite the 2% uptick in U.S. vehicle sales in 2025, U.S. automotive production fell 2% last year. This was related in part to the elevated degree of uncertainty surrounding trade policy for most of the year, in addition to the need for automakers to adapt to the new tariff regime. Although the automobile parts tariffs were offset by the exemptions provided by the administration, the global 50% tariffs on primary metals such as steel, aluminum, and copper all led to notable input cost pressures for domestic automakers. Furthermore, the industry has also faced indirect input cost pressure from the significant increase in artificial intelligence investments, which has driven up the cost of electronic and electrical equipment. These trends have led to higher selling prices on domestically produced vehicles (Chart 8) and are likely to remain a factor in 2026. At the same time, supply disruptions across a host of products (i.e. oil, natural gas, aluminum, plastics, etc.) related to the conflict in the Middle East may also add further upward pressure to input costs.
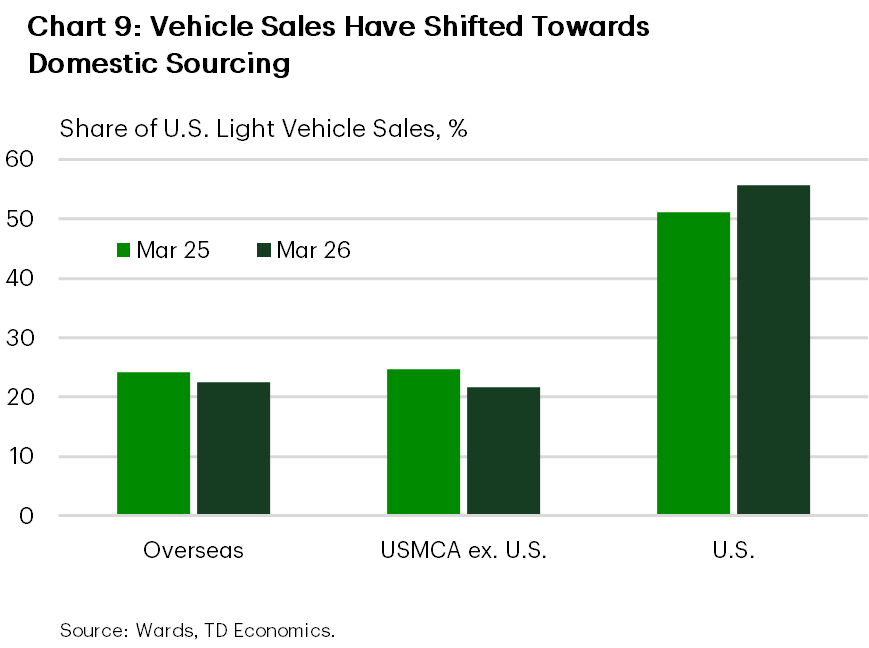
Domestic production accounts for roughly half of the vehicles purchased in the U.S., although this share has been rising modestly under the global tariffs on imported automobiles (Chart 9). The remaining sales are imported, with a roughly 50/50 split within this category between USMCA sources and overseas sources. In volume terms, imports fell by $36 billion year-on-year in 2025, with a roughly even split across Europe, Asia, and North America.
The decline in imports was primarily a mitigation strategy by automakers to limit exposure to tariffs on imports. However, shifting supply chains to alternative sourcing takes time, which is part of the reason why the decline in imports led to tighter inventory levels and not higher production over the near term. Moving forward, production is likely to increase over the long term as automakers have indicated that they will seek to increase domestic production. This will primarily take the form of higher utilization of existing facilities, in addition to investments to increase production capacity. In several instances, automakers have indicated that these production increases will stem from the reshoring of certain vehicle models from Canada, Mexico, Europe, and Asia. While these decisions should support higher domestic output over the medium term, the absence of large-scale greenfield investment suggests U.S. vehicle production is more likely to stabilize near its historical 10–11-million-unit range rather than break meaningfully above it.
Bottom Line
In sum, the U.S. auto market enters 2026 from a position of relative strength after a solid 2025, but the outlook is increasingly shaped by two interlocking sources of uncertainty: the size and persistence of the current energy price shock and the still-evolving trade policy backdrop. Higher gasoline prices risk weighing on consumer demand and limiting automakers’ ability to pass through tariff-driven cost pressures, while the upcoming USMCA review could either ease or exacerbate these constraints. Against this backdrop, we expect sales to slow in the near term and then improve as supply conditions normalize, with outcomes ranging from 16 million units in our baseline to 15.5 million in a more adverse, higher-for-longer energy scenario.
Disclaimer
This report is provided by TD Economics. It is for informational and educational purposes only as of the date of writing, and may not be appropriate for other purposes. The views and opinions expressed may change at any time based on market or other conditions and may not come to pass. This material is not intended to be relied upon as investment advice or recommendations, does not constitute a solicitation to buy or sell securities and should not be considered specific legal, investment or tax advice. The report does not provide material information about the business and affairs of TD Bank Group and the members of TD Economics are not spokespersons for TD Bank Group with respect to its business and affairs. The information contained in this report has been drawn from sources believed to be reliable, but is not guaranteed to be accurate or complete. This report contains economic analysis and views, including about future economic and financial markets performance. These are based on certain assumptions and other factors, and are subject to inherent risks and uncertainties. The actual outcome may be materially different. The Toronto-Dominion Bank and its affiliates and related entities that comprise the TD Bank Group are not liable for any errors or omissions in the information, analysis or views contained in this report, or for any loss or damage suffered.
Download
Share: