U.S. Housing Recovery on Hold Until Rates Retreat
Admir Kolaj, Economist | 416-944-6318
Date Published: November 9, 2026
- Category:
- U.S.
- Real Estate
Highlights
- U.S. mortgage rates have risen sharply, with the 30-year fixed rate climbing from around 6% before the Middle East conflict to 7.3% on average over the last few weeks. For a buyer purchasing a $425,000 home with 20% down, that adds about $300 to the monthly mortgage payment and reduces purchasing power by roughly 10%.
- The near-term impact of higher rates is poised to be felt most notably in transaction activity, with several indicators pointing to a pullback already underway. Sales have room to weaken somewhat further, while limited resale inventory and a still-supportive labor market should help contain the effect on prices over the near-term.
- Our baseline forecast assumes that mortgage rates gradually retreat toward 6% over the medium term, helping housing activity recover over the next two years. Total home sales are projected to recover to around 4.7 million annualized in the second half of 2027 and move above 5 million in late 2028. This would amount to gradual healing rather than a boom.
- The longer rates remain elevated, the greater the likelihood that the housing recovery is delayed and home-price momentum weakens. If mortgage rates remain near 7% over the next year, total home sales would likely hover near today’s depressed annualized pace of roughly 4.5 million through much of 2027, delaying the improvement anticipated in our baseline, while home-price growth would likely be broadly flat or slightly negative.
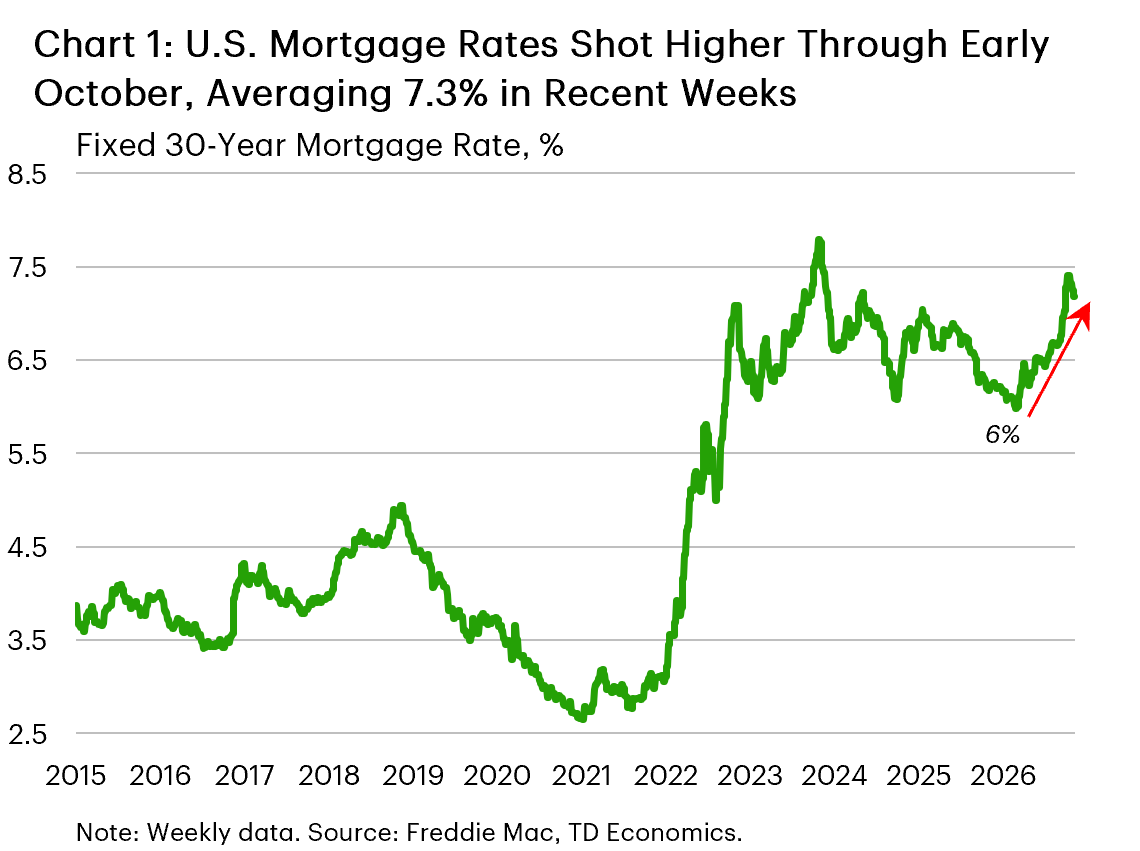 The U.S. housing market has been dealt another setback. The 30-year fixed mortgage rate hovered around 6% in February before the Middle East conflict intensified inflation concerns and pushed long-term interest rates higher. Rates surged to nearly 7.5% by early October and have eased slightly since, averaging roughly 7.3% over the last few weeks (Chart 1). This has reversed much of the affordability improvement over the past year and a half.
Higher financing costs will weigh on sales that are already historically depressed. Home prices should also respond, but more moderately, particularly in the larger resale market, where inventories remain contained. Our baseline anticipates some relief over the medium term, but the longer rates remain elevated, the greater the risk that the recovery is delayed and home-price momentum comes under additional pressure.
Higher Rates Deliver Another Affordability Shock
The latest jump in rates delivers a substantial blow to affordability. Consider a buyer purchasing a median-priced single-family home of roughly $425,000 with a 20% down payment and a 30-year mortgage. At a mortgage rate of 6%, the monthly principal-and-interest payment would be about $2,040. At the recent average rate of 7.3%, the payment increases to around $2,335. That is an additional cost of almost $300 per month, or more than $3,500 per year.
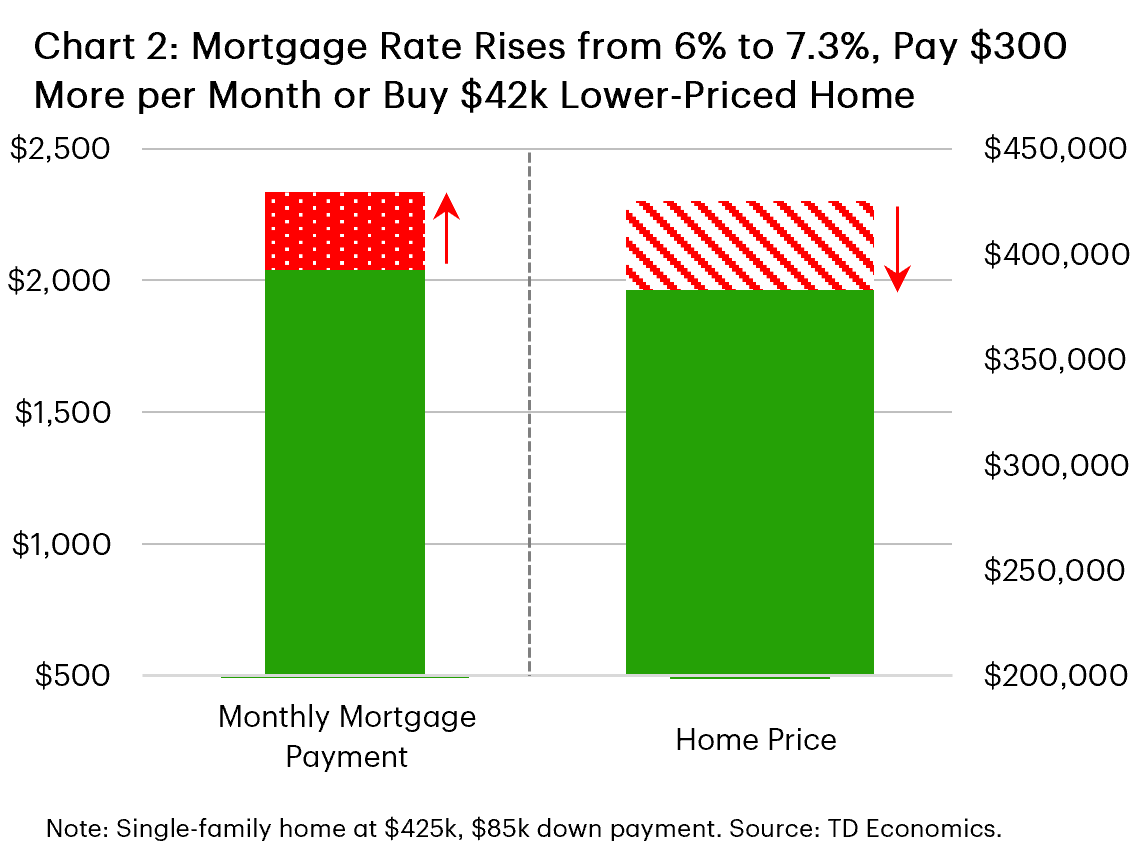 Another way to look at the adjustment is through purchasing power. To keep the monthly mortgage payment unchanged, the buyer would need to reduce the home price by approximately $42,000, from $425,000 to around $383,000, assuming the same $85,000 down payment (Chart 2). This represents a roughly 10% reduction in purchasing power.
These calculations exclude property taxes, insurance and other ownership costs, many of which have also increased. Nor are housing costs rising in isolation: renewed inflationary pressures across a range of goods and services are further eroding household purchasing power. While strong equity-market gains are providing some support to higher-income households, the personal saving rate’s recent decline to 4.1% suggests that the average consumer has less room to absorb another affordability shock.
Buyers have several options to soften the increase in borrowing costs, including builder-funded rate buydowns on newly built homes, assumable mortgages, and adjustable-rate mortgages, which typically offer an initial-rate discount relative to a traditional 30-year fixed-rate mortgage (see our report here). These options can provide relief for some buyers, but their reach is limited and they will not change the market’s broader direction.
Home Sales Will Take the First Hit
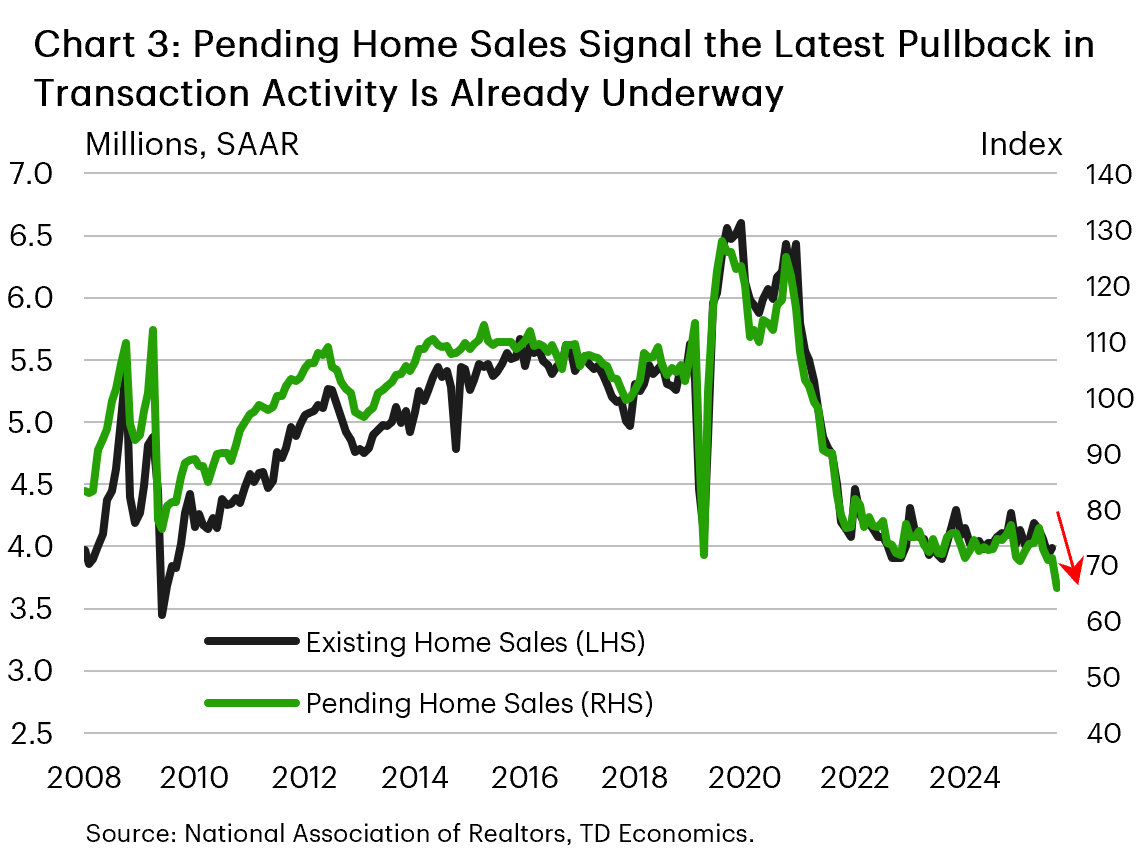
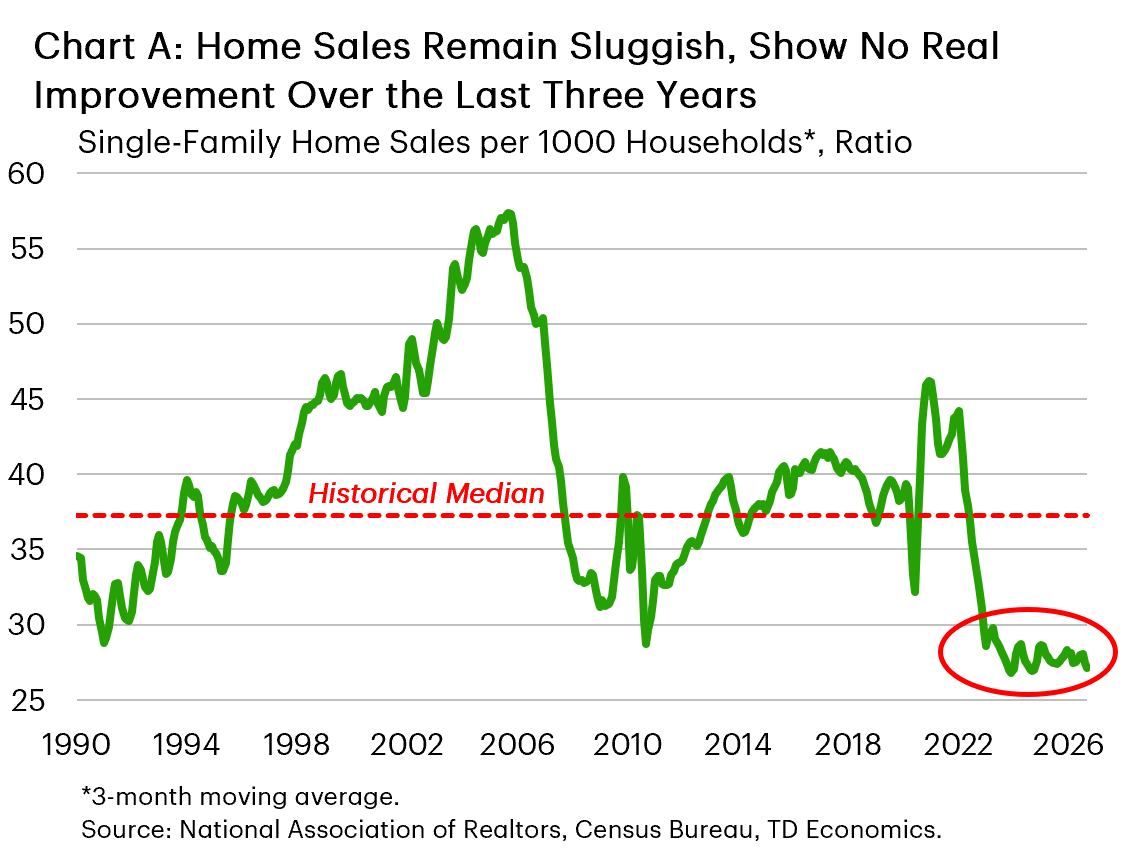
Higher rates reduce the mortgage amount for which a household can qualify, push some buyers beyond their monthly budget and cause others to delay a purchase in the hope that financing conditions improve. The latest interest-rate increase is especially significant because demand was already lackluster. Closed existing-home sales were running at roughly four million units annualized in September, an exceptionally weak pace relative to historical norms and even more depressed once growth in the number of U.S. households is taken into account. Still, activity has room to weaken somewhat further, with signs that the latest pullback is already underway. Pending home sales, a measure of signed contracts that typically leads closed existing-home sales by one to two months, fell a sharp 7.3% in September (Chart 3). The index reached its lowest level since the series began in 2001. More timely mortgage applications data reaffirm this narrative and suggest the slowdown has extended into October, with mortgage purchase applications trending firmly lower through the month.
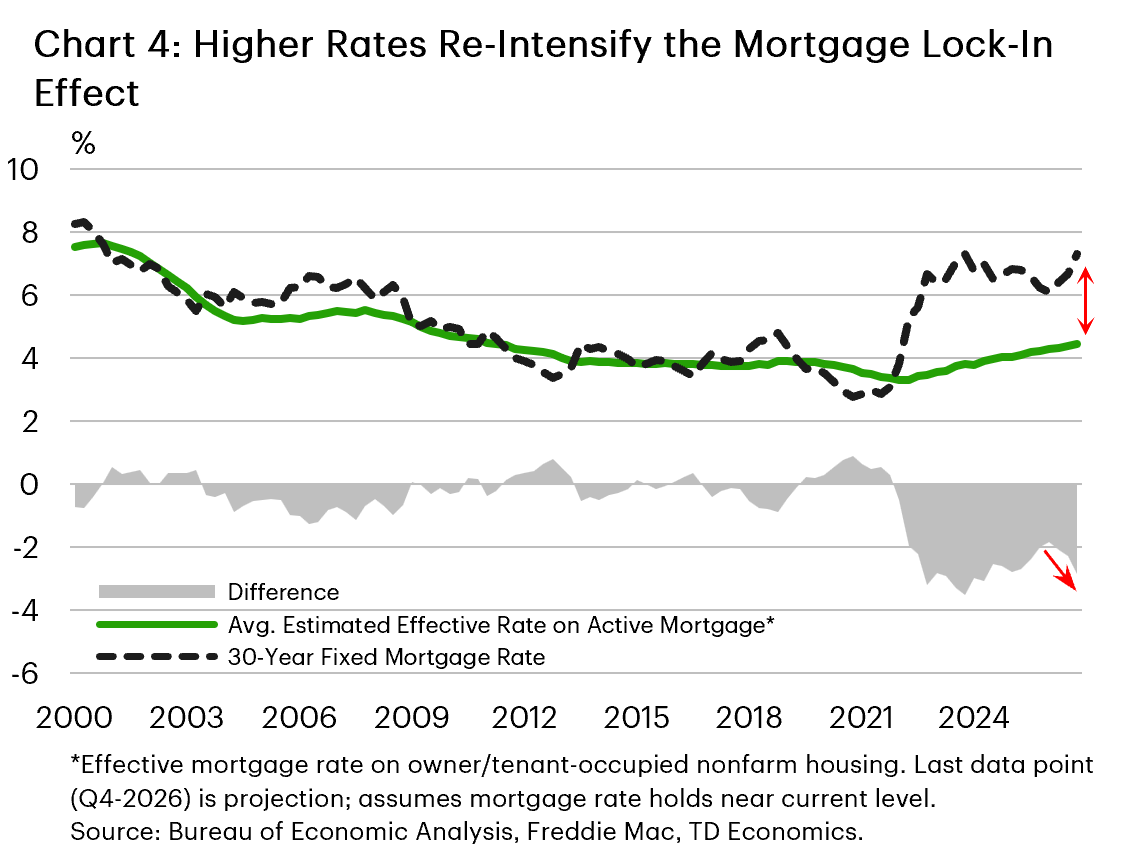
The re-intensification of the mortgage lock-in effect will be an added hurdle. The effective rate on outstanding mortgage debt stands around 4.4%. With market mortgage rates averaging roughly 7.3% over the last few weeks, the financial penalty for selling an existing home and taking on a new mortgage has widened once again (Chart 4). Homeowners facing employment changes, evolving space requirements or other life circumstances will still need to move, but more discretionary sellers have a strong financing incentive to remain in place. This will constrain both demand and resale listings, leaving transactions to bear much of the adjustment.
New Homes Likely to Retain Their Expanded Market Share
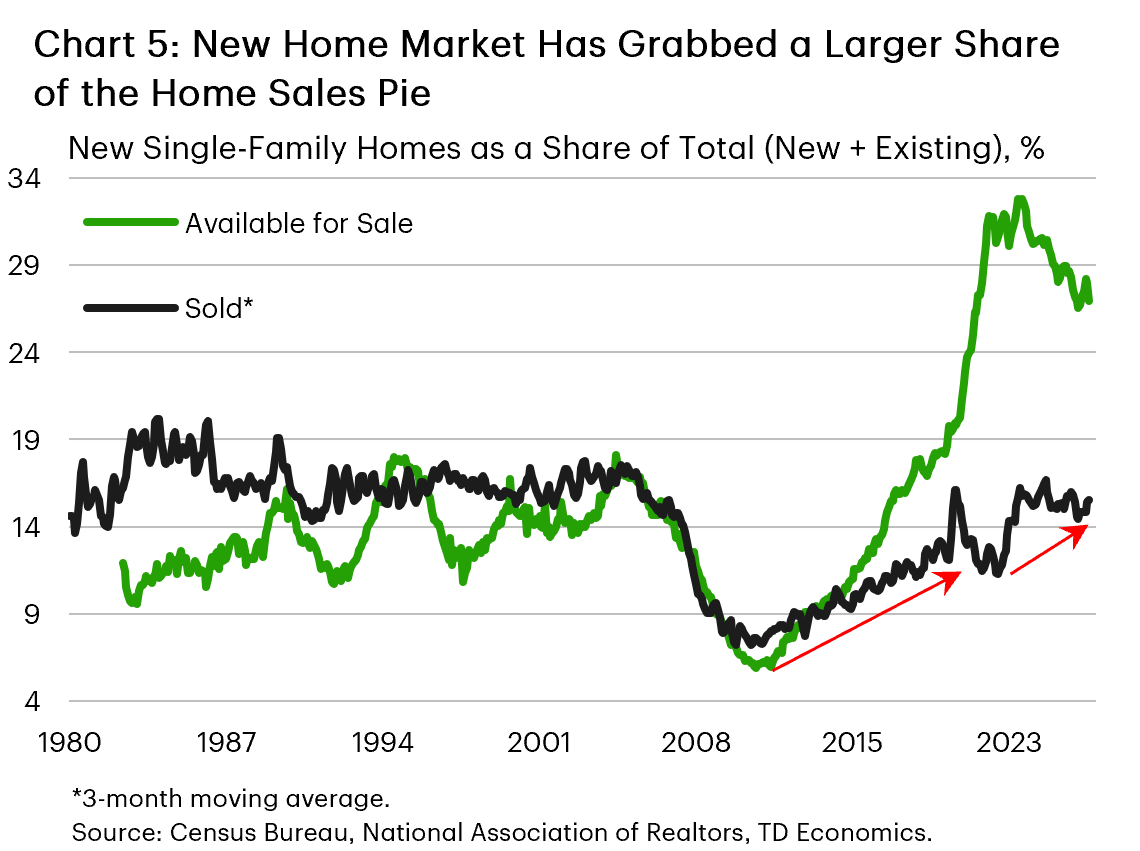
New construction has captured a larger share of the market in recent years. New homes make up roughly 15% of all single-family homes sold, now broadly in line with historical norms, but continue to account for an outsized 28% of available single-family inventory (Chart 5). With mortgage lock-in continuing to constrain resale listings, buyers who remain active will have to continue looking to the new-home market.
Builders also have a stronger incentive to keep inventory moving. The new single-family market holds around 8.5 months of supply, compared with 4.6 months in the resale market. Median new-home prices have already fallen by roughly 10% from their 2022 peak, while 43% of builders reported cutting prices in October – the highest share over the last six years. The decline in the median price partly reflects a shift toward smaller and less expensive homes rather than like-for-like price reductions alone. Among builders reducing prices, the average cut has remained at 6% over the last several months. Two-thirds of builders also reported using sales incentives, including mortgage-rate buydowns, closing-cost assistance and upgrades.
Together, these factors should allow new homes to retain their expanded share of transactions and potentially push it somewhat higher over the near term, even as overall sales remain sluggish. To be clear, new-home sales will not be immune to the interest-rate shock, but elevated inventory gives builders a stronger incentive to adjust prices and terms to complete a sale.
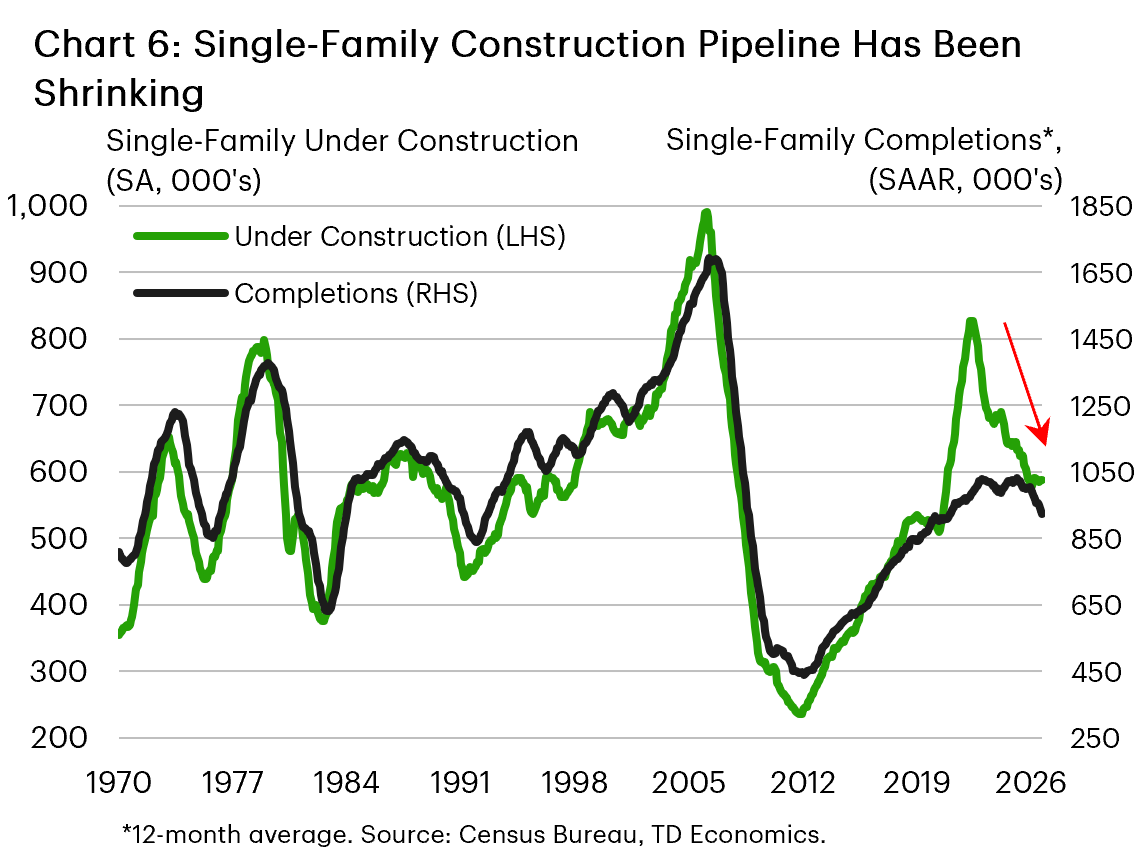
There are limits to how far builders can go, however. Rising material, financing and labor costs will constrain their ability to make further accommodations without putting additional pressure on margins. At the same time, the declining number of single-family homes under construction suggests that fewer units will be added to inventory over time, gradually reducing the pressure on builders to clear inventory (Chart 6).
Price Impact More Moderate, at Least Initially
The deterioration in affordability points to renewed downward pressure on home prices, but the interaction between supply and demand remains important. While higher mortgage rates reduce the number of buyers able or willing to purchase a home, they also strengthen the mortgage lock-in effect and discourage existing homeowners from listing. The resulting restraint on resale listings should help limit the price response.
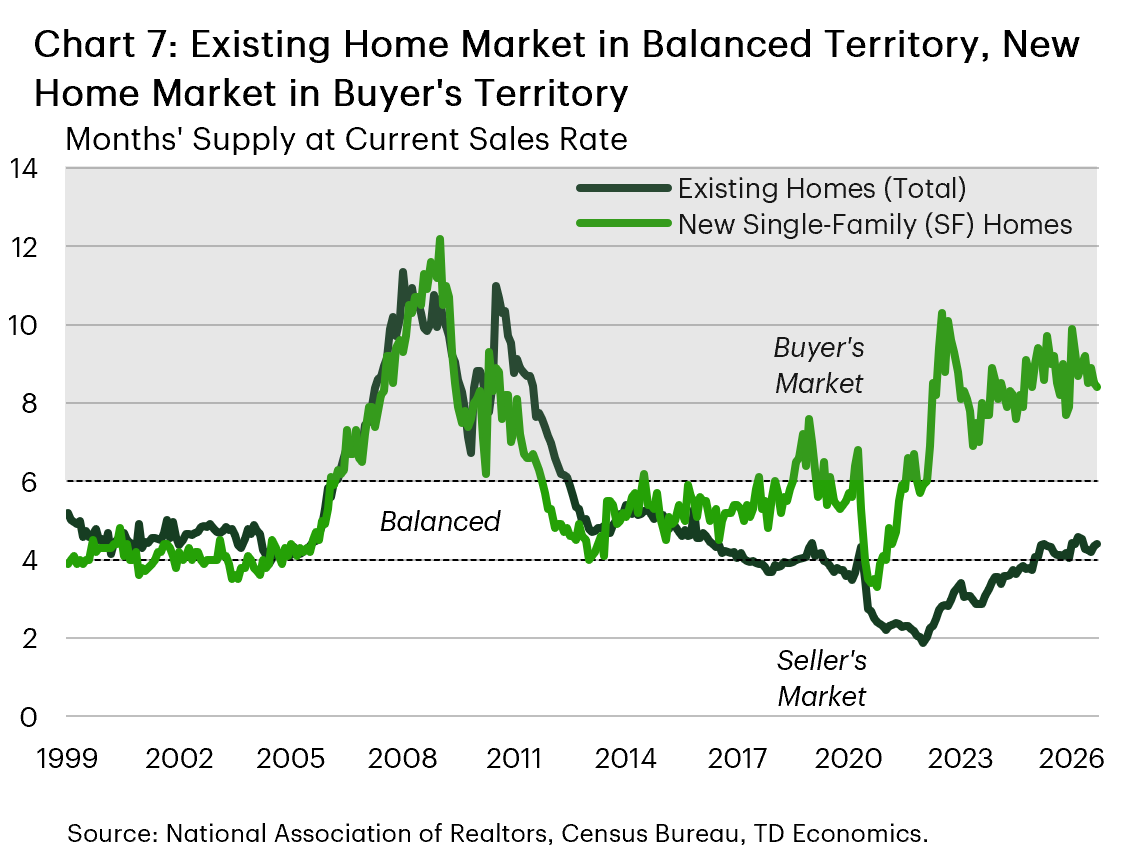
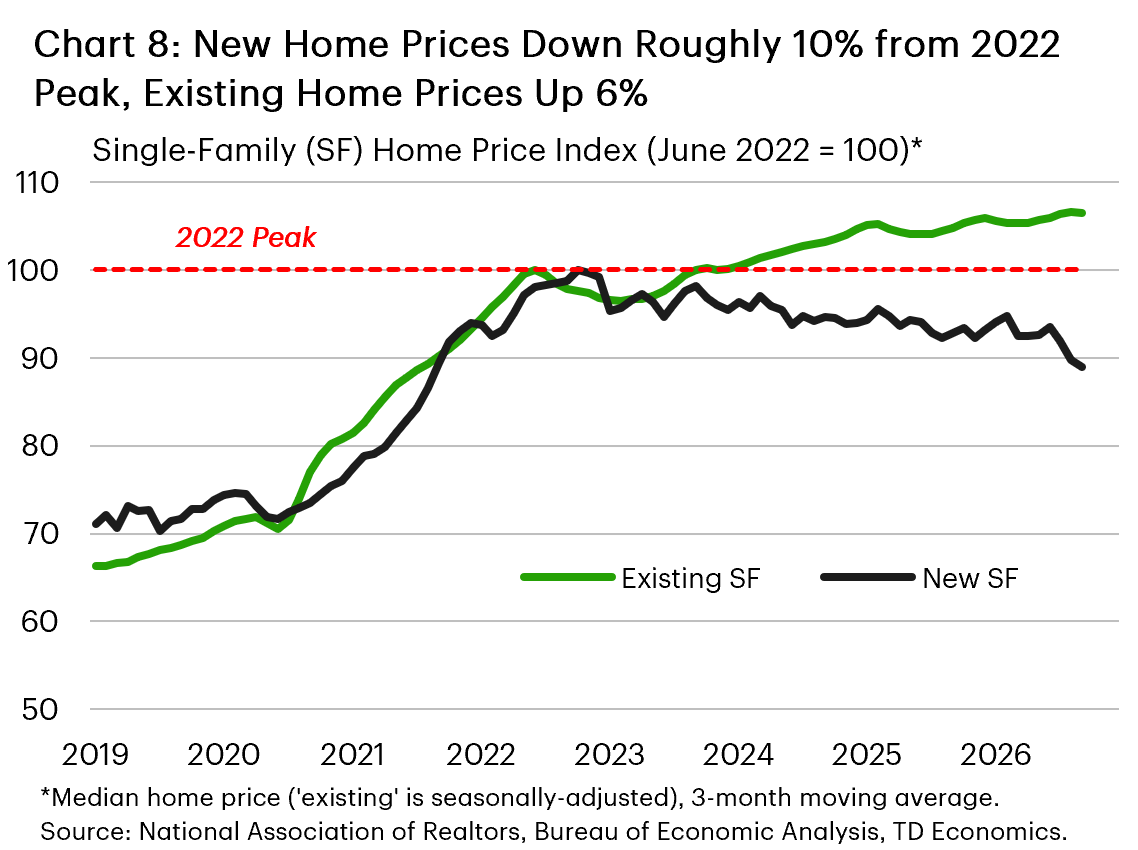
Despite trending higher, resale inventory remains near the lower end of balanced territory and does not represent the large national overhang normally associated with steep price declines (Chart 7). The median existing-home price has continued to trend moderately higher, even as sales have remained historically weak (Chart 8). Some homeowners will reduce asking prices or offer concessions, but a still-supportive labor market should help keep forced selling relatively limited.
The national picture will mask considerable regional and market-segment variation. Markets with more inventory, larger construction pipelines or weaker population growth will face greater downward pressure. At the same time, affluent and cash buyers may provide greater support at the upper end of the market, while entry-level and mortgage-dependent buyers bear more of the affordability shock.
Overall, the distinction between the impact on sales and prices is primarily one of degree, not direction. Higher mortgage rates are negative for both, but with resale supply still contained, sales should initially absorb more of the shock, even if the decline from today’s already depressed level proves relatively modest. The longer rates remain elevated, however, the greater the likelihood that sellers become more accommodating and home-price momentum weakens further.
Medium-Term Healing Depends on Lower Rates
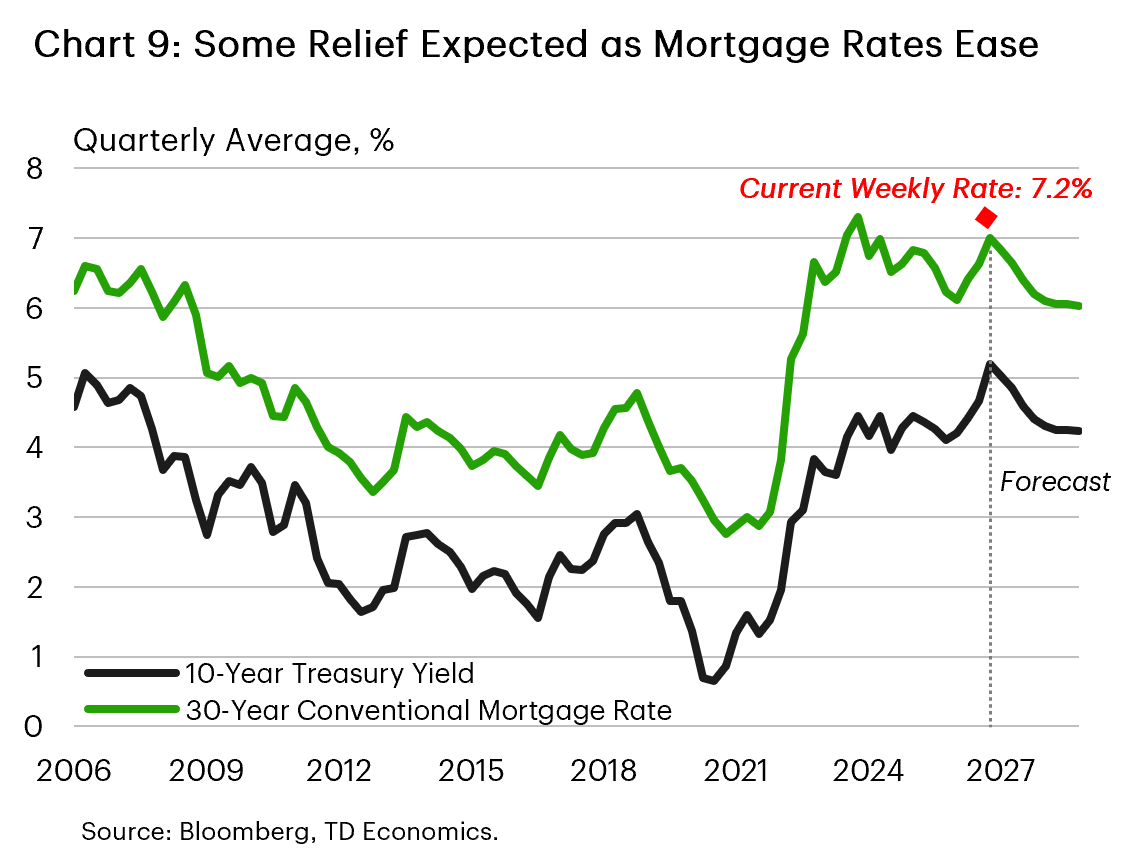 Our baseline forecast assumes that the latest rate shock is temporary. As U.S. economic growth moderates towards a more sustainable 2% rate, underlying inflation will likely move closer to target, thus easing pressure on long-term borrowing rates. The 30-year fixed mortgage rate should follow, gradually retreating toward 6% over the medium term, around the level that prevailed immediately before the latest Middle East conflict (Chart 9). The adjustment would be gradual and would still leave mortgage rates well above their immediate pre-pandemic norm of under 4%, but it would provide meaningful relief relative to today.
Lower rates would progressively re-energize transaction activity by reversing some of the additional hurdles that have appeared over the last few months. For instance, they would improve purchasing power and allow more potential buyers to qualify for a loan, while also reducing the mortgage lock-in effect and encouraging more existing homeowners to list. Lower rates would also encourage builders to increase construction again, although the effect on new supply would be felt with a lag.
An improving labor market would provide an additional tailwind. Continued job growth and some downside in the unemployment rate would support household income and confidence, helping release some demand deferred during the period of elevated borrowing costs. While the 6% mortgage rate we expect over the medium term would remain elevated relative to the immediate pre-pandemic period, it is not unusually high by longer-term historical standards. Some delayed demand should therefore return as buyers recalibrate their rate expectations and life events bring postponed transactions back to the market.
 Improving economic conditions would support household formation at the margin, although immigration will remain an important swing factor. The recent drop in inflows is weighing on population and household growth, while a potential return toward more typical levels over the medium term would help absorb rental-market slack and support housing demand.
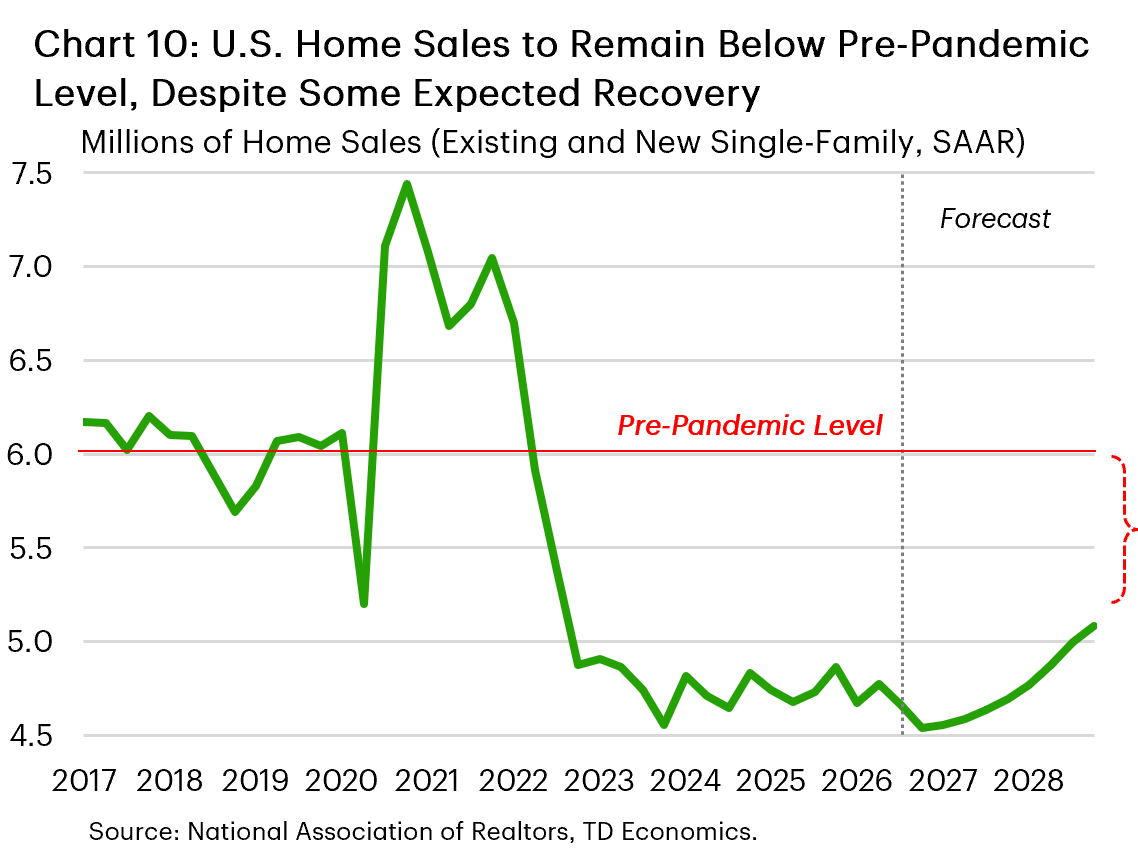
Under this baseline, total home sales (existing and new single-family) would recover to around 4.7 million annualized in the second half of 2027, before moving above 5 million in late 2028 (Chart 10). With mortgage rates moving lower and demand stabilizing, national home-price growth would improve gradually from a near-flat pace this quarter to a pace of 2½% annualized by late 2027 and a little over 3% by late 2028. This would amount to healing rather than a boom. Overall, activity would recover somewhat from today’s depressed levels, but structurally higher borrowing costs and still-stretched affordability would keep market activity well below its pre-pandemic level.
A Higher-for-Longer Rate Scenario Would Delay the Recovery and Weigh on Price Momentum
While our baseline has the housing market beginning to heal in 2027, risks remain modestly tilted to the downside. Mortgage rates have repeatedly defied expectations for a sustained decline in recent years, contributing to a prolonged period of sluggish housing activity.
Our downside scenario assumes that inflation remains elevated, long-term bond yields stay under pressure and mortgage rates remain higher for longer, holding near 7% over the next year. Under this scenario, the affordability shock would persist, leaving transactions depressed. An intensified mortgage lock-in effect would discourage more discretionary sellers from listing, further restraining sales but also limiting the pressure on prices. However, some homeowners will still need to move because of employment changes, family circumstances or other life events. In a weak demand environment, these more motivated sellers may have to reduce asking prices or offer concessions to complete a sale.
This broader downside scenario also assumes a somewhat softer economic backdrop. Elevated rates would weigh on rate-sensitive spending and investment, contributing to slower job growth and weaker housing demand. Increased financial pressure could add to the number of motivated sellers at the margin, while builders facing elevated inventory would be inclined to adjust prices and incentives more meaningfully. Rising construction costs and a slower building pipeline would limit the extent of that adjustment, however.
All told, under this scenario, we estimate that total home sales would hover near today’s depressed annualized pace of roughly 4.5 million through much of 2027, delaying the improvement anticipated in our baseline. National home-price growth would likely be broadly flat or slightly negative, with more pronounced declines concentrated in markets already carrying excess inventory.
Bottom Line
The latest increase in mortgage rates will take another bite out of an already strained U.S. housing market. The move from around 6% in February to an average of roughly 7.3% over the last few weeks raises the monthly mortgage payment on a typical single-family home by almost $300 and reduces purchasing power by roughly 10%, a material setback for households already facing stretched budgets and renewed inflationary pressure elsewhere. Sales should bear more of the near-term adjustment, while limited resale inventory and a supportive labor market help contain the effect on prices.
Our baseline has mortgage rates gradually retreating toward 6%, supporting a recovery in sales and more typical home-price growth. This would amount to gradual healing rather than a boom. The longer rates remain elevated, however, the greater the risk that the sales recovery is delayed and home-price growth stalls or turns slightly negative.
Appendix
Disclaimer
This report is provided by TD Economics. It is for informational and educational purposes only as of the date of writing, and may not be appropriate for other purposes. The views and opinions expressed may change at any time based on market or other conditions and may not come to pass. This material is not intended to be relied upon as investment advice or recommendations, does not constitute a solicitation to buy or sell securities and should not be considered specific legal, investment or tax advice. The report does not provide material information about the business and affairs of TD Bank Group and the members of TD Economics are not spokespersons for TD Bank Group with respect to its business and affairs. The information contained in this report has been drawn from sources believed to be reliable, but is not guaranteed to be accurate or complete. This report contains economic analysis and views, including about future economic and financial markets performance. These are based on certain assumptions and other factors, and are subject to inherent risks and uncertainties. The actual outcome may be materially different. The Toronto-Dominion Bank and its affiliates and related entities that comprise the TD Bank Group are not liable for any errors or omissions in the information, analysis or views contained in this report, or for any loss or damage suffered.
Download
Share: