Office CRE Recovery Lags, but Signs of Healing Continue
Admir Kolaj, Economist | 416-944-6318
Date Published: June 16, 2022
- Category:
- US
- Real Estate
- State & Local Analysis
Highlights
- Vacancy rates for almost all major commercial real estate (CRE) sectors have come off of their pandemic highs and fallen below their pre-pandemic levels recently, with the office sector being the only outlier to this theme. The office sector’s vacancy rate has continued to move sideways ever since topping 12% in mid-2021.
- Under the hood, there are numerous signs that fortunes are turning for the office sector. Net absorption of office space has been positive over the last few quarters, and rent and price growth are tilting further into positive territory.
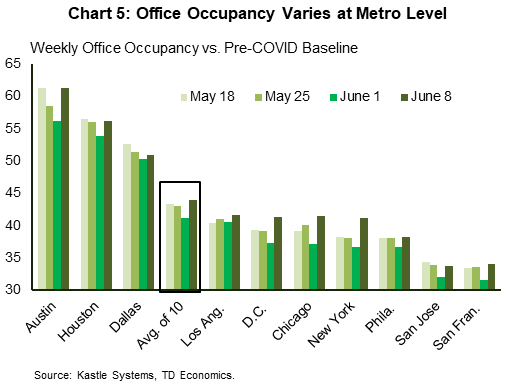
- The encouraging trends have more room to run as the pandemic shifts further in the rearview mirror and more workers return to offices. However, the lingering popularity of remote work makes it harder to gauge how much of a boost this will yield. Office utilization rates have improved this year but remain well below 2019 levels.
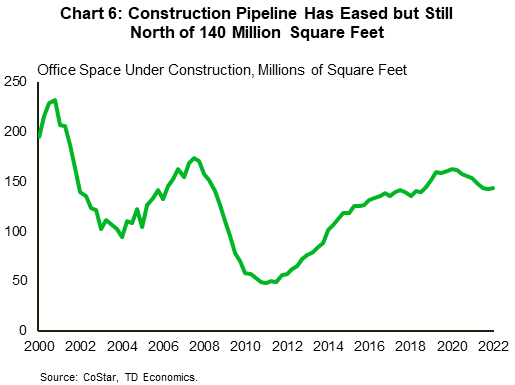
- There’s also the potential for more bumps on the road, with the supply side bearing careful watching. The recent rise of sublet space is one concerning aspect. In terms of new supply, the office construction pipeline has moderated over the pandemic, but there’s still quite a bit of space under construction.
- We have recently scaled back our U.S. growth forecast, and while we’re not calling for a recession at present, odds for such an outcome have certainly increased notably over the last couple of months. A shallow recession would have a net negative effect for office market, given that it would impact expansion plans and incentivize cost-cutting measures.
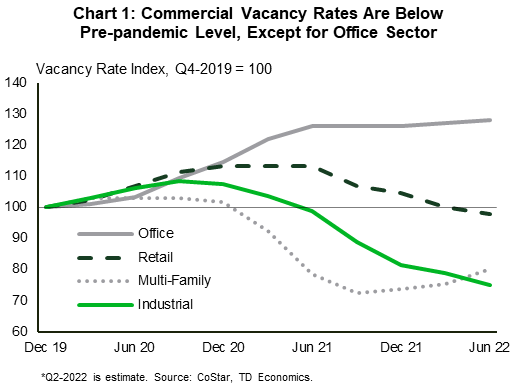
The pandemic took a heavy toll on U.S. commercial real estate (CRE), with all major segments – multifamily, industrial, retail and office – seeing their vacancy rates surge during the early phase of the health crisis. Softening fundamentals also weighed on rent and price growth. These pressures, however, proved short-lived for the multifamily and industrial sectors, which saw their vacancy rates reverse course last year and fall to well below their pre-pandemic levels (Chart 1). The latest segment to reach this milestone was retail, where the vacancy rate managed to return below pre-virus trends in recent months. This was in part thanks to an improvement in in-person shopping, but also a very lean retail construction pipeline in the years leading to the pandemic.
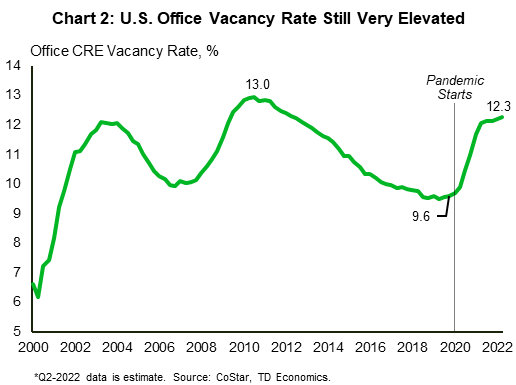
The office market, however, remains an outlier. Office foot traffic was drastically reduced during the pandemic as a large part of the labor force shifted to remote work. Although deep-pocketed tech giants showed interest for prime office locations, the pandemic severely scaled back the appetite of most employers with respect to signing new office leases. After topping 12% in mid-2021, the office sector’s vacancy rate has continued to move sideways, showing little progress two years into the pandemic (Chart 2). The current vacancy rate is not that far off from the all-time high of around 13% in the aftermath of the Great Recession. This underperformance vis-à-vis its peer sectors is also observable in other metrics such as rent and price growth, with the office sector showing by far the weakest performance among the group on these fronts over the past two years (Chart 3).

As is often the case with real estate, performances vary widely at the local level. Looking at the largest 30 metro areas by office space, softness in rents continues to be most pronounced in places like New York, San Francisco, Orange County, Seattle, East Bay and even Houston (Table 1). At the other end of the spectrum, and doing much better, are metros such as Miami and Tampa, along with Charlotte (NC), Phoenix and San Diego. Vacancy rate metrics generally sing to the same tune. San Francisco for instance, where office rents are down the most (-13%), has seen its office vacancy rate more than double over the last two years, rising from 6% at the end of 2019 to around 14% in the first quarter of this year. Overall, trends at the local level tend to mirror broader economy-wide shifts observed during the pandemic, including the rise of remote work and the outflow of population from dense and expensive urban areas in the West and Northeast toward cheaper and typically warmer markets in the South, with Houston being one notable outlier to this theme.
Signs of healing continue, but not out of the woods yet
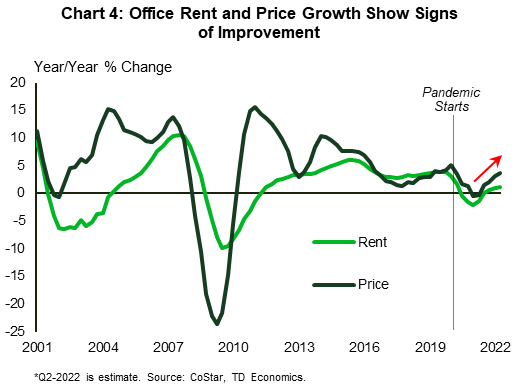
While the overall office sector’s recovery is clearly lagging, there are numerous signs that its fortunes are starting to slowly turn around. For example, net absorption for office space has been positive in each of the last three quarters through the start of this year, with the second quarter of the year looking to have extended the positive streak. Encouragingly, rents have also picked up alongside improved demand, with rent growth tilting further into positive territory recently (Chart 4). Meanwhile, price growth has also been accelerating as it plays catch up to the other CRE segments.
While low office usage is correlated with weaker market dynamics, above-average office usage may not necessarily line up with a strong performance. That’s because, ultimately, the strength of a market is not only based on demand, but also supply – an often-overlooked component in the post-pandemic period. For example, improved office utilization and a rebound in leasing activity has done little to curb the upward trend in Houston’s vacancy rate, which is up from an already elevated 16% before the pandemic to nearly 19% recently (refer back to Table 1).
Table 1: Office CRE Metrics for Large Metro Areas by Office Space
Table 1 displays office CRE metrics for the thirty largest metro areas by office space. The information displayed for each metro is the percent change in rent and vacancy rates between the pre-pandemic level and the latest available data point (Q1-2022). The latest available vacancy rate figure and 'space under construction as a percent of existing stock' are also shown. The data is ranked by rent growth and is color-coded, with weaker showings shaded in red. Parsing through the table, several metros stand out. San Francisco, for instance, shows a weak performance, with office rents in the metro at the start of 2022 sitting more than ten percent below their pre-pandemic level. At the opposite end of the spectrum are markets like Miami, Charlotte (NC) and Tampa, although Charlotte's standing is tempered a bit from a notable increase in its vacancy rate relative to the pre-pandemic level.
| Metro Area (ranked by rent performance) |
Ranking by office space (1 = largest) | % Change in Rent (pre-pandemic to now)* | % Change in Vacancy Rate (pre-pandemic to now)* | Vacancy Rate (Q1-2021) | Under construction as a % of stock (Q1-2022) |
| San Francisco - CA | 14 | -13.0 | 128 | 13.9 | 1.4 |
| New York - NY | 1 | -5.1 | 44 | 11.8 | 2.2 |
| Orange County - CA | 16 | -4.9 | 23 | 11.9 | 0.8 |
| Seattle - WA | 10 | -3.4 | 74 | 9.8 | 4.8 |
| East Bay - CA | 27 | -2.9 | 45 | 12.2 | 0.3 |
| Houston - TX | 7 | -2.6 | 17 | 18.8 | 1.3 |
| Washington - DC | 2 | -2.5 | 18 | 15.0 | 1.8 |
| San Jose - CA | 21 | -1.3 | 29 | 11.8 | 6.8 |
| Los Angeles - CA | 4 | -1.1 | 33 | 13.8 | 1.1 |
| Chicago - IL | 3 | -0.6 | 26 | 15.1 | 0.4 |
| Denver - CO | 15 | -0.4 | 45 | 14.2 | 0.7 |
| Pittsburgh - PA | 20 | -0.3 | 36 | 10.4 | 2.0 |
| Kansas City - MO | 24 | -0.3 | 38 | 9.6 | 0.7 |
| Boston - MA | 6 | 0.0 | 36 | 9.3 | 4.4 |
| Detroit - MI | 12 | 0.4 | 21 | 11.7 | 1.0 |
| Baltimore - MD | 18 | 0.6 | 9 | 11.3 | 0.5 |
| Columbus - OH | 28 | 0.7 | 33 | 9.3 | 1.7 |
| Philadelphia - PA | 9 | 1.2 | 22 | 10.2 | 0.8 |
| Saint Louis - MO | 19 | 1.5 | 30 | 9.0 | 1.5 |
| Northern New Jersey - NJ | 17 | 1.6 | 17 | 13.1 | 0.4 |
| Dallas-Fort Worth - TX | 5 | 1.6 | 18 | 17.5 | 1.9 |
| Portland - OR | 29 | 1.9 | 72 | 12.2 | 1.0 |
| Austin - TX | 25 | 2.1 | 49 | 12.8 | 7.0 |
| Atlanta - GA | 8 | 2.4 | 23 | 14.2 | 1.5 |
| Minneapolis - MN | 11 | 3.2 | 29 | 10.3 | 0.6 |
| San Diego - CA | 26 | 4.3 | 21 | 11.3 | 3.5 |
| Phoenix - AZ | 13 | 4.7 | 25 | 14.3 | 0.9 |
| Tampa - FL | 23 | 4.9 | 23 | 9.0 | 0.5 |
| Charlotte - NC | 22 | 5.1 | 58 | 11.6 | 3.8 |
| Miami - FL | 30 | 10.0 | 18 | 9.9 | 3.0 |
Source: CoStar, TD Economics. *Compares Q4-2019 to Q1-2022.
 Another near-term challenge that could weigh on the office-sector recovery is the large number of leases that are coming up for renewal this year. JLL estimates that leases for more than 240 million square feet of office space are set to expire over the course of 2022 – the highest number since it began tracking the data back in 2015. In the current environment, where many employees are still working remotely, employers could be less enthusiastic around renewing long-term leases. So far, however, the fact that average lease terms have been trending up, rising above 8 years recently, is a positive sign that should help ease some of the concern.
 The last piece to the puzzle is new supply. While the construction pipeline for office space has moderated over the pandemic, it remains relatively elevated (Chart 6). There’s currently more than 140 million square feet of office space under construction – roughly 1.7% of existing stock – with more than a third of it unleased (i.e., speculative). As this inventory trickles into the market in the quarters ahead, downward progress in the national office vacancy rate is likely to be slowed. Looking further ahead, based on current construction trends, we expect that pressures stemming from the arrival of new supply should wane toward the second half of next year.
The next chapter is still being written
Barring the emergence of new major COVID-19 waves, ongoing economic growth and the easing of concerns with respect to the pandemic are poised to continue to lend a hand to office sector. However, the lingering popularity of remote work makes it harder to gauge how much of a boost the return-to-office movement will mean for the commercial office sector. As we’ve pointed out in the past, opinions and plans regarding the future of work tend to vary somewhat at the industry and firm level. This theme still holds true. For instance, while Tesla is summoning its employees to the office, many of the tech giants, such as Amazon, Meta, Alphabet are still showing plenty of flexibility toward remote work. On the whole, survey data still favor hybrid/flexible work arrangements as optimal approaches that generally help balance benefits on both sides. A recent survey suggests that among those that are able to work remotely, employers are planning to allow them to do so 2.3 days per week on average, once the pandemic has ended. That’s up noticeably from 1.6 days at the start of 2021 when hopes for a swift fading of the pandemic and a quick return to ‘normal’ may have been more prevalent.
 This view is likely reinforced by current economic conditions. Looking past concerns of contracting COVID-19, many workers have adapted to remote work and may seek to retain the perceived advantages that it offers, such as increased flexibility to perform some errands around the house, saving time and money on transportation etc. With gas prices at a record high and food-away-from-home inflation up 7.4% y/y and accelerating, it makes sense for employers to show some flexibility toward worker preferences, even as benefits tied to office work (i.e., team collaboration) may be high on the priority list. This is especially true now that the labor market is still drum tight. With an unemployment rate that is near the lowest level in five decades (3.6%), and nearly two job openings for every unemployed American, workers certainly have some leverage in the job market.
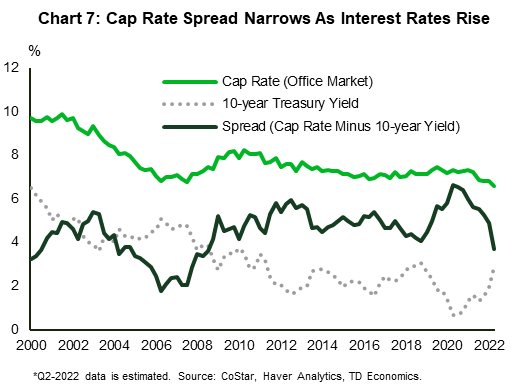
Under a scenario where economic growth decelerates and falls below potential by next year, and employment growth eases but remains positive (our base case scenario), there’s scope for higher office utilization to be a modest tailwind for office properties in the coming quarters. That said, with the Fed taking a more aggressive stance in its inflation fight, the odds of a recession have been increasing. An outcome where growth slows even more sharply or contracts would clearly have negative implications for office markets, given that it would weigh on expansion plans and incentivize cost-cutting measures among employers. In the meantime, the sharp increase in interest rates over the last several months has resulted in a noticeable narrowing of the spread between the office capitalization rate and the 10-year Treasury yield (Chart 7). A narrower cap rate spread may reduce some of the appetite among investor for riskier assets, in this case office properties.
Bottom Line
The U.S. office market still shows the most bruising among the four major commercial real estate (CRE) segments. At a little over 12%, the national office vacancy rate is showing no signs of joining its peers in falling below pre-pandemic levels. The pain, however, is not shared equally. Expensive coastal markets, such as San Francisco and New York, are bearing the burden, while many warmer and cheaper Southern markets that benefitted from an inflow of residents during the pandemic are faring much better.
Notwithstanding a stubbornly high vacancy rate, positive signs are brewing underneath, most notably the fact that net absorption of office space has been positive over the last several quarters, and that rent growth is tilting further into positive territory. These positive trends are likely to continue as the pandemic fades further in the rearview mirror. Still, there’s likely to be more bumps on the road. Higher interest rates may weigh on investors’ appetite for office properties, while the supply side also bearing close watching. The recent rise in sublet space, and the fact that more new space is poised to hit the market in the quarters ahead as projects are completed, suggests that the office vacancy rate is a likely to remain elevated for a while longer before showing firmer signs of tightening. Finally, with plenty of employers and workers still in a tug of war and hashing out the return-to-office details, the closing chapter on the office sector’s pandemic recovery is likely still being written.Disclaimer
This report is provided by TD Economics. It is for informational and educational purposes only as of the date of writing, and may not be appropriate for other purposes. The views and opinions expressed may change at any time based on market or other conditions and may not come to pass. This material is not intended to be relied upon as investment advice or recommendations, does not constitute a solicitation to buy or sell securities and should not be considered specific legal, investment or tax advice. The report does not provide material information about the business and affairs of TD Bank Group and the members of TD Economics are not spokespersons for TD Bank Group with respect to its business and affairs. The information contained in this report has been drawn from sources believed to be reliable, but is not guaranteed to be accurate or complete. This report contains economic analysis and views, including about future economic and financial markets performance. These are based on certain assumptions and other factors, and are subject to inherent risks and uncertainties. The actual outcome may be materially different. The Toronto-Dominion Bank and its affiliates and related entities that comprise the TD Bank Group are not liable for any errors or omissions in the information, analysis or views contained in this report, or for any loss or damage suffered.
Download
Share: