The Pandemic Economy – One Year On
Sri Thanabalasingam, Senior Economist | 416-413-3117
Date Published: March 30, 2021
Highlights
- It’s been one year since COVID-19 made landfall in Canada. Since then, the pandemic has taken the economy on an unprecedented roller coaster ride. A year on, the ride is not yet over.
- The health crisis has introduced new economic trends, while accelerating existing ones. Increased household savings, greater digitalization and a booming housing market are just to name a few.
- Some trends will fade as the pandemic recedes, others will have more staying power. The Canadian economy will emerge from the downturn more resilient to future health crises, but also saddled with new challenges.
What a historic past 52-weeks. This time last year, a relatively unknown virus had started to spread in Canada, raising a few alarm bells, but most of us never in our worst nightmares imagined what would happen next. Lives were upended, livelihoods shattered, and economic activity plummeted. This was a crisis unlike any other, and we were little prepared.
A year on, conditions have improved. The economy is recovering, vaccines are being distributed, and “normal” doesn’t seem that far away. But economic winds have shifted, and new trends have emerged. As some of these changes will be with us well past the pandemic, it is worthwhile taking stock of some of the key economic shifts over the past year.
1. Unprecedented Roller Coaster Ride
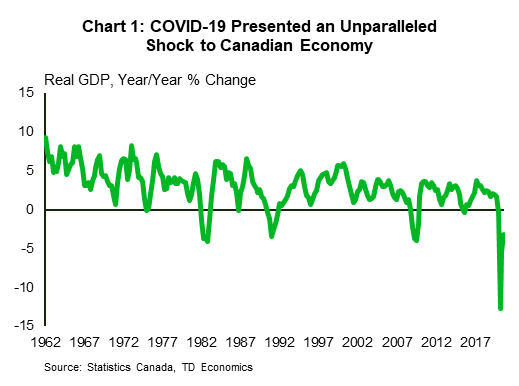
First, COVID-19 has taken the economy on an unprecedented roller coaster ride. Upon appreciating the seriousness of the virus, provinces instituted wide-spread lockdowns last spring, resulting in a historic 13% y/y decline in GDP in the second quarter of 2020 (Chart 1). This was by far the steepest contraction in economic output since the quarterly series began in 1961. Since then, as the virus was slowly brought under control, provinces eased public health guidelines, allowing the economy to recover in more ‘V-shaped’ fashion than most forecasters had anticipated.
When we receive January’s GDP data later this week, we anticipate that real GDP will sit about 2.9% below its pre-virus level. With Canadian growth forecasts recently being upgraded for 2021 to around 6%, that remaining ground is on track to be fully made up sometime this summer.
Having said that, we don’t rule out some further bumps along the way. As long as the virus is out there, some form of social distancing guidelines will stay in place. This, along with ongoing health concerns, will continue to dampen consumer and business spending activity. In addition, a potential third wave of the pandemic could reverse reopening measures, setting back the recovery. Still, given the diminishing impacts of each round of restrictions – alongside ongoing government supports and the expanding vaccine rollout – there has recently been growing confidence in the sustainability of the recovery.
2. Everything K
The pandemic generated an alphabet soup to describe the shape of the recovery: V, U, W or — most pessimistic of all — L. A year out, it’s clear that the most apt characterization was in fact the letter K.
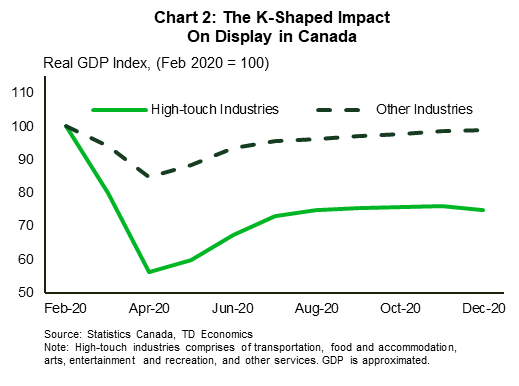
Across and within industries, along pay scales, as well as gender lines, the pandemic hit some segments of the population harder than others. High-touch industries — those that require a higher degree of personal contact — suffered the most when the pandemic struck, with GDP declining by over 40% from February to April 2020 (Chart 2). The impact was considerably less severe for all other industries as the drop in output was less than half that of high-touch industries. Conditions improved for both groups over the course of 2020, but even then, real output in the four most struggling industries was 25% below pre-pandemic levels, whereas for about one-third of industries, output was standing well above. The remainder of the areas had almost fully recovered (see report).
This dynamic has also been on display in the labour market. Low paying jobs are still 700,000 positions short of where they were last year, while 100,000 net new jobs have been created in higher paying sectors.1 In addition, over 100,000 more women have left the labour force compared to men since February 2020, with many assuming childcare duties.
In many ways, the pandemic exacerbated existing inequalities in the economy, and in society more broadly. Vaccines and lifting of public health restrictions should narrow the divide, but it’s likely that disparities will remain elevated for some time after the pandemic
3. Many Household Financial Positions Have Improved
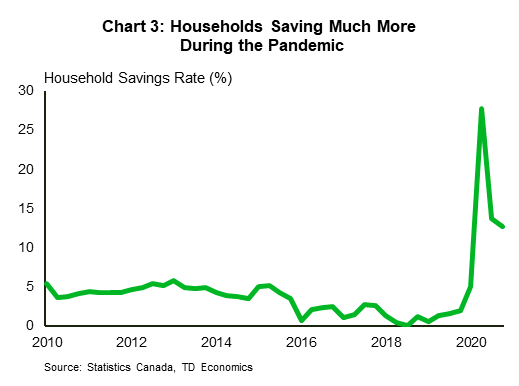
Despite the disastrous shock on GDP and employment, most households saw their financial positions improve over the past year. Tremendous fiscal support through programs such as Canada Emergency Response Benefit (CERB) and Canada Recovery Benefit (CRB) safeguarded incomes for those who had lost their jobs. For lower income households, it more than replaced lost employment pay. Meanwhile, Canadians who had kept their jobs have not been able to spend on many discretionary services due to health protocols. As a result, households saved at extraordinary rates (Chart 3), amassing around $200 billion in excess savings through 2020. Many have used a portion of these funds to pay down existing debt burdens, particularly balances on credit cards and unsecured lines of credit (see report). In addition to lower debt, household assets rose in value, due to strong performances in real estate and financial markets, boosting Canadians’ net worth over the past year.
As the health crisis recedes, it’s unlikely that Canadians will be committed to continue paying down liabilities. With reduced health concerns and restrictions, individuals could splurge on high-touch services that had been denied to them for over a year. They could also dip into built up savings to finance these purchases. Much is uncertain, but less in the way of deleveraging is likely in the cards for 2021.
4. Business Insolvencies Are Down, But Debt Rises
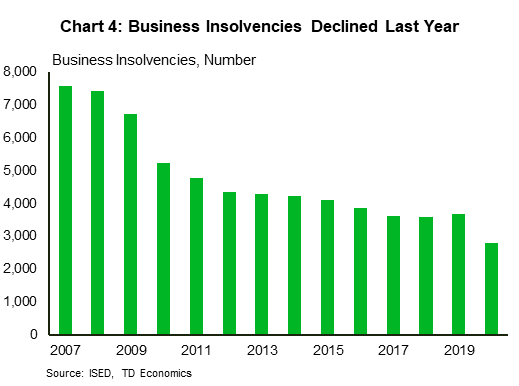
In a year with so much economic turmoil, it wouldn’t have been a surprise to see business insolvencies rise. But instead, filings declined to their lowest level since the data began in 2007 (Chart 4). The drop was due in part to extensive government support programs such as the Canada Emergency Business Account (CEBA) which was set up to offer partially forgivable loans to small businesses. To date, nearly 840,000 firms have tapped into the program, receiving loans totaling $34.3 billion. This, among other government initiatives, have helped businesses remain afloat through the pandemic, but it has also led to rising vulnerabilities.
According to a recent Canadian Federation of Independent Business survey, small businesses had accrued $170,000 in additional debt due to the pandemic and 56% of respondents said it would take at least a year to pay back these liabilities. The silver lining here is that the government is the main creditor, and the terms are favorable. So, bankruptcies may not balloon in coming years, but it could delay investment and hiring plans, weakening the economic recovery.
5. Government Debt Burden Surpassing 1990s Peak
For households and businesses alike, fiscal policy has provided much needed support throughout the pandemic. The IMF recently pointed out in Canada’s 2021 Article IV consultation report, without fiscal aid, GDP could have declined by an additional 7.8 percentage points in 2020 and the unemployment rate would have been 3.2 percentage points higher. But there’s no such thing as a free lunch.
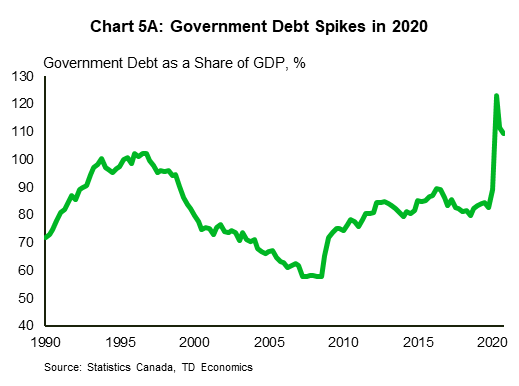
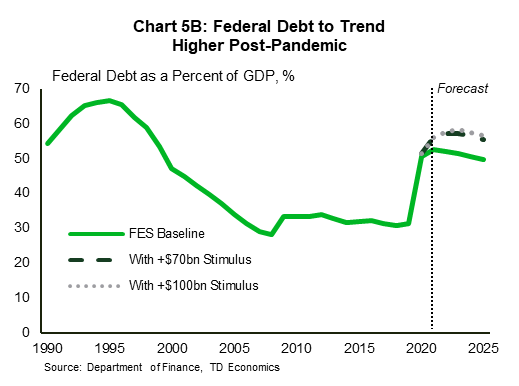
Because of the extensive support measures, government debt spiked in 2020, surpassing the 1990s peak (Chart 5A). And looking ahead, higher levels of debt will likely remain in place over the next several years (Chart 5B). Early indications suggest governments at all levels will continue to provide assistance to those still hurting from the pandemic (see report). In addition, the federal government has set aside $70-$100 billion in unallocated funds to further stimulate the recovery. Elevated government debt burdens are likely a mainstay in the economy going forward, presenting an upside risk to Canadian tax rates in the coming years.
6. Consumers and Businesses Embrace Digitalization
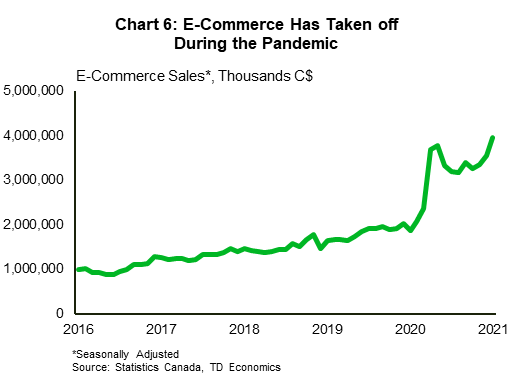
Another important trend that took hold during the pandemic was digitalization. Barred from the in-person shopping experience, consumers familiarized themselves with the online marketplace, and businesses responded by building out their e-commerce platforms. Online sales exploded since the beginning of the pandemic, and in January 2021, sales stood 110% above its year ago level (Chart 6). It’s worthwhile noting that electronic shopping was becoming increasingly popular in Canada prior to COVID-19, but the virus took it to an entirely different level.
The move toward digitalization wasn’t just solely concentrated in the retail sector. In areas where it was possible, work-from-home policies were instituted and businesses made investments to ease the transition. This has increased the resiliency of Canada’s economy. Indeed, as already noted, when Canada was faced with the second wave of the pandemic and renewed restrictions late last year, GDP outperformed market expectations partly because of these structural changes. While further reopening of the economy could reverse the digitalization trend somewhat, e-commerce and work-from-home policies will almost certainly remain popular in the post-pandemic world.
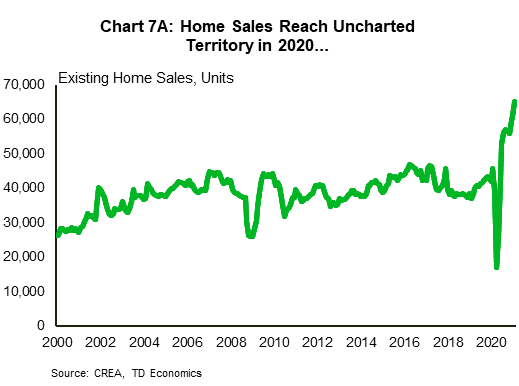
7. Housing Market Frenzy
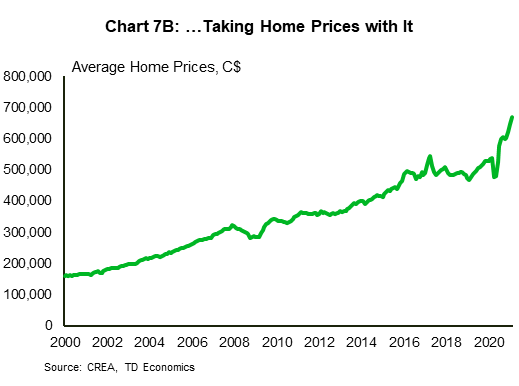
Finally, who could forget the housing market frenzy? At the onset of the pandemic, there were housing concerns, no doubt. But these fears were of a housing market collapse, not of overheating. Rock-bottom mortgage rates, relatively secure employment for higher paid workers, and a desire for more space while working from home, generated extraordinary homeownership demand beginning in the summer of 2020 and has yet to fade. By February 2021, the level of existing home sales was 43% higher, while prices were 25% above what they were last year (Chart 7A; Chart 7B). The rapid increase in activity indicates some segments of Canada’s housing market, at the very least, have moved well above their levels supported by fundamentals, something the Bank of Canada has also acknowledged in recent weeks. Coming out of the pandemic, the current pace of housing activity is unlikely to last into 2022. Rising mortgage rates, and affordability constraints will probably bite, likely in the second half of this year, leading to a tapering off of price growth. (see forecast). Barring this, regulators and governments will probably implement additional macroprudential or tax policies to slow down this juggernaut. Either way, we are likely to see a significant cooldown over the next 2-3 quarters.
Housing market strength hasn’t existed in a vacuum, however. It’s provided ample assistance to Canada’s economic recovery by, one, spurring greater residential construction. Housing starts are currently at levels last seen in the early 2000s. And two, encouraging housing-related spending. Home renovation spending in the fourth quarter of 2020 was 10% above its pre-virus level, while housing-related goods expenditure was 11% above. These trends are likely to continue as long as the housing market remains white hot.
Concluding Remarks
The pandemic has had a profound impact on the economy. Some of the trends kick-started by the crisis will probably weaken as the pandemic fades from view, while others are likely to have more staying power. The Canadian economy will emerge from the downturn more resilient to future health crises, but also saddled with new challenges.
End Notes
- Low paying jobs consist of agriculture, trade, business, building and other support services, information, culture and recreation, accommodation and food services, and other services employment.
Disclaimer
This report is provided by TD Economics. It is for informational and educational purposes only as of the date of writing, and may not be appropriate for other purposes. The views and opinions expressed may change at any time based on market or other conditions and may not come to pass. This material is not intended to be relied upon as investment advice or recommendations, does not constitute a solicitation to buy or sell securities and should not be considered specific legal, investment or tax advice. The report does not provide material information about the business and affairs of TD Bank Group and the members of TD Economics are not spokespersons for TD Bank Group with respect to its business and affairs. The information contained in this report has been drawn from sources believed to be reliable, but is not guaranteed to be accurate or complete. This report contains economic analysis and views, including about future economic and financial markets performance. These are based on certain assumptions and other factors, and are subject to inherent risks and uncertainties. The actual outcome may be materially different. The Toronto-Dominion Bank and its affiliates and related entities that comprise the TD Bank Group are not liable for any errors or omissions in the information, analysis or views contained in this report, or for any loss or damage suffered.
Download
Share: