K, So Where To From Here? An Industrial Outlook For the Canadian Economy
Sri Thanabalasingam, Senior Economist | 416-413-3117
Rishi Sondhi, Economist | 416-983-8806
Date Published: February 2, 2021
- Category:
- Canada
- Commodities & Industry
Highlights
- Canada’s economic recovery is uneven. This has been dubbed as the “K-Shaped Recovery”, but a more apt characterization may be to slice industries into three speeds: overperformers, middle of the pack, and underperformers.
- Overperformers have benefitted from shifting spending patterns, whereas underperformers have been constrained by the spread of the virus and associated restrictions. Middle of the pack industries have seen mixed fortunes across subsectors.
- Looking over the remainder of 2021, the gaps are expected to narrow. Easing health concerns and restrictions, should allow for strong gains in underperforming industries. At the same time, some overperformers could see output normalize from elevated levels.
- However, pandemic impacts will linger, keeping leaders well ahead of the laggards. Indeed, it could take a few years before the Canadian economy finds its post-pandemic equilibrium.
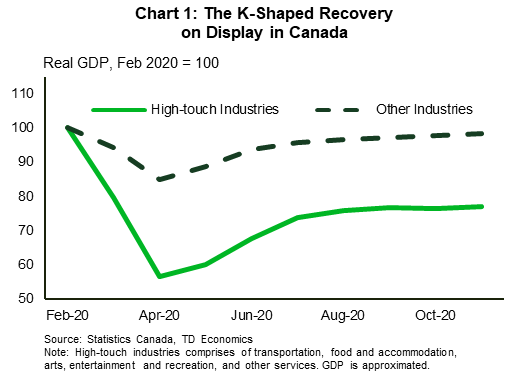
It’s a well-known fact that the pandemic has hit some parts of the economy harder than others. Industries that are “high-touch” – those requiring a high level of personal contact – have struggled mightily due to the rapid spread of the virus and associated government restrictions, while others have recovered quickly, with some even benefitting from shifting spending trends. This phenomenon has been dubbed as the “K-Shaped Recovery” (Chart 1).
However, characterizing the economy’s uneven recovery as “K-shaped” implies a two-speed economy – the underperformers and the rest. We believe that a more apt characterization is slicing Canadian industries into three distinct speeds (Table 1):
- Outperformers: the 9 industries that top the charts in terms of the GDP recovery in November;
- Middle of the pack: the middle third that have generally followed the dynamics of the overall economy. Every industry in this group was within 5% of its February level in November;
- Underperformers: the 9 industries that have been hit the hardest, with GDP well below pre-pandemic levels.
Table 1 ranks industries according to their November output performances relative to pre-virus. It’s worth noting that these rankings have not been completely static over the course of the pandemic. For instance, utilities shifted from being above a top performer in July to a middling performer in November. As another example, continued strength in non-durable manufacturing resulted in the industry moving from the middle of the pack category in July to the outperformer ranking by November.
At the top end of the scale, a select few industries have managed to consistently outperform since lockdowns ended last spring. The retail industry has enjoyed an especially robust recovery. Work-from-home policies, restrictions on high-touch services, and health worries, meant more time at home for many individuals. And as a consequence, there was a surge in furniture and home furnishing purchases. Home renovation activity, as well, was very strong through the second half of last year. The pandemic also accelerated a long-standing trend towards online shopping. By November, output in the non-store retailer’s subsector stood a massive 20% above its pre-pandemic level.
Table 1: Table 1: GDP Performance by Industry Relative To February 2020 (Feb = 100)
| Ranking | Industry | April | July | November | % chg Feb to April | % chg April to July | % chg July to Nov |
|---|---|---|---|---|---|---|---|
| Outperformers | Non-Store Retailers | 118.2 | 123.4 | 120.4 | 18.2% | 4.4% | -2.4% |
| Build Material & Garden Equip & Supplies Dealer | 84.6 | 103.5 | 117.4 | -15.4% | 22.4% | 13.4% | |
| Furniture and Home Furnishings Stores | 36.6 | 102.7 | 109.5 | -63.4% | 180.8% | 6.6% | |
| Agriculture, Forestry, Fishing and Hunting | 100.5 | 103.0 | 105.8 | 0.5% | 2.5% | 2.7% | |
| Finance and Insurance | 98.2 | 100.7 | 104.0 | -1.8% | 2.5% | 3.4% | |
| Other Retail | 77.2 | 100.7 | 102.6 | -22.8% | 30.6% | 1.9% | |
| Real Estate and Rental and Leasing | 95.0 | 100.6 | 101.8 | -5.0% | 5.9% | 1.2% | |
| Wholesale Trade | 77.5 | 99.3 | 101.4 | -22.5% | 28.1% | 2.1% | |
| Non-Durable Manufacturing Industries | 83.8 | 97.5 | 99.8 | -16.2% | 16.4% | 2.3% | |
| Middle of the Pack | Warehousing and Storage | 94.2 | 98.0 | 99.6 | -5.8% | 4.0% | 1.7% |
| Public Administration | 94.2 | 97.6 | 98.8 | -5.8% | 3.7% | 1.2% | |
| Professional, Scientific and Technical Services | 87.0 | 93.4 | 98.1 | -13.0% | 7.3% | 5.0% | |
| Information and Cultural Industries | 91.8 | 95.4 | 98.0 | -8.2% | 3.8% | 2.8% | |
| Educational Services | 82.4 | 93.0 | 97.3 | -17.6% | 12.8% | 4.7% | |
| Health Care and Social Assistance | 80.0 | 92.4 | 96.6 | -20.0% | 15.4% | 4.6% | |
| Overall | 82.3 | 93.8 | 96.5 | -17.7% | 13.9% | 3.0% | |
| Utilities | 96.6 | 100.9 | 96.4 | -3.4% | 4.4% | -4.4% | |
| Construction | 76.2 | 94.0 | 95.3 | -23.8% | 23.4% | 1.4% | |
| Durable Manufacturing Industries | 63.2 | 91.3 | 95.1 | -36.8% | 44.3% | 4.2% | |
| Underperformers | Motor Vehicle and Parts Dealers | 34.6 | 91.7 | 94.6 | -65.4% | 165.1% | 3.2% |
| Management of Companies and Enterprises | 89.1 | 91.4 | 91.6 | -10.9% | 2.5% | 0.2% | |
| Adminis & Support, Waste Mgmt & Remediation Svcs | 71.8 | 84.2 | 91.1 | -28.2% | 17.3% | 8.2% | |
| Mining, Quarrying, & Oil & Gas Extraction | 86.0 | 85.0 | 89.7 | -14.0% | -1.2% | 5.5% | |
| Other Transportation | 75.1 | 87.6 | 89.7 | -24.9% | 16.7% | 2.3% | |
| Other Services | 62.0 | 84.6 | 89.7 | -38.0% | 36.5% | 6.0% | |
| Accommodation and Food Services | 36.6 | 66.2 | 66.9 | -63.4% | 80.7% | 1.1% | |
| Arts, Entertainment and Recreation | 44.7 | 46.0 | 51.8 | -55.3% | 2.9% | 12.6% | |
| Air Transportation | 3.4 | 7.9 | 16.8 | -96.6% | 133.4% | 112.4% |
Like retail, the real estate, and finance and insurance industries experienced sharp rebounds in GDP since lockdown measures eased last spring. A whole host of factors including pent-up demand, low rates, and resilience in high-wage employment contributed to booming real estate activity. This strength spilled over to the finance and insurance industry, which was simultaneously benefitting from solid advances in capital markets.
Another standout performer was the agriculture, forestry, fishing and hunting industry. While most of the economy saw losses during the spring lockdowns, the primary sector posted gains. Buoyed by robust U.S. housing demand and unfettered demand for crops, production has grown steadily in this industry.
Moving to the bottom of the rankings, we find the industries that have struggled mightily during the pandemic. Most of these are “high-touch” industries, whose ability to supply goods and services has been severely hampered by industry shutdowns and restrictions imposed by governments during the pandemic. The accommodation/food services and arts/entertainment/recreation industries have born the brunt of the damage from these measures, although they’ve also impacted personal services. In other hard-hit industries, business closures and mostly empty office buildings have weighed on industries within administration and support services. Meanwhile, output has barely recovered at all in air travel, amid travel restrictions and bans. The effective drying up of jet fuel demand added to the woes of the global oil industry, with Canada’s oil patch following a distinct L-shaped path through November.
Finally, in the middle third of the rankings are those industries that have turned in average performances. These industries have experienced strong rebounds in output but are still some ways away from returning output to pre-pandemic levels.
A general theme for nearly all industries included in the middle category was the uneven performances across subsectors. For example, in the construction sector, resilient homebuilding has been a tailwind for growth, but at the same time, heightened uncertainty caused businesses to shelve investment plans, weakening non-residential construction. Another example is the health care and social assistance industry, where health care services was lifted by firm public spending, but protracted recoveries in ambulatory and social assistance services, have held back further advance.
Uneven Recovery To Narrow In 2021 But Many Will Still Struggle To Reach Pre-Pandemic Levels
The widely varying recoveries across industries is likely to remain an important theme for the Canadian economy through 2021. While we expect industry performance groupings to be largely unchanged by the end of this year, the laggards are poised to record strong gains off an extremely low base. This should shrink the gap, but outperformers and those in the middle-of-the-pack will maintain healthy leads in terms of relative output levels.
Our forecast assumes that the vaccine rollout accelerates, pandemic-related risks decline, and provincial governments gradually lift restrictions. In this environment, we expect Canadian consumers to channel some of the sizeable excess savings built up in recent months to areas of the economy that were largely unavailable to them for almost the entirety of 2020. Restaurants, recreation services, arts and entertainment centres, among other related businesses stand to see outsized gains in 2021. Air travel will probably also see robust increases in GDP, but this could come with a lag as airlines have significantly reduced flight capacity, and it will take time to get back running at a more normal level. Moreover, business travel demand could be slow to recover.
Although growth will likely be elevated for high-touch services, several will remain well under water with respect to their performances pre-virus (Table 2). The pandemic’s impact on spending behaviours is likely to have staying power. Also, a lingering preference to reduce debt burdens, could keep savings elevated relative to pre-pandemic norms, thereby capping growth in discretionary spending. What’s more, higher rates of bankruptcies among business will have reduced the economic capacity of these sectors. Therefore, high-touch services will account for a persistently smaller share of the Canadian economy relative to February 2020.
Table 2: Industry Outlook
| Industry | GDP Index in Nov 2020 | GDP Index in Dec 2021 | % Change from Nov to Dec | Share of GDP in Feb 2020 | Share of GDP in Dec 2021 |
|---|---|---|---|---|---|
| Non-Store Retailers | 120.4 | 128.8 | 6.9% | 0.2% | 0.3% |
| Build Material & Garden Equip & Supplies Dealer | 117.4 | 111.8 | -4.7% | 0.4% | 0.4% |
| Agriculture, Forestry, Fishing and Hunting | 105.8 | 111.6 | 5.4% | 2.2% | 2.4% |
| Finance and Insurance | 104.0 | 110.1 | 5.8% | 7.0% | 7.7% |
| Warehousing and Storage | 99.6 | 107.6 | 8.1% | 0.2% | 0.2% |
| Real Estate and Rental and Leasing | 101.8 | 105.8 | 4.0% | 12.8% | 13.4% |
| Information and Cultural Industries | 98.0 | 103.7 | 5.8% | 3.3% | 3.4% |
| Professional, Scientific and Technical Services | 98.1 | 103.6 | 5.6% | 6.1% | 6.3% |
| Furniture and Home Furnishings Stores | 109.5 | 103.3 | -5.7% | 0.2% | 0.2% |
| Public Administration | 98.8 | 103.1 | 4.3% | 6.8% | 6.9% |
| Non-Durable Manufacturing Industries | 99.8 | 103.0 | 3.2% | 4.5% | 4.6% |
| Wholesale Trade | 101.4 | 102.8 | 1.4% | 5.2% | 5.3% |
| Health Care and Social Assistance | 96.6 | 102.2 | 5.8% | 7.1% | 7.2% |
| Educational Services | 97.3 | 101.9 | 4.7% | 5.3% | 5.3% |
| Overall | 96.5 | 101.0 | 4.7% | - | - |
| Construction | 95.3 | 100.9 | 5.9% | 7.3% | 7.3% |
| Utilities | 96.4 | 100.6 | 4.3% | 2.1% | 2.1% |
| Other Retail | 102.6 | 99.5 | -3.0% | 3.4% | 3.3% |
| Durable Manufacturing Industries | 95.1 | 98.7 | 3.9% | 5.3% | 5.1% |
| Motor Vehicle and Parts Dealers | 94.6 | 98.1 | 3.7% | 0.8% | 0.8% |
| Adminis & Support, Waste Mgmt & Remediation Svc | 91.1 | 95.5 | 4.8% | 2.6% | 2.5% |
| Other Transportation | 89.7 | 95.5 | 6.5% | 3.7% | 3.5% |
| Other Services | 89.7 | 94.6 | 5.5% | 1.9% | 1.8% |
| Mining, Quarrying, & Oil & Gas Extraction | 89.7 | 94.3 | 5.2% | 7.8% | 7.3% |
| Management of Companies and Enterprises | 91.6 | 89.3 | -2.5% | 0.4% | 0.3% |
| Accommodation and Food Services | 66.9 | 76.3 | 13.9% | 2.2% | 1.6% |
| Arts, Entertainment and Recreation | 51.8 | 69.2 | 33.6% | 0.8% | 0.6% |
| Air Transportation | 16.8 | 41.7 | 148.1% | 0.5% | 0.2% |
Another area of the economy that could see an acceleration in its recovery but have output remain below pre-pandemic levels is the mining, quarrying, and oil and gas industry. Returning domestic and foreign demand has boosted oil prices in recent months, gains that we believe will be sustained. The higher price environment will provide much-needed respite to an industry that was already challenged prior to the pandemic. However, the pick-up in growth is unlikely to fully offset 2020 losses, leading to a reduction in its share of the economy.
The vaccine could also fuel advances in middle-of-the-pack industries. But unlike the laggards, pre-pandemic levels are well within reach for this group. We expect output in nearly all industries in this category to return to February 2020 levels this year.
While industries with below average or average performances begin to heal faster, several outperformers could experience slower growth in 2021. Specifically, retail subsectors such as furniture and home furnishing stores, as well as building material and garden equipment and supplies dealers will likely see output fall more in line with their longer term trends as consumers partially re-orient their spending towards services. Despite the decline, we anticipate output in these subsectors will remain above pre-pandemic levels.
Contrary to housing goods spending, demand conditions may remain robust for non-store retailers. The pandemic turbocharged an ongoing shift towards online shopping, and while some individuals will revert to visiting brick and mortar stores, others may enjoy the ease of virtual shopping even with the vaccine rollout. As such, the increase in output in non-store retailers last year will likely see little reversal in 2021.
Another industry that could see a moderation in growth is real estate and rental and leasing. With home sales activity set to cool from extraordinary highs this year, GDP growth in the industry is slated to slow to its pre-pandemic trend.
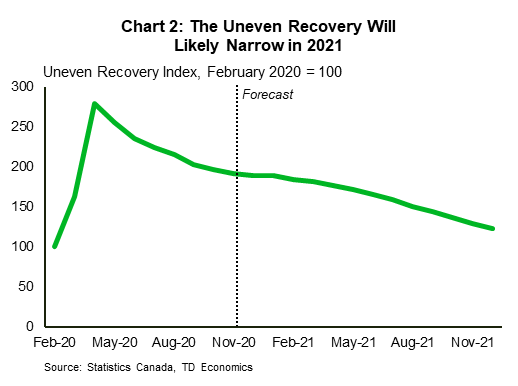
Given the expected slowdown in growth across industries that outperformed in 2020, combined with an acceleration among underperforming ones, the uneven recovery should narrow in 2021. The uneven recovery index shown in Chart 2 measures the standard deviation of GDP across industries in our baseline outlook relative to a no pandemic scenario. If the index moves above 100, there is greater dispersion among industries’ output performance relative to more normal times. As expected, the index was at its peak in April 2020 during the spring lockdowns and has since declined. We expect, after a brief stabilization due to the second wave of the pandemic and associated restrictions, the index will continue to decline steadily. However, it will not return to 100 by the end of the year as the “pre-pandemic” normal is still probably more than a year away.
Bottom Line
2021 could be the year the Canadian economy gets back on its feet. If all goes according to plan, the vaccines will reduce health worries, and allow authorities to remove pandemic-related restrictions. Consumer spending habits could slowly return to pre-pandemic norms, while businesses would feel more secure in resuming investment plans. This will lead to a narrowing of the distinctly uneven economic recovery across industries, but there will continue to be a sizeable gap between the leaders and laggards. Pandemic impacts will linger, holding back growth in the hardest hit industries. Indeed, it could take a few years before the Canadian economy finds its post-pandemic equilibrium.
Disclaimer
This report is provided by TD Economics. It is for informational and educational purposes only as of the date of writing, and may not be appropriate for other purposes. The views and opinions expressed may change at any time based on market or other conditions and may not come to pass. This material is not intended to be relied upon as investment advice or recommendations, does not constitute a solicitation to buy or sell securities and should not be considered specific legal, investment or tax advice. The report does not provide material information about the business and affairs of TD Bank Group and the members of TD Economics are not spokespersons for TD Bank Group with respect to its business and affairs. The information contained in this report has been drawn from sources believed to be reliable, but is not guaranteed to be accurate or complete. This report contains economic analysis and views, including about future economic and financial markets performance. These are based on certain assumptions and other factors, and are subject to inherent risks and uncertainties. The actual outcome may be materially different. The Toronto-Dominion Bank and its affiliates and related entities that comprise the TD Bank Group are not liable for any errors or omissions in the information, analysis or views contained in this report, or for any loss or damage suffered.
Download
Share: