Highlights
- The COVID-19 recession will go down in history for its unique and, in many cases, counterintuitive outcomes. Diverging from the past, many households will emerge from the recession in better financial shape than when they entered, with higher savings and wealth.
- Debt deferrals and income support payments helped to prevent an insolvency tsunami and to maintain home values. Lower interest rates also helped to reduce financial pressures stemming from higher debt burdens.
- Household debt continued to rise last year, with borrowing mostly fuelled by mortgages, while unsecured debt balances, including credit cards and unsecured lines of credit, declined.
- Despite the increase in debt, household leverage remained lower than it was prior to the pandemic. However, the debt to income ratio looks to surpass it’s elevated pre-pandemic level by mid-2021.
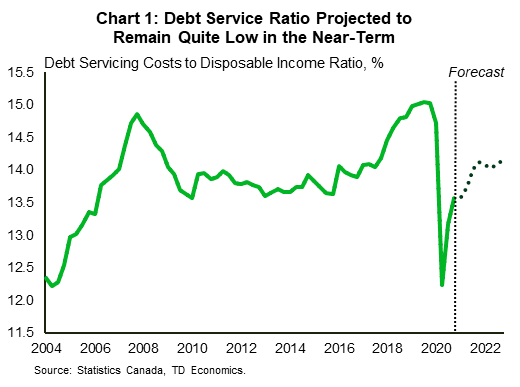
- Debt servicing costs, meanwhile, are expected to remain quite low for at least another two years. Hopefully, this will give households enough time to prepare for higher interest rates down the road.
- All in all, risks surrounding Canadian household debt appear to have diminished, for now. While the debt pile is larger than it was at the start of the crisis, this has been mitigated by higher savings and wealth, and lower interest rates.
The COVID-19 recession will likely go down in history as unique in many respects. In a clear divergence from the past, many households, particularly those that were able to retain jobs, will likely emerge out of the recession in better financial shape than when they entered. The underlying story is certainly nuanced, with varying outcomes across different segments of population (see report), but when viewed as a whole, the highly-leveraged Canadian household sector has managed to navigate the turbulent waters thanks to unprecedented government financial support and payment deferrals offered by lenders. With ample savings, higher wealth and low debt servicing costs, financial risks stemming from household debt appear to have diminished, at least for now.
Where We Were and Where We Are
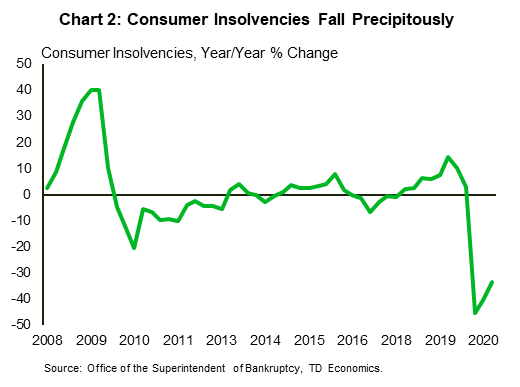
At the start of the pandemic, household finances were under strain, with consumer insolvencies rising swiftly. Debt servicing costs – the amount of income households allocate to service their debt – reached an all-time high in the second half of 2019 (Chart 1). This squeezed how much households could spend or set aside for a rainy day. As a result, growth in retail sales slowed even as the household saving rate averaged just a puny 1.1% in the two years prior to the pandemic.
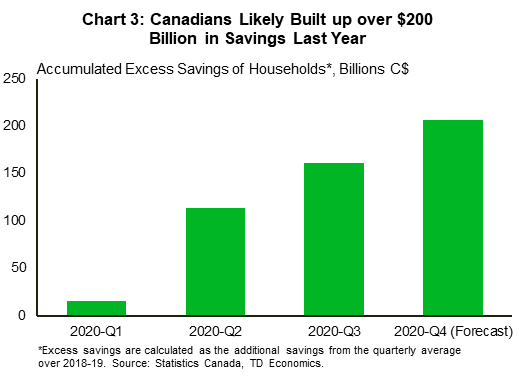
Fast forward to the present. After plummeting at the start of the crisis, consumer insolvencies have since edged up, but, as of the end of 2020, were still down by nearly 30% (Chart 2). In fact, the decline in consumer insolvencies is the mirror image of the increase experienced during the global financial crisis. At the same time, the household saving rate surged to nearly 30% at the peak of the crisis as spending plummeted due to lockdowns and income rose thanks to government support programs. The household saving rate has since fallen to 12.7% in the fourth quarter of 2020, but remains elevated relative to history. All in all, we estimate that over the course of 2020, households have accumulated around $200 billion in excess savings (Chart 3, report).
Debt Pile Continues to Grow…
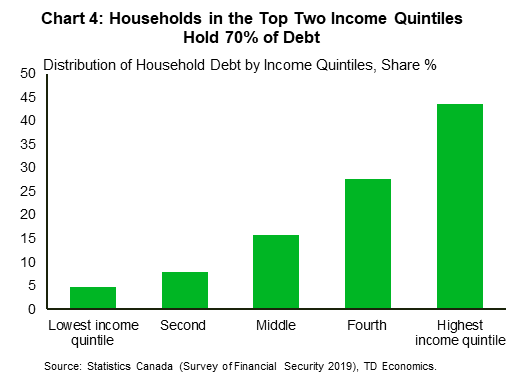
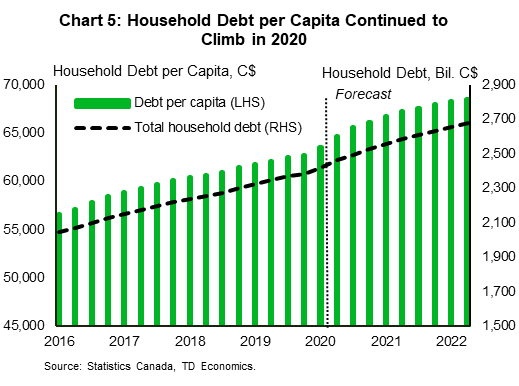
With Canadians saving at never-before-seen levels, one would think that the extra cash in bank accounts combined with high uncertainty and joblessness, would limit household appetite for credit. And, indeed, balances on credit cards and lines of credit have declined. Nonetheless, total household debt still managed to rise last year. We chalk up the resilience of overall borrowing to three factors. First, debt deferrals and government income supports helped most borrowers to remain current on their debt payments. This, in turn, prevented mass defaults and a decline in the stock of debt that would have followed. Second, due to the outsized impact of the pandemic on lower-skilled jobs, most higher-income households, which hold the bulk of the household debt (Chart 4), have continued to borrow. Third, falling mortgage rates reduced borrowing costs and increased demand for mortgages. As result, household debt ended last year higher both in absolute (+4.1% y/y) and per capita terms (Chart 5).
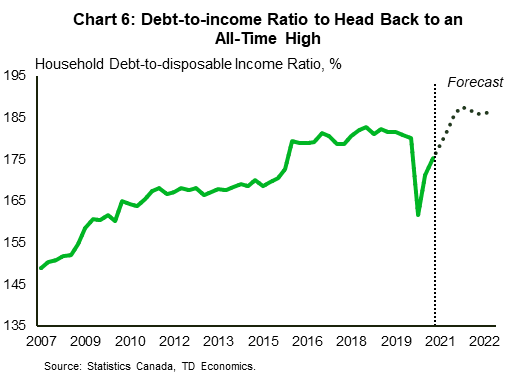
As a share of household disposable income, overall debt remains lower than it was prior to the pandemic. However, this largely reflects the strong lift to disposable income (i.e., the denominator) provided by government income support programs. This temporary improvement has already begun to reverse and, based on our income and debt growth projections, the debt-to-income ratio could surpass its pre-pandemic level in the coming quarters (Chart 6).
… Fueled Mostly by Mortgages
Even before the pandemic, mortgages accounted for the lion’s share of household debt in Canada. However, the pandemic supercharged the housing market, with mortgage loans rising at a brisk clip of 7.6% year-over-year (y/y) at the end of last year – a pace not seen since 2011. As a result, mortgages made up 68% of the total household debt at the end of 2020 – up from 66% just a year earlier. If we add other real estate secured credit, such as HELOCs and non-residential mortgages, this share rises to 78.5% - a historical high since Statistics Canada began collecting its data in 1990. HELOC debt declined in the first half of 2020, but rebounded briskly over the latter half of the year alongside booming home sales and increased home renovations. Personal loans – consisting mainly of auto loans – also benefited from the booming housing market. Following a small decline during the spring lockdown, balances on personal loans were quick to rebound, supported by the solid demand for cars.
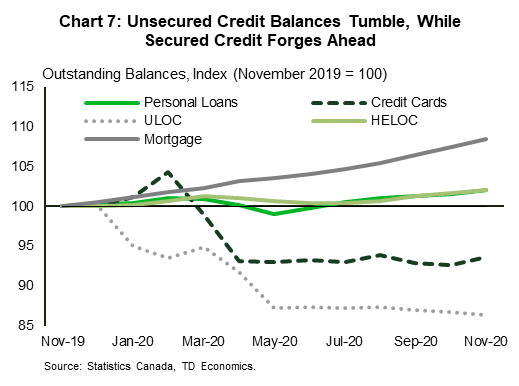
If there is one area where households have tapered their borrowing, it’s unsecured consumer credit (credit cards and unsecured lines of credit), where balances are 12% lower than a year ago (Chart 7). Most of the decline occurred in the spring, when tough lockdown measures significantly limited spending options, leading to a sharp drop in household outlays. However, even as the economy reopened and online shopping proliferated, balances on credit cards and lines of credit remained subdued as saving rate remained high and spending options limited, particularly on travel, entertainment and dining out.
Low-Income Households Get a Temporary Reprieve
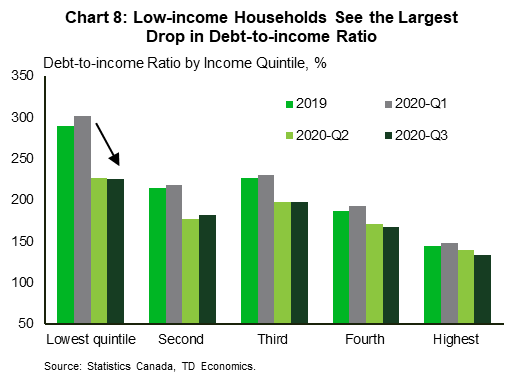
In recent reports we have discussed the uneven impact the pandemic has had on various demographic groups. Lower income and younger Canadians, in particular, have experienced disproportional job losses. Government income support programs have helped to mitigate losses, and in many cases more than offsetting the drop in wage income. Indeed, as a result of these measures, lower-income households have seen the largest boost to disposable income, which surged by 34% in the second quarter of 2020. This led to a decline in the income gap between the lowest- and the highest-income households. As a direct result of government measures to shore up income, lower-income households have also seen the largest decline in their debt-to-income ratio (Chart 8).
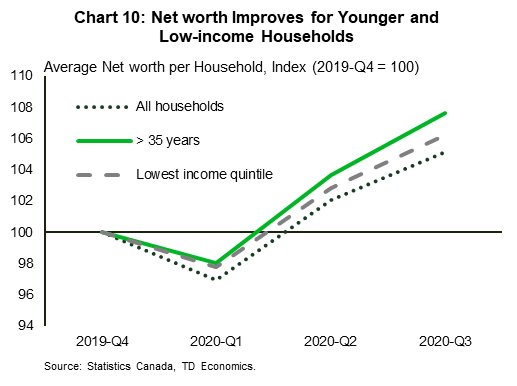
A portion of those income support payments have been used for debt repayment. According to Statistics Canada, households in the lowest income quintile reduced their non-mortgage debt more than households in other income brackets. Non-mortgage debt balances have also declined across all age groups, except for the youngest borrowers (those between the ages of 18 and 25) (Chart 9). While reducing or limiting their non-mortgage debt accumulation, younger and lower-income households increased their mortgage liabilities at a faster rate than other households.1 With home prices rising briskly last year, increased participation in the housing market has likely paid off: low-income and younger households experienced larger improvements in net worth relative to other households (Chart 10).

Overall, these developments are encouraging. We know that most households filing for insolvency are lower-income renter households. In 2019, less than one-fifth of households declaring insolvency, were homeowners.2 In contrast, nearly 90% of those financially struggling households had credit card debt, with the median balance of nearly $14,000. This is nearly five times above median credit card and installment debt for an average household, which amounted to $3,000 in 2019.
Taking a longer view, improvements in income and wealth last year did little to address the persistent income and wealth gaps that exist for low-income and young households. Wealth held by low-income households is on average just 30% of wealth held by the average-earning household. Meanwhile, households in the highest income brackets hold roughly 2.5 more wealth than the average household. These inequalities have changed very little during the pandemic, but at least, thanks to the government programs, they have not become worse. Looking ahead, significant deterioration in housing affordability, structural changes in the economy and the eventual reduction in government support payments may pose risks to the financial well-being of low-income and younger households.
Risks Shift to the Back Burner for Now
All in all, risks surrounding Canadian household debt appear to have abated, at least for now. While the debt pile is larger than it was at the start of the crisis, this is mitigated by higher level of household savings, lower interest rates, and higher net worth which is up 9% from the year ago, thanks to booming equity values and home prices. Still-accommodative fiscal and monetary policies will help to keep default risks at bay. Surveys show that households used about a third of CERB payment to pay down debt last year. A decline in unsecured debt balances is a positive development as well since this type of debt often carries higher interest rate relative to other debt forms. These type of loans are also more susceptible to future interest rate increases, since much of this category is made up of variable rate loans.
For the time being, rates and debt servicing costs remain low, however, the outlook is not without risks. While both the Bank of Canada and the Federal Reserve have communicated their intentions to keep rates low for a considerable period of time, large household savings, rising vaccination rates and fiscal stimulus both in Canada and south of the border, could accelerate recovery, prompting earlier than anticipated increases in policy and market-based interest rates. This is already on full display in the bond markets, with 5-year bond yields rising by 40 basis points since the end of January.
Ultimately, higher level of household debt and leverage leaves households more susceptible to future interest rate increases. On this front, debt servicing costs are expected to edge gradually higher but still remain relatively low at least for the next two years, hopefully giving Canadian households time to prepare for higher debt servicing costs down the road.
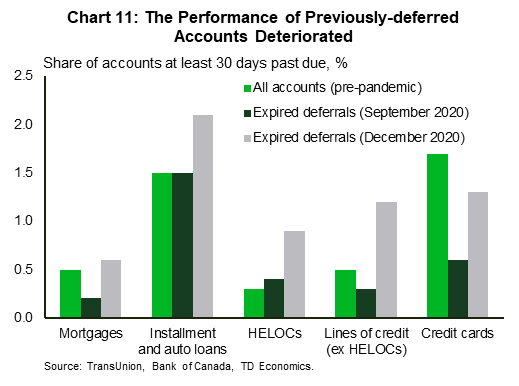
Lastly, while the much-feared deferral cliff has so far not materialized, performance of the previously-deferred accounts deteriorated between September and December. In December, the share of accounts that were at least 30-days past due was higher for accounts with expired deferrals than for all accounts prior to the pandemic - something that was not the case in September (Chart 11). This suggests that this cohort of borrowers continues to experience increased levels of financial stress.
End Notes
- The Daily. "Household economic well-being during the COVID-19 pandemic, experimental estimates, first quarter to third quarter of 2020." Statistics Canada. https://www150.statcan.gc.ca/n1/daily-quotidien/210301/dq210301b-eng.htm
- "Canadian Consumer Debtor Profile – 2019". Office of the Superintendent of Bankruptcy Canada. https://www.ic.gc.ca/eic/site/bsf-osb.nsf/eng/br04358.html
Disclaimer
This report is provided by TD Economics. It is for informational and educational purposes only as of the date of writing, and may not be appropriate for other purposes. The views and opinions expressed may change at any time based on market or other conditions and may not come to pass. This material is not intended to be relied upon as investment advice or recommendations, does not constitute a solicitation to buy or sell securities and should not be considered specific legal, investment or tax advice. The report does not provide material information about the business and affairs of TD Bank Group and the members of TD Economics are not spokespersons for TD Bank Group with respect to its business and affairs. The information contained in this report has been drawn from sources believed to be reliable, but is not guaranteed to be accurate or complete. This report contains economic analysis and views, including about future economic and financial markets performance. These are based on certain assumptions and other factors, and are subject to inherent risks and uncertainties. The actual outcome may be materially different. The Toronto-Dominion Bank and its affiliates and related entities that comprise the TD Bank Group are not liable for any errors or omissions in the information, analysis or views contained in this report, or for any loss or damage suffered.
Download
Share: