Mortgage Renewal Mission Possible: The Final Reckoning
Maria Solovieva, CFA, Economist | 416-380-1195
Date Published: March 4, 2026
- Category:
- Canada
- Real Estate
- Consumer
Highlights
- The mortgage renewal headwind that has suppressed Canadian consumer spending for three years is losing force. In fact, households are now devoting a smaller share of income to debt servicing than a year ago.
- Outstanding mortgages are now more rate-sensitive in aggregate, with a larger share of variable-rate and short-term fixed mortgages. This accelerated the transmission of lower rates and puts downward pressure on aggregate debt payments.
- The debt service ratio is expected to edge higher in the second half of 2026, but this reflects new mortgages as average house prices rise, rather than a relapse in mortgage renewal shock.
For more than two years, one concern that has hung over the Canadian consumer is that spending would be held back by higher payments on mortgages originated at rock-bottom pandemic rates renewing at higher prevailing rates. This is sometimes referred to as the mortgage renewal shock.
In December 2023, we argued that despite the steepest mortgage payment increases in decades, Canadian households could weather the shock. In subsequent reports, we predicted a peak in aggregate mortgage payments and explained why the shock would not destabilize the system — but would act as a modest brake on consumer spending. This is likely our last report on the subject: according to TD’s internal data, Canadian households are approaching the turning point where the shock is behind them.
Debt Servicing Costs Have Fallen
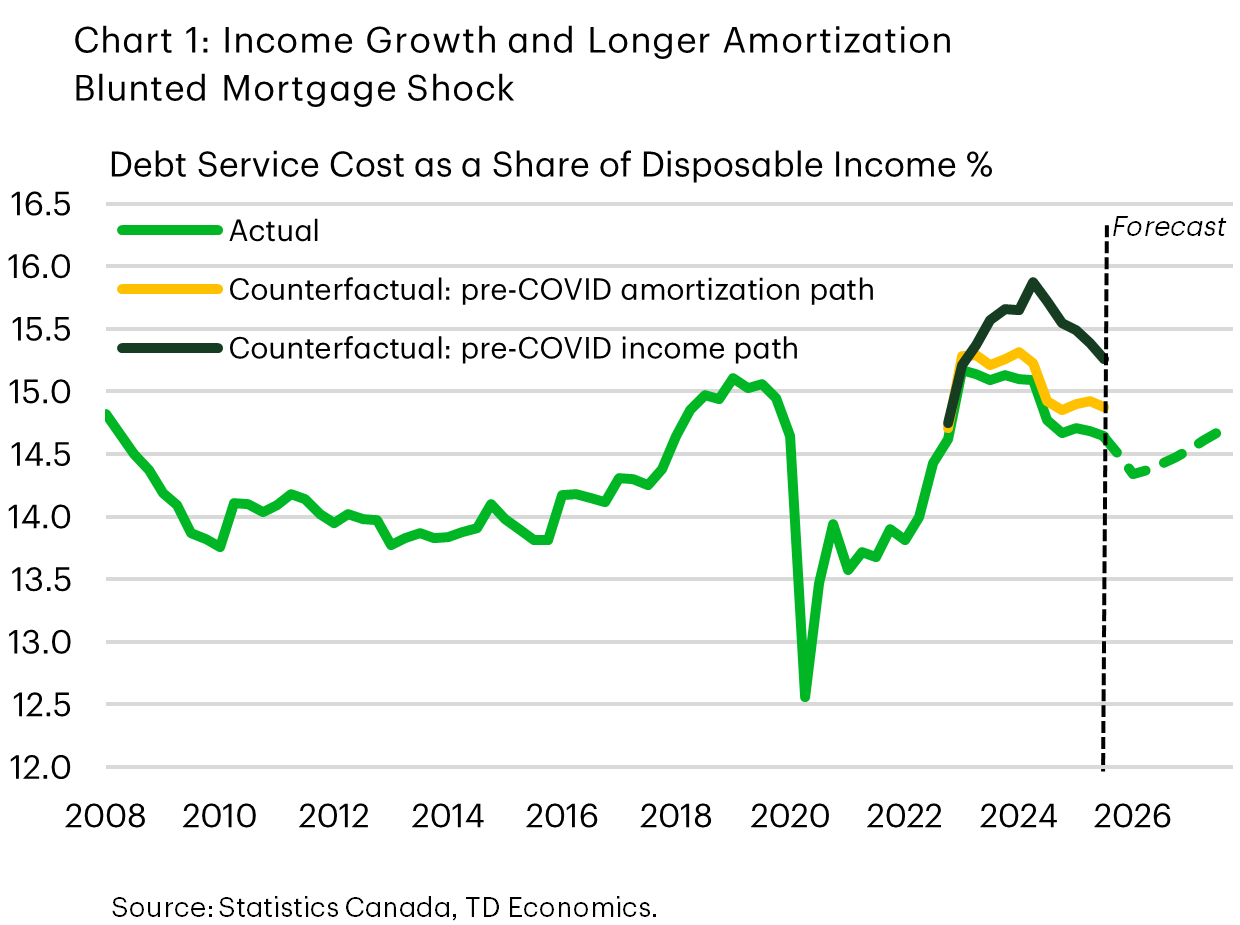
The most telling sign that Canadian households have weathered the renewal shock is also the simplest: they are spending less of their income on debt. The debt service ratio for households is below its recent highs in 2023, suggesting the greatest strain on consumers has already passed (Chart 1). The debt servicing burden has fallen for two reasons: healthy income growth and longer amortizations. The average mortgage amortization length has been increasing since early 2021 and now sits about 16 months longer than before the pandemic – a meaningful buffer against rising rates in 2022 and 2023, though not the dominant driver.
The more important factor has been personal disposable income growth, which has grown much faster over the past three years than in the three years preceding the pandemic. Had income growth instead tracked its pre-pandemic pace, the debt service ratio would have peaked about one percentage point higher, as shown by the dark green path in Chart 1. In other words, faster income growth cushioned a meaningful share of the interest rate shock. This has turned a mortgage “cliff” into a much gentler “hill”.
Pandemic Renewal Cycle Nearing Finish Line
Looking ahead, we expect downward pressure on aggregate debt payments as lower policy rates gradually feed through to debt-servicing costs. Until recently, the dominant renewal dynamic was mortgages originated at ultra-low rates resetting higher. That trend is now reversing.
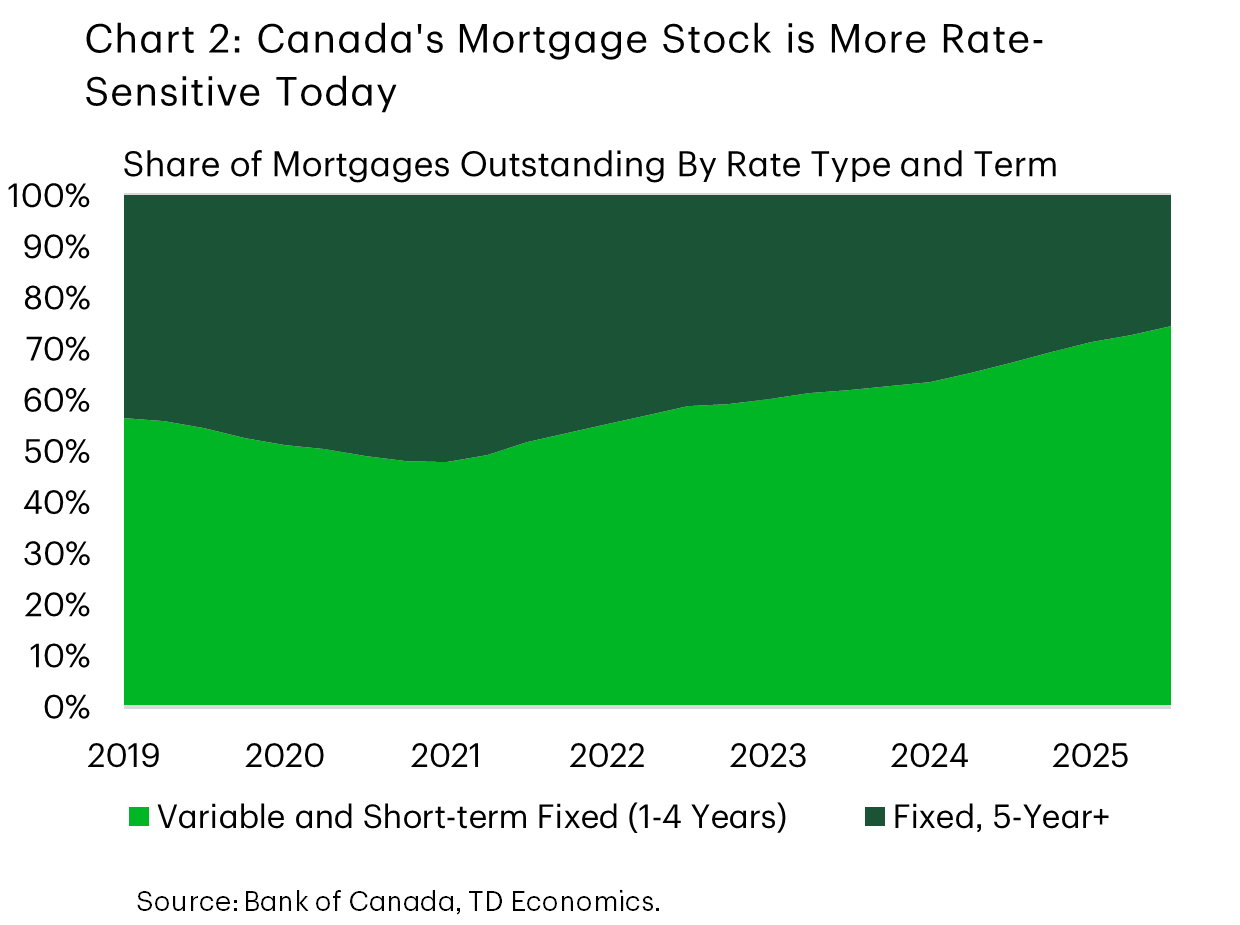
The policy rate doesn’t affect all borrowers simultaneously. Mortgage holders with variable-rate, variable payment adjust immediately; everyone else is insulated until renewal. So, the sensitivity of the national mortgage stock to rate changes depends heavily on the mix of variable-rate and short-term fixed mortgages relative to longer-term ones. In early 2022, that split was roughly 55% (variable plus short-term fixed) to 45% (five-year fixed). By the time the Bank of Canada began cutting rates in 2024, the split had widened to 66-34; today it stands closer to 73-27 (Chart 2). A larger share of the outstanding stock is now rate-sensitive on the way down. This shift implies that recent interest rate cuts should pass through to borrowers more quickly than rate hikes did during the tightening cycle.
Our internal mortgage data confirms that the turning point is on the horizon. Early in 2026, modest payment increases are expected to persist, but by the second half of the year, declines become the dominant outcome as the share renewing into lower rates takes over. Absent additional mortgage growth, aggregate payments would continue to decline as an increasing share of mortgages rolls through at current rates, so the pace of new originations would determine how steep that descent is. As seen in chart 1, the debt service ratio rises starting in the second half of this year, but this reflects new mortgage originations against a backdrop of rising average house prices, rather than higher payments from pandemic-era loans.
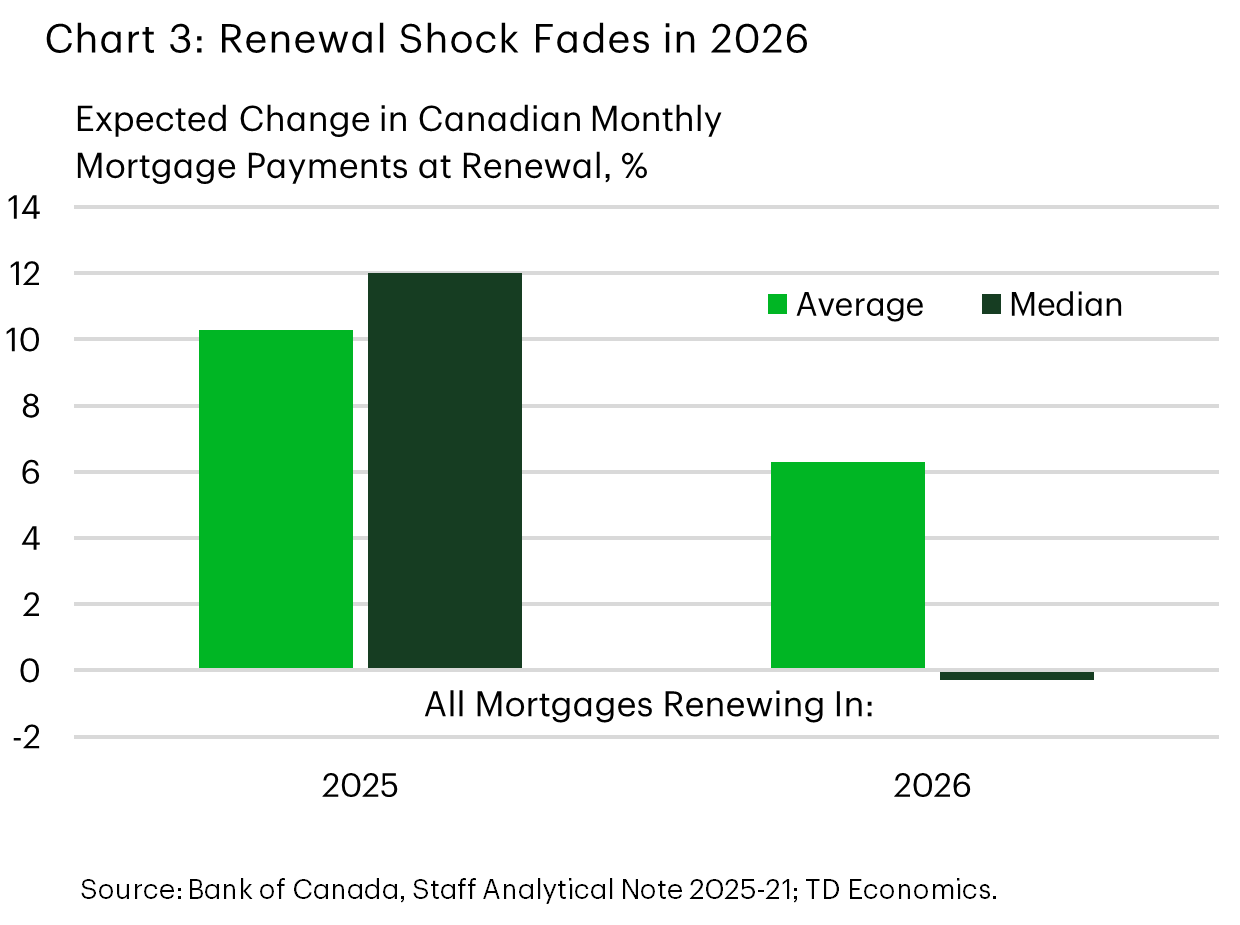
The Bank of Canada’s own analysis, based on end-2025 data, points to similar conclusions, though their focus is on the distribution of payment changes rather than the aggregate1. They find the average payment increase in 2026 running at around 6%, down from 10% in 2025, and a median mortgage payment change of -0.3%, confirming that the composition of 2026 renewals is tilting toward relief (Chart 3).
Mortgage Interest Costs Set to Fall
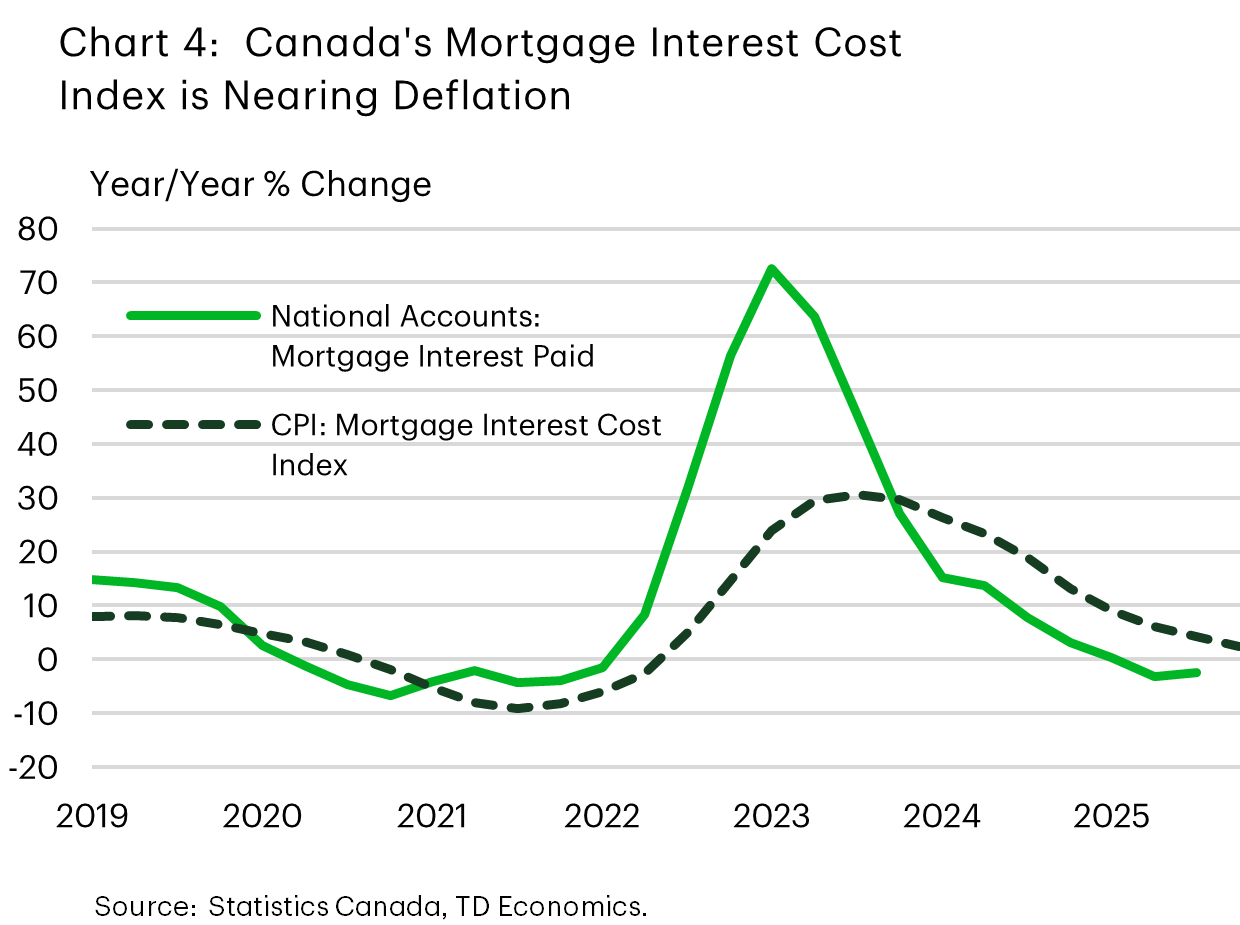
Another way of looking at economy-wide mortgage interest costs is through the Consumer Price Index (CPI), which includes a mortgage interest cost (MIC) component within the ‘owned accommodation’ portion of shelter inflation. In January 2026, MIC inflation rose 1.2% year-on-year basis, down sharply from its peak of 31% in August 2023. This peak occurred roughly six months after the peak in the corresponding mortgage interest measure in the national accounts, reflecting differences in measurement (Chart 4).
The MIC component is designed to measure the cost of maintaining a fixed level of housing service2. It is constructed using two main inputs: changes in dwelling prices and changes in interest rates. The price index effectively “simulates” debt level based on home values assuming that higher prices result in “new” mortgages that enter the existing pool with a 25-year amortization. The interest rate index computes a blended effective interest rate using the monthly Bank of Canada data, and covers a broad spectrum of rates, including variable-rate and fixed-rate terms other than five years.
Because MIC is calculated using a fixed stock of housing, it moves more gradually than national accounts measures, and with a lag of several quarters. But current developments in mortgage payments provide a forward-looking signal for MIC. As interest payments continue to moderate, the conditions for the MIC index to fall, are increasingly present. With MIC inflation still in positive territory at 1.2% in January 2026, it is premature to expect outright deflation in early 2026. The more plausible base case for MIC turning negative end of 2026 – beginning of 2027, based on national accounts’ mortgage interest paid as a leading indicator. Deflation in MICs is unlikely to be dramatic, as interest rates are projected to stabilize well above pre-pandemic levels. But its directional signal is consistent with the broader story: the mortgage renewal headwind that has suppressed consumer spending for three years is losing force.
Bottom Line
For more than two years we have been answering questions about whether Canadian households could survive the steepest mortgage renewal shock in decades, the answer is now clear: they did. The hill was real but navigable, and income growth was the main mountaineer. As the added weight of mortgage renewal payment increases is taken off consumers backs, the balance of risks for Canadian consumer spending should shift in the second half of 2026. The debt service ratio is expected to edge modestly higher in the second half of 2026, but this reflects new mortgages and higher average house prices, rather than higher payments from pandemic-era loans.
End Notes
- Godbout C., Su A., Xu Y, (2025). How will mortgage payments change at renewal? An updated analysis. Staff Analytical Note 2025-21, Bank of Canada. https://www.bankofcanada.ca/2025/07/staff-analytical-note-2025-21/
- Statistics Canada (2023). The Canadian consumer Prince Index Reference Paper. https://www150.statcan.gc.ca/n1/en/pub/62-553-x/62-553-x2023001-eng.pdf?st=jjFpkGGR
Disclaimer
This report is provided by TD Economics. It is for informational and educational purposes only as of the date of writing, and may not be appropriate for other purposes. The views and opinions expressed may change at any time based on market or other conditions and may not come to pass. This material is not intended to be relied upon as investment advice or recommendations, does not constitute a solicitation to buy or sell securities and should not be considered specific legal, investment or tax advice. The report does not provide material information about the business and affairs of TD Bank Group and the members of TD Economics are not spokespersons for TD Bank Group with respect to its business and affairs. The information contained in this report has been drawn from sources believed to be reliable, but is not guaranteed to be accurate or complete. This report contains economic analysis and views, including about future economic and financial markets performance. These are based on certain assumptions and other factors, and are subject to inherent risks and uncertainties. The actual outcome may be materially different. The Toronto-Dominion Bank and its affiliates and related entities that comprise the TD Bank Group are not liable for any errors or omissions in the information, analysis or views contained in this report, or for any loss or damage suffered.
Download
Share: