Mortgage Renewals Won’t Shock the System, but the Pain Will Linger
Maria Solovieva, CFA, Economist | 416-380-1195
Date Published: July 9, 2025
- Category:
- Canada
- Real Estate
- Consumer
- An average mortgage holder who has recently renewed, or is about to, is likely absorbing an increase in monthly payments. Media headlines are raising alarm bells that the ongoing wave of mortgage renewals is a looming “shock”. So, it may come as a surprise to learn that aggregate mortgage payments in Canada are actually declining. Let’s unpack how both dynamics can be true at the same time.
- First, the part that’s well understood: many households are facing higher payments. The most popular mortgage term is five years. So as an example, a borrower with a $500,000 mortgage who locked in a 2.5% mortgage rate in June 2020 would now be renewing at a rate closer to 4.0%, with monthly payments rising by about $320. According to a Bank of Canada report published earlier this year, about 60% of outstanding mortgages will renew by the end of 2026, and 40% are expected to renew at higher rates. This is the looming mortgage shock the media is warning about.
- Yet nationally – as odd as it may sound – aggregate mortgage payments are on the decline, driven by lower mortgage rates. We forecasted this in our November 2024 report, and the data has since confirmed the outcome. In the final two quarter of last year, mortgage interest payments declined by an average of 1.7%, providing enough relief to push total mortgage payments into contraction (Chart 1). How can this contradiction seemingly exist? The answer lies in the composition.

- National mortgage payments are calculated using the aggregate dollar volume, not the number of renewing households. This means high-balance mortgages carry more weight in the total. A sizeable share of these larger mortgages are also variable-rate or shorter-term fixed-rate loans. As the Bank of Canada began its easing cycle in mid-2024, borrowers with these mortgages saw early relief, helping drive aggregate payments lower.
- Consider a stylized example. Imagine an economy with just two households. One with the mortgage profile described above where their monthly payment increases by $320. The other with a mortgage that is two times larger, at $1,000,000. This mortgage is taken under a one-year term with a 5.9% rate. Upon renewal today, that monthly mortgage payment is a whopping $1,480 lower! Even though one household is worse off, the national mortgage payment is now lower – because the higher-balance mortgage dominates the total volume.
- We estimate that more than one-third of mortgages renewing between now and 2026 fall into this “early relief” group – characterized as those with variable-rates or short-term fixed mortgages that will be either renewing at lower rates or are benefitting from interest rate cuts. These borrowers tend to carry above-average balances, which magnifies their effect on the aggregate figures.
- Another group, roughly one-quarter of upcoming renewals, consists of borrowers who entered the market during the rate-hiking cycle. They may face either higher or lower rates at renewal, depending on the original term and the timing of renewal.
- That leaves the remaining 40% of borrowers with mortgage rates rolling over from the ultra-low-rate period of late 2020 to early 2021. These households are most likely to face payment increases, with the peak in renewals expected in Q4 2025 to Q1 2026.
- But this shouldn’t generate a panic. Financial conditions have improved even for this group.
- The national home price index is up more than 25% since early 2020, offering equity to tap into if needed.
- Households have also benefited from rising financial wealth, where assets are up 45%, including a 42% increase in more liquid deposits.
- Average personal disposable income for mortgage borrowers has also risen 27% over the same period.
- These facts suggest that many homeowners have some flexibility to temper the increase in their monthly payment – whether it’s through extending the amortization, refinancing, or pre-paying.
- An improvement in the aggregate picture for homeowners doesn’t mean individual households will avoid strain, particularly among those who may have lost a job or are experiencing a hit to their income.
- We forecast the unemployment rate to peak at 7.3% in Q4 2025, coinciding with a renewal wave that includes many from the ultra-low-rate cohort.
- Those households at the lower end of the income spectrum are likely to feel the squeeze most acutely. Over the past five years, their debt growth has outpaced income gains, creating more vulnerability to rising payments, job loss, or both (Chart 2).
- Likewise, regional disparities are likely to stand out. Provinces with stretched affordability – such as Ontario and British Columbia – are already seeing a faster rise in delinquency rates. With higher average mortgage balances, these provinces face greater vulnerability as renewals ramp up.
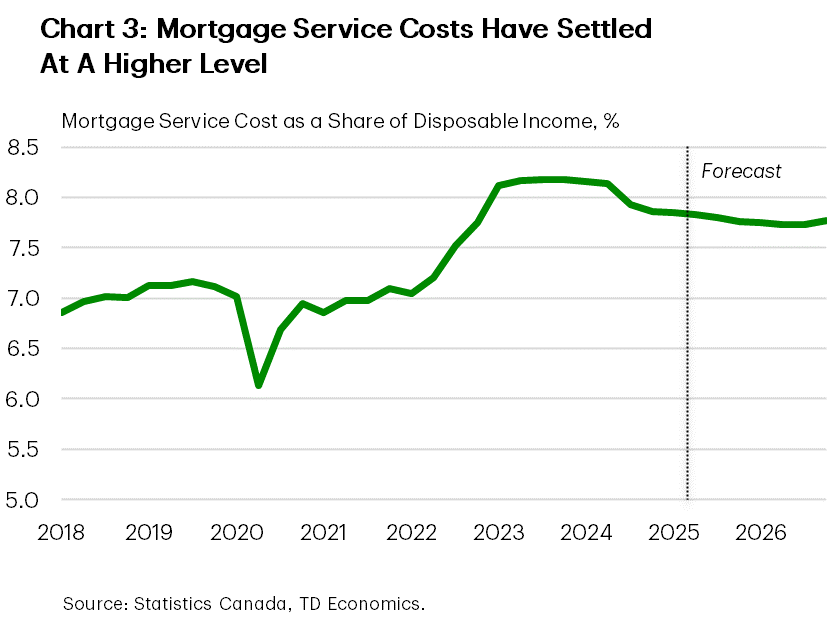
- But for the country as a whole, the downward trend in aggregate mortgage payments is likely to continue through the end of 2025, with some interruption in Q4 2025–Q1 2026. Provided rates continue to decline, especially at the long end, national mortgage payments should remain manageable. Our forecast for the mortgage service ratio – a measure of how much income goes toward payments – maintains improvement through year-end, before hitting a plateau that will remain higher than before the pandemic (Chart 3).
- A strain, but not an acute one. It’s a bit like that ankle injury you got in a dance class or on the field as a teenager: it didn’t hurt too much at the time, but years later, it still keeps you from sprinting. In economic terms, most mortgage borrowers will manage, but with less financial flexibility.
- In contrast, the picture is more concerning for non-mortgage borrowers. This category includes credit cards, personal loans, and credit lines. While non-mortgage debt makes up only about 25% of the total household debt outstanding, it accounts for roughly 45% of total debt payments. These credit facilities typically come with tighter lending conditions – shorter terms, higher interest rates, or both – which lead to higher monthly payments. Households who rely more heavily on this debt tend to have less financial flexibility and are more vulnerable when payments increase. As a result, delinquency rates in this segment are already climbing more quickly.
- This persistent pressure on debt servicing creates a key constraint on consumer spending growth. If unemployment rises more than expected the risk to financial stability would certainly balloon – particularly for lower-income mortgage borrowers in regions with stretched affordability, as well as those carrying large non-mortgage balances. All in all, it will be harder for the consumer to develop a spring in their step.

Disclaimer
This report is provided by TD Economics. It is for informational and educational purposes only as of the date of writing, and may not be appropriate for other purposes. The views and opinions expressed may change at any time based on market or other conditions and may not come to pass. This material is not intended to be relied upon as investment advice or recommendations, does not constitute a solicitation to buy or sell securities and should not be considered specific legal, investment or tax advice. The report does not provide material information about the business and affairs of TD Bank Group and the members of TD Economics are not spokespersons for TD Bank Group with respect to its business and affairs. The information contained in this report has been drawn from sources believed to be reliable, but is not guaranteed to be accurate or complete. This report contains economic analysis and views, including about future economic and financial markets performance. These are based on certain assumptions and other factors, and are subject to inherent risks and uncertainties. The actual outcome may be materially different. The Toronto-Dominion Bank and its affiliates and related entities that comprise the TD Bank Group are not liable for any errors or omissions in the information, analysis or views contained in this report, or for any loss or damage suffered.
Download
Share: