Highlights
- The latest TD Spend data suggest that Canadian consumers tightened their purse strings in the second quarter of 2025. We expect real consumer spending to be essentially flat for the quarter, with weaker momentum likely building into Q3.
- The quarterly spending series is tracking a significant contraction, led by goods. Services spending also lost steam in Q2 and is now tracking a marginal decline.
- At the provincial level, year-over-year growth was strongest in Saskatchewan, the North Region and Quebec. All other provinces are tracking below the national average.
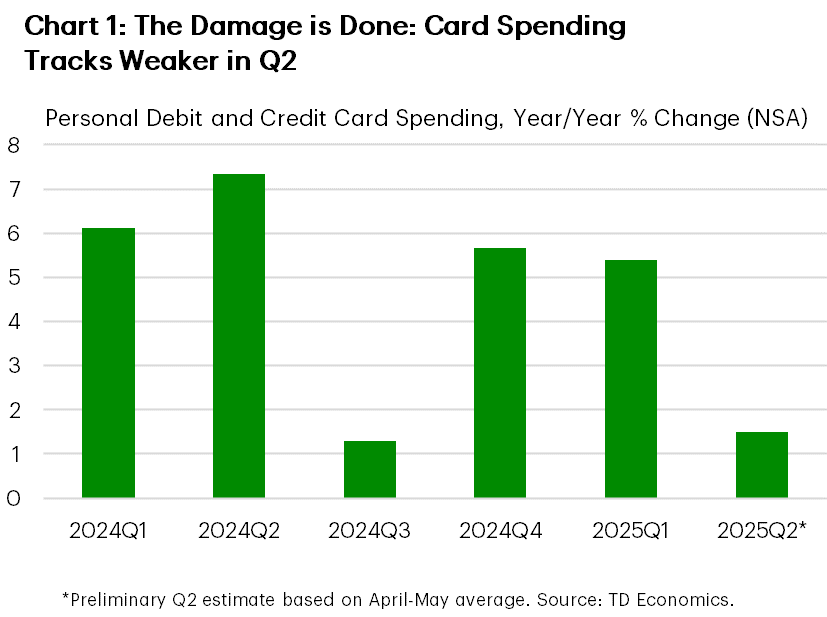
The latest TD debit and credit card spending data suggest that Canadian consumers hit pause in the second quarter of 2025, reacting to escalating trade tensions. On a year-over-year (non-seasonally adjusted) basis, card spending growth slowed sharply to 1.5% in Q2 from 5.4% in Q1 (Chart 1). This marks a clear break from the early signs of momentum seen in late Q4 and reflects growing softness in underlying economic conditions—especially the weakening labour market.
Consistent with this notable deceleration in TD Spend data and what appears to be a sizeable contraction in Statistics Canada’s flash estimate of retail trade, we expect real consumer spending to come in essentially flat for the quarter, with weaker momentum likely building into Q3. While we still expect some recovery toward the end of the year, real personal consumption expenditure (PCE) is now projected to finish 2025 0.4 percentage points lower than anticipated in our March forecast. Consumers unlikely to splurge on large purchases when they’re worried about losing their jobs. Said plainly: the damage is done.
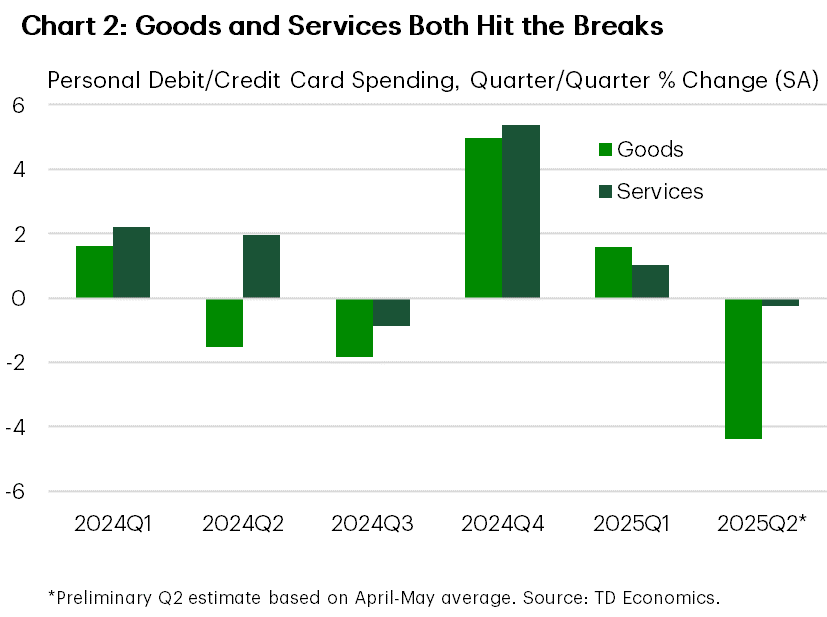
Looking more closely at the breakdown, on a seasonally adjusted basis, TD’s quarterly spending series is tracking a significant contraction, led by goods spending, which is set to decline by 4.4%. Part of this is due to lower outlays at gas stations, reflecting a sharp drop in pump prices. Gas prices collapsed by 18.1% in April compared to a year ago as carbon tax ceased to exist. Still, the pullback was broader. The first two months of Q2 saw declines in spending at supermarkets, liquor stores, clothing retailers, and general merchandise outlets. Home-related purchases are also tracking a sizable decline after a tepid Q1.
In addition, spending on services lost steam in Q2 and is now tracking a marginal contraction. Travel spending is on track for a second consecutive quarterly decline, aligning with official statistics: according to Statistics Canada, the number of returning Canadian air travellers fell 3.7% year-over-year in May. TD card spending on travel declined 4.4% over the same period. This likely reflects a shift away from U.S. trips – which account for a sizeable share of total trips – towards lower-cost domestic destinations. Meanwhile, entertainment and recreation spending accelerated only slightly in Q2 – not enough to offset weakness elsewhere – while other components of services made no meaningful contribution, leaving overall services spending unlikely to provide much support this time.
At the provincial level, year-over-year growth was strongest in Saskatchewan, the North Region (including the Northwest Territories, Nunavut, and Yukon), and to a lesser extent Quebec—all of which are currently outperforming the national average. All other provinces are tracking below the national 1.5% growth rate, with British Columbia the only region currently showing a contraction in Q2. Still, even among outperformers, there’s a clear downshift from the previous quarter. Looking ahead, provinces most exposed to international trade – such as Ontario, Quebec, B.C., and Manitoba – will continue to absorb much of the shock this year. In contrast, Atlantic Canada is likely to remain more stable and Saskatchewan will stand out as a relative beacon of strength amid mounting national headwinds.
Disclaimer
This report is provided by TD Economics. It is for informational and educational purposes only as of the date of writing, and may not be appropriate for other purposes. The views and opinions expressed may change at any time based on market or other conditions and may not come to pass. This material is not intended to be relied upon as investment advice or recommendations, does not constitute a solicitation to buy or sell securities and should not be considered specific legal, investment or tax advice. The report does not provide material information about the business and affairs of TD Bank Group and the members of TD Economics are not spokespersons for TD Bank Group with respect to its business and affairs. The information contained in this report has been drawn from sources believed to be reliable, but is not guaranteed to be accurate or complete. This report contains economic analysis and views, including about future economic and financial markets performance. These are based on certain assumptions and other factors, and are subject to inherent risks and uncertainties. The actual outcome may be materially different. The Toronto-Dominion Bank and its affiliates and related entities that comprise the TD Bank Group are not liable for any errors or omissions in the information, analysis or views contained in this report, or for any loss or damage suffered.
Download
Share: