Highlights
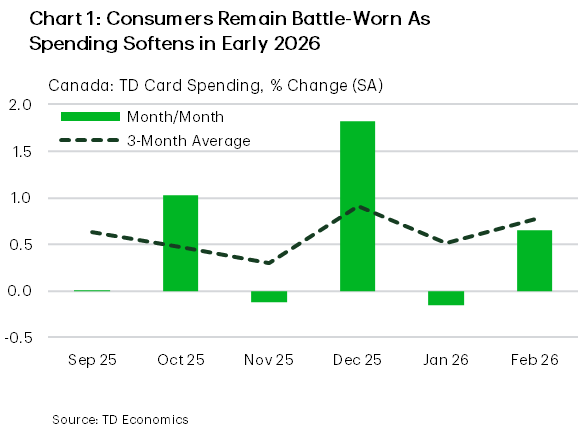
- TD Spend data point to volatile consumer spending in recent months. After finishing 2025 strong, outlays weakened in a storm-affected January and rebounded in February. Real consumer spending is tracking a 1.2% (annualized) pace in the first quarter, down from 1.7% in Q4 2025.
- Goods spending has recently been driven by necessities. Housing-related spending, by contrast, has contracted for two consecutive months.
- Services are reliably carrying the load. Travel and recreation remained the most resilient categories, suggesting that higher-income households appear to be the primary engine keeping spending afloat in early 2026.
- The Middle East conflict has brought higher gas prices and renewed market volatility, throwing yet another wildcard at consumers. Canadian households continue to fight one battle after another, with no intermission in sight.
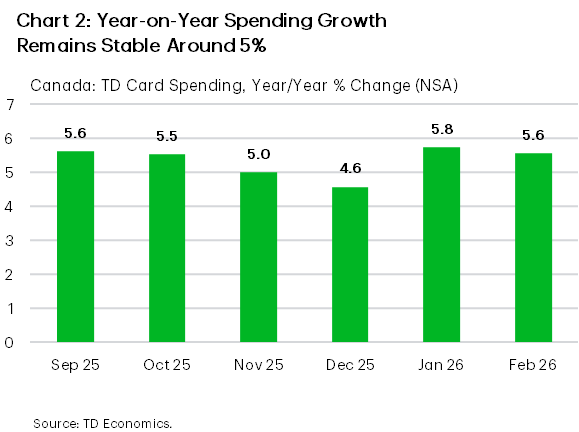
Canadian consumer spending started 2026 on a slightly softer footing. Our internal TD Spend data show that spending softened early in the year before stabilizing somewhat in February, leaving the three-month average growth rate at 0.8%, or roughly 9.5% annualized (Chart 1). This pace is broadly consistent with nominal retail sales, which - while excluding services but including auto sales – are up 6.5% annualized on a three-month trend basis. On a year-on-year basis, TD Spend growth held near 5.0% with base effects from last year’s GST/HST tax break creating some noise across the winter months (Chart 2). Accounting for these signals, real consumer spending (PCE) growth in the first quarter is currently tracking around 1.2 % (annualized).
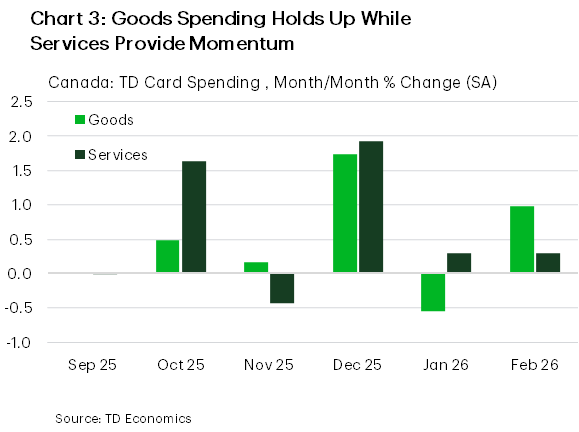
The composition of spending over this period highlights a divergence in consumer preferences. Goods spending has been the main source of volatility. It finished 2025 on a remarkably strong note, before posting a notable pullback in January and partially recovering in February. Meanwhile, services spending has been steady, rising for three consecutive months (Chart 3). Weather likely played a role in these dynamics. The winter storm that swept across much of the country appears to have both frozen consumer activity in some areas and redirected spending in others.
Spending on essential categories has dominated goods outlays. Over the past three months, spending at grocery stores, convenience stores and general merchandise retailers (which include wholesale outlets like Costco) collectively accounted for roughly 70% of goods spending growth, up from 40% a year ago, as spending on clothing, electronics and department stores has effectively fallen away. Food inflation picked up in the second half of 2025 and, at more than double the headline rate, continues to keep nominal grocery spending elevated.
Meanwhile, energy prices – a recent source of disinflation – now present an upside risk. Nominal outlays at gas stations have oscillated through the winter months and are likely to head higher in March. Since the outbreak of the Iran war, average pump prices in Canada have risen by 40 cents per litre (or almost 30%) and if they hold near current levels, drivers will pay roughly $16 more per tank to fill-up in March.
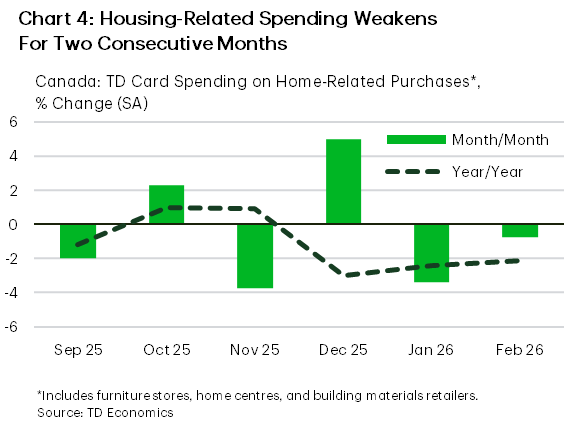
In contrast to resilience in essential goods spending, housing-related consumption has softened noticeably. Outlays at furniture stores, home centres, and building materials retailers have declined for two consecutive months (Chart 4), with spending down 2.1% year-on-year in February. This is consistent with the cooling in Canada’s housing market – national home sales are tracking more than 5% lower relative to a year ago in Q1, suggesting subdued housing activity is likely weighing on related consumer purchases.
While discretionary goods spending has cooled, services spending continues to provide ballast. Travel spending surged in December and January as Canadians escaped winter storms for warmer destinations (Chart 5). Although travel spending dipped in February after several strong months, outlays remained elevated, up almost 10% year-on-year. Recreation spending rebounded in February, following a weather-related dip in January, contributing to steady gains in services spending (Chart 6). Professional services, covering a wide range of activities from legal and accounting to chiropractic and massage therapy, also contributed modestly to growth.
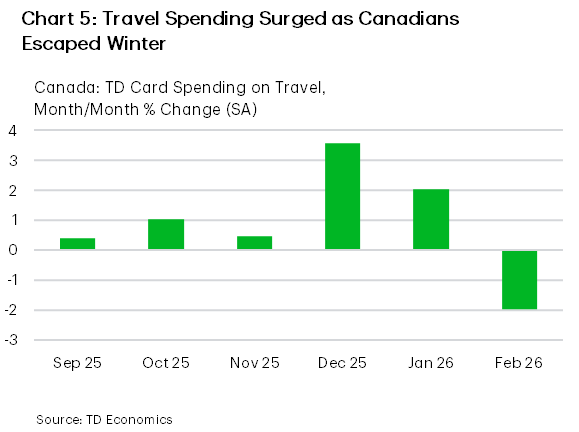
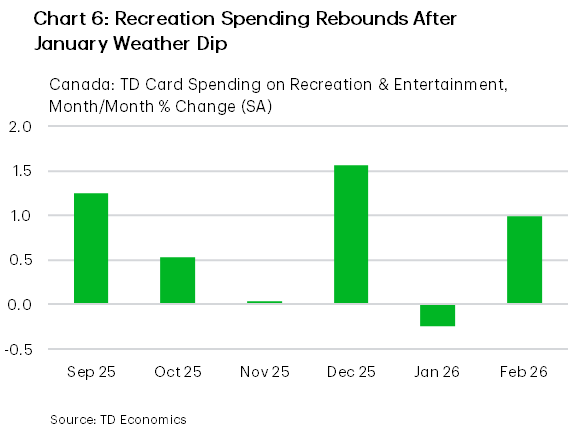
The resilience of these services categories suggests spending may be skewed towards higher-income households. Travel and recreation tend to be disproportionately driven by higher-income consumers – those with the financial cushion to book a flight when a storm hits or a spa day when the mood strikes. For now, that engine is holding. But higher oil prices may change that calculus: as fuel costs feed into airfares, discretionary travel becomes more expensive, and the households that have been keeping consumption afloat may start to pull back. That would remove another leg supporting economic growth. A sustained sell-off in equity markets could also dent the balance sheets of higher-income households, weighing further on confidence in making these discretionary outlays.
Bottom Line
Taken together, the recent spending data point to a consumer sector that remains resilient but increasingly battle-worn. Essential goods categories are holding up, while discretionary goods categories – particularly those tied to housing – are losing momentum. Services spending continues to provide forward momentum, but the support is narrower than the headline suggests. It rests largely on discretionary outlays like travel and recreation, which tend to be concentrated in higher income households.
The Middle East conflict, which brings higher gas prices and renewed market volatility, has thrown yet another wildcard at consumers. Higher energy costs weigh on consumer budgets but given the uncertainty around the duration of the conflict, the impact on Canadians’ spending is speculative. Our recent forecast assumes that WTI oil prices average $85 per barrel in Q2, adding roughly 0.2 percentage points to headline CPI inflation at its peak and modestly trimming real consumption through reduced purchasing power. But if the conflict drags on longer, the consumer would be on increasingly uncertain footing, with the balance of risks tilting to the downside. Canadian households continue to fight one battle after another, with no intermission in sight.
Disclaimer
This report is provided by TD Economics. It is for informational and educational purposes only as of the date of writing, and may not be appropriate for other purposes. The views and opinions expressed may change at any time based on market or other conditions and may not come to pass. This material is not intended to be relied upon as investment advice or recommendations, does not constitute a solicitation to buy or sell securities and should not be considered specific legal, investment or tax advice. The report does not provide material information about the business and affairs of TD Bank Group and the members of TD Economics are not spokespersons for TD Bank Group with respect to its business and affairs. The information contained in this report has been drawn from sources believed to be reliable, but is not guaranteed to be accurate or complete. This report contains economic analysis and views, including about future economic and financial markets performance. These are based on certain assumptions and other factors, and are subject to inherent risks and uncertainties. The actual outcome may be materially different. The Toronto-Dominion Bank and its affiliates and related entities that comprise the TD Bank Group are not liable for any errors or omissions in the information, analysis or views contained in this report, or for any loss or damage suffered.
Download
Share: