Highlights
- Strong demand for American workers has collided with labor supply constraints to propel robust and accelerating nominal wage growth.
- Over time the effects of the pandemic on labor supply will ease, but we expect this to coincide with an unemployment rate that will be back at its pre-recession level by the end of 2022.
- The labor market will remain historically tight, creating a backdrop for workers to command higher wages. This should be especially helpful to workers at the bottom of the wage distribution, contributing to stronger, more inclusive income growth.
- If productivity continues to advance, it will help keep inflationary pressures at bay. Even with this baseline assumption, we anticipate average wages will sustain growth between 4% and 5% over the next several years, one to two percentage points faster than the pre-crisis period.
- However, this threshold can be breached. The longer consumer price inflation remains elevated, the higher the risk that nominal wages must rise to compensate.
- This dynamic would turn transitory inflation into a more permanent variety, requiring stronger mitigating action from the Federal Reserve.

Wage growth is picking up. Relative to its pre-pandemic level, average hourly earnings were up over 5.5% annualized in August, well above the 3% pace observed prior to the pandemic when the unemployment rate hit a 50-year low. Earnings have been impacted by shifts in the composition of the workforce, but other wage metrics are also moving higher. The acceleration in wages is evident across industries and is particularly acute in the leisure and hospitality sector (Chart 1) – one of the hardest hit by the pandemic and still the most depressed in terms of employment relative to its pre-recession level.
On its surface, the rise in wage growth is hard to square with a still-elevated level of unemployment. It becomes less of a mystery considering record-high rates of job openings and quits. The relationship between job openings, hires and unemployment should normalize, but the speed at which this occurs will depend in large part on the pandemic.
Returning to pre-recession levels of unemployment – as anticipated in our economic outlook – would represent the return to the hottest labor market in half a century. In this environment, wages should continue to rise at a healthy pace. However, there will be some counterbalance or ‘governor’ on the speed. Sturdy wages will also incent more people into the labor force – a dynamic that was playing out prior to the pandemic.
The key risk to this outlook is captured by recent outcomes in ‘real’ wages (i.e. net of inflation). High inflation has eroded the purchasing power of workers. Deflated by the consumer price index, real average hourly earnings were negative in August on a year-on-year basis, despite strong nominal growth. Should this persist, it increases the chance that real wages must adjust upward to compensate, thereby imbedding the higher inflation rate within nominal wage contracts. The Federal Reserve will have to bear this risk in mind as it monitors the durability of price pressures.
Demand for workers has never been stronger
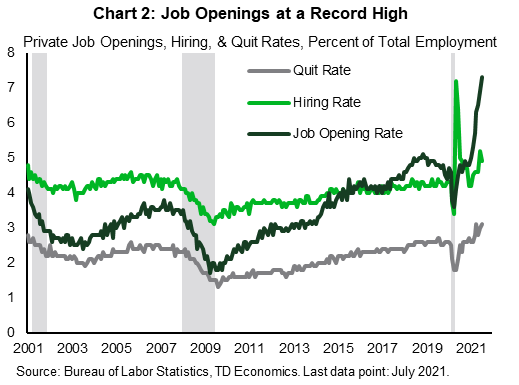
As we all know by now, this has not been a run-of-the-mill business cycle. Government income support measures for both households and businesses raised incomes well above the counterfactual prediction had the pandemic not occurred. At the same time, it kept businesses operating that otherwise would have failed. Businesses that laid off workers or cut their hours during the pandemic are now scrambling to add them back as demand has come roaring back. As a result, job openings have soared over 60% from pre-recession levels (Chart 2).
This is giving workers in existing positions more confidence in their ability to find a new job, evidenced by a level of quits that have also touched historical highs in recent months. In July, the private quit rate retouched the peak hit in April of this year.
At the same time, new positions are taking longer to fill. The hiring rate has also been on an upward trend over the past several months, but it is not rising as swiftly as the opening rate. Usually, the opposite occurs. Hires rise relative to openings in the early stages of the business cycle and only slow below them in its later stages, when a tight labor market makes positions harder to fill. This time, the ratio of hires-to-openings is already at its lowest level on record at just over 60% in July.
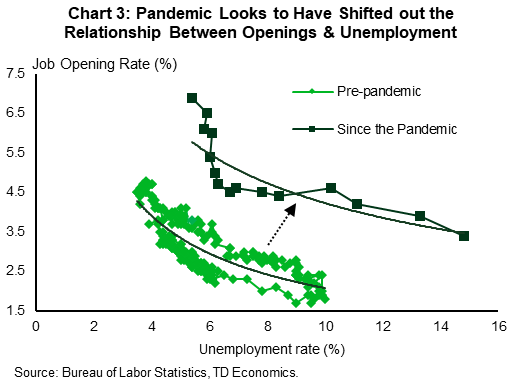
The difficulty in turning openings into hires alongside a rising quit rate is changing the relationship with the unemployment rate. Typically, there is a negative relationship between the two – high openings imply low unemployment. This empirical relationship, known as the “Beveridge curve” is a closely watched signal of the efficiency of the labor market. When labor market frictions increase, the relationship can shift outward to show a higher level of unemployment for a given level of job openings (Chart 3).
Wage growth impacted by shifts in composition
In the current environment, this equates to upward pressure on wage growth despite elevated unemployment. Average hourly earnings were up over 6% annualized from March to August, nearly double the rate in 2019.
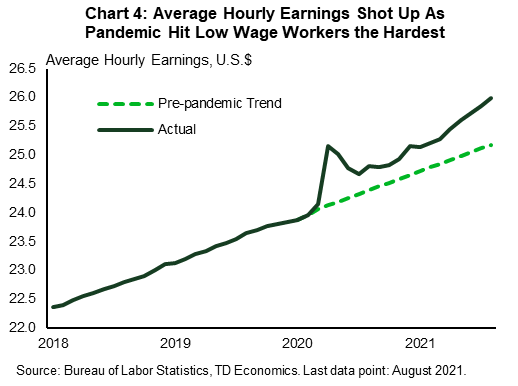
However, even this may be understating the magnitude of current wage pressures. The average hourly earnings measure is susceptible to changes in the composition of the workforce that can cloud its signal. If, for example, the composition of earners tilts towards individuals in higher paid occupations in a given month, average hourly earnings will rise, even without any change to individual workers’ pay. This is exactly what happened at the outset of the pandemic when the plunge in jobs of lower paid workers resulted in a sharp uptick in measured average hourly earnings. As the economy reopened, and a portion of those laid off rejoined the workforce in June and July of last year, wage growth turned temporarily negative (Chart 4), though remained above its pre-pandemic trend.
Given that lower paid occupations and industries are now being added at a higher rate than higher paid workers, this may be having a dampening effect on average hourly earnings growth, suggesting underlying wage pressures that are even stronger than meets the eye.
Fortunately, we can gut check this risk by looking at the Atlanta Fed wage tracker, where economists have constructed a measure that controls for compositional distortions. This measure confirms an acceleration in recent months. While growth was “only” up 4.4% in August, this is faster than at any point just prior to the pandemic and marks the highest reading since 2007.1 Workers with a median income at the lowest quartile, are experiencing the fastest growth since 2002 (see Chart 8).2
Health concerns still a key constraint on labour supply
We anticipate the Atlanta Fed measure will continue to advance, moving toward the 5% mark by the end of this year. Average hourly earnings are harder to predict given changes in composition, but we would not expect to see any meaningful deceleration over the next several months.
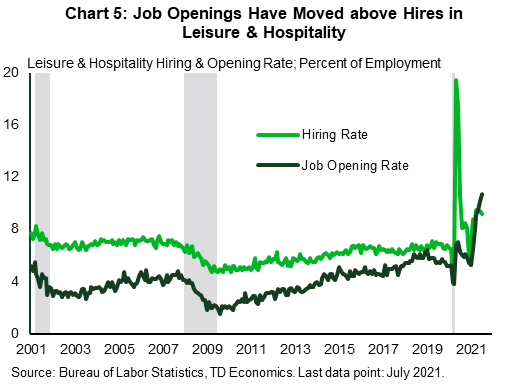
The good news is that the fourth wave of the pandemic now appears to be ebbing. Confirmed new COVID-19 cases have fallen nearly 40% from their most recent peak in mid-September. Still, the impact on the labor market is likely to linger. Vaccine mandates reduce workplace health concerns, but the onus of enforcing the rules falls on employees, increasing the stress of the job. These are the same jobs that tend to pay the lowest average wages. For example, the average hourly wage rate in the leisure and hospitality sector is the lowest among all major sectors. This is important. The leisure and hospitality sector makes up 32% of the 5.3 million jobs still missing due to the pandemic. It is also a sector that has historically had hiring rate that ran above job openings. This has changed during the pandemic, and openings are now well above hires in the industry (Chart 5). Naturally, this is also showing up in the wage data. Average hourly earnings in the leisure and hospitality and retail sectors have seen the strongest growth in recent months and are now the most elevated relative to their pre-pandemic levels (see Chart 1).
At the same time, as we have witnessed recently in New York City, vaccine requirements for staff may result in workers who fail to meet workplace requirements being displaced from jobs. This is worsening labor shortages in sectors like healthcare and education that are already very tight.
And then there’s the friction created by the ongoing uncertainty about whether schools will remain open. This makes it more difficult for parents to return to the workforce across industries. Already thousands of classes have been interrupted due to outbreaks. Students in classes with infections can be quarantined, requiring parents to stay home. This could prolong the reluctance of currently unemployed workers to more urgently search for work or take available positions. The pandemic has already had a disproportionate impact on parents of younger children, especially single mothers who have seen a relatively bigger drop in employment and labor force participation.3 While this does not appear to be the primary driver of labor supply challenges, it’s yet another layer of friction within a labor market that is already struggling to normalize participation.4
As pandemic supply constraints abate, other pressures on wages will remain
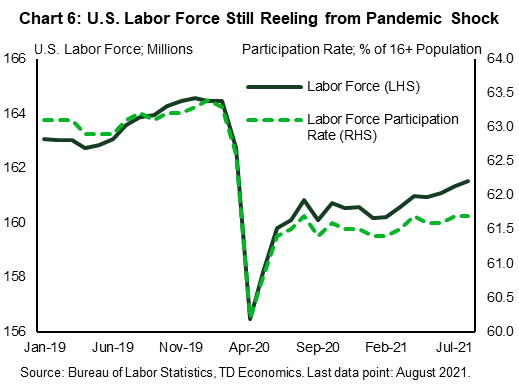
Our baseline expectation is that by the first half of next year, many of the challenges cited above will be alleviated. This should create a stronger labor supply impulse, particularly since there is ample room for the labor force participation rate to rebound. As of August, the overall labor force participation rate was 1.7 percentage points below its pre-pandemic level. As a result, the size of the labor force – those working and actively looking for work – was still over three million smaller than it was prior to the pandemic (Chart 6). In September, the pandemic top-ups to unemployment insurance expired for all of the remaining states. We will be watching the September employment report for signs that this has drawn more people into the labor market as a first step in alleviating supply-side pressures.
Even as this cyclical dynamics unfolds, it won’t be the be-all-and-end-all solution to strong wage growth. The reallocative nature of the COVID-19 shock is one source of friction that is likely to have more staying power. Businesses looking for workers may not necessarily be the same ones that laid workers off and the skill set of the existing workforce may not be what is required to flourish in the new environment. This will take longer to sort out, requiring training that could continue well beyond the end of the pandemic. The good news is that this should help raise productivity and output growth.
Similarly, people who have left professions during the pandemic or after, are likely to continue to seek opportunities elsewhere. Job switching is a key driver of increases in earnings. According to wage data compiled by the Atlanta Fed, median wage growth of job switchers has grown an average of 0.7 percentage points annually faster than job “stayers.”
All told, wage pressures reflect a collision of dynamics, not all of which will dissipate. With the unemployment rate likely to move close to the 50-year low reached prior to the pandemic by the end of 2022, wage growth should remain in the neighborhood of 4% to 5%.
A tight labour market will draw people into the workforce
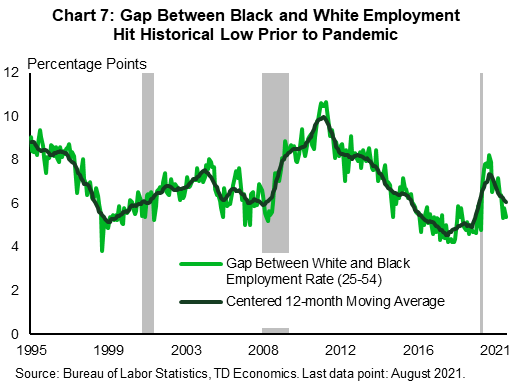
Wage growth in this range will continue to draw people into the labor market, acting as a governor on how high it gets. This is exactly what happened prior to the pandemic. As the unemployment rate approached historically low levels, the participation rate continued to move higher. This was especially noticeable for marginalized groups. By the end of 2019, the gap between the employment rate of white and black Americans in their core working years (25 to 54) fell to its lowest level on record (Chart 7, page 5). While the pandemic reversed this trend, there is good reason to expect it to remerge once it is in the rear view mirror.
According to research presented at the most recent Jackson Hole summit in August, the stability of job growth and high probability of finding and maintaining a job in a hot labor market tends to put upward pressure on participation rates that proves long lasting.5 While it may take time for this to reemerge, the further we move from the pandemic downturn, the more likely we are to see continued improvement in outcomes across sociodemographic groups.
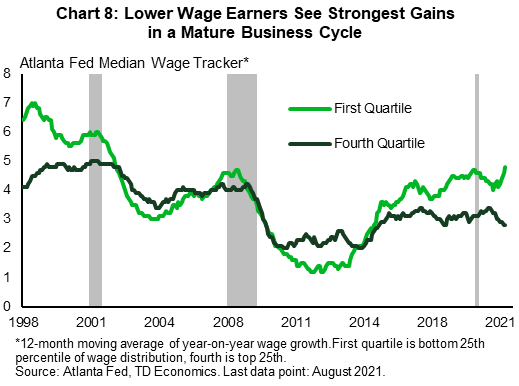
Some other important trends were also evident in the tight pre-pandemic labor market. Lower-skilled occupations finally experienced the greatest acceleration in wage growth.6 A similar pattern is evident looking at wage growth by quintile. After years of relative underperformance, earners at the lower end of the distribution moved ahead of the higher end, implying catch up growth and a more equitable distribution of wage gains (Chart 8). This same phenomenon occurred following the 2001 recession, suggesting that catch-up growth, interrupted by the pandemic, is likely to resurface once it is over.
Elevated inflation cuts into real wages, may require further increases
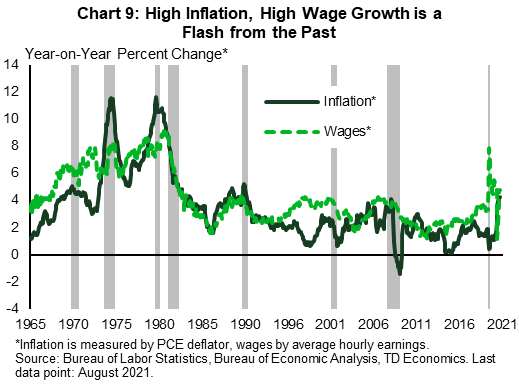
There is one fly in the ointment. High inflation tends to be most detrimental to lower income individuals. Pivotal to our expectation that wage growth doesn’t spiral higher is that inflation pressures ebb. Inflation cuts into the real earnings of employees and therefore reduces the benefits of higher nominal wage growth, requiring even stronger wage growth just to catch up. This dynamic has not been evident in the American economy since the 1970s, but could become another feature of the pandemic economy (Chart 9).
The rise in consumer price inflation to-date reflects the reorientation of consumer demand toward goods (from services) in combination with increased global supply constraints. Our baseline expectation is that as these are alleviated, inflation will slow toward the 2% mark. Stable inflation will mean real wages move with nominal wages and reflect the demand and supply of labor.
The risk in the near-term is that as supply constraints in some areas are alleviated, they increase in others. We have seen evidence of this in the recent challenges to energy supply around the world. One such area of potential prolonged consumer price growth in the United States is rental prices, which have begun to rebound as demand has returned to the housing market. If higher consumer prices have to be built into wage growth, as employers make cost of living adjustments to retain staff or to attract new workers, it threatens to become a vicious cycle of rising prices.
All told, there is good reason to expect inflation to ease, but this is a lingering risk and may provoke greater urgency from the Federal Reserve should it remain elevated, especially if there are signs that it is becoming more firmly imbedded in wages.
Conclusion
This phenomenon of labor shortages amidst high unemployment is a peculiar feature of the pandemic economy. Increased health risks, lack of stable childcare and generous income support programs have kept people from taking available positions. This has contributed to wage growth moving past its pre-pandemic pace.
As the pandemic ebbs, these labor market pressures will diminish. However, the rotation to a broader cyclical recovery will limit the degree to which wage growth eases. With solid underpinnings to labor demand, the pace of job growth is likely to remain healthy, reducing unemployment even while drawing more people into the labor force.
End Notes
- Three-month moving-average of year-on-year growth in Atlanta Fed median measure weighting the sample to be representative of the month population of all wage and salary earners in terms of sex, age, education, industry, and occupation groups.
- Data is only readily-available for twelve-month moving average of year-on-year growth in median wage growth by quartile.
- https://www.atlantafed.org/-/media/documents/research/publications/policy-hub/2021/09/01/10--where-are-they-now--workers-with-young-children-during-covid-19.pdf
- https://www.piie.com/publications/working-papers/role-childcare-challenges-us-jobs-market-recovery-during-covid-19
- https://www.kansascityfed.org/documents/8334/JH_paper_Sahin_3.pdf
- These occupations include food preparation and serving, cleaning, individual care services, protective services.
Disclaimer
This report is provided by TD Economics. It is for informational and educational purposes only as of the date of writing, and may not be appropriate for other purposes. The views and opinions expressed may change at any time based on market or other conditions and may not come to pass. This material is not intended to be relied upon as investment advice or recommendations, does not constitute a solicitation to buy or sell securities and should not be considered specific legal, investment or tax advice. The report does not provide material information about the business and affairs of TD Bank Group and the members of TD Economics are not spokespersons for TD Bank Group with respect to its business and affairs. The information contained in this report has been drawn from sources believed to be reliable, but is not guaranteed to be accurate or complete. This report contains economic analysis and views, including about future economic and financial markets performance. These are based on certain assumptions and other factors, and are subject to inherent risks and uncertainties. The actual outcome may be materially different. The Toronto-Dominion Bank and its affiliates and related entities that comprise the TD Bank Group are not liable for any errors or omissions in the information, analysis or views contained in this report, or for any loss or damage suffered.
Download
Share this: