This Time is Different for the U.S. Yield Curve
Vikram Rai, Senior Economist | (416)-923-1692
Brett Saldarelli, Economist | (416)-542-0072
Date Published: August 17, 2023
- Category:
- US
- Financial Markets
Highlights
- An inverted yield curve, one in which shorter term rates are higher than longer term rates, has historically been viewed as a harbinger of a recession. The U.S. yield curve has been inverted for more than a year.
- The current inversion differs from past inversions – it appears to be largely due to interest rate expectations that signal investors' confidence in the Fed's ability to quell inflation.
- Despite the aggressive actions of the Federal Reserve to-date, the tightening of monetary policy also does not match that seen in previous inversions. The real fed funds rate has just reached positive territory and has not yet fully filtered through to the economy.
- Economic activity is expected to slow markedly in the second half of 2023, but leading indicators do not show the degree of weakness that would suggest a recession is imminent.
In March 2022, the Federal Reserve kicked off an historic rate hiking cycle aimed at quelling the worst bout of inflation in forty years. Since then, it has lifted the federal funds rate from the zero lower bound to a range of 5.25%-5.5%.
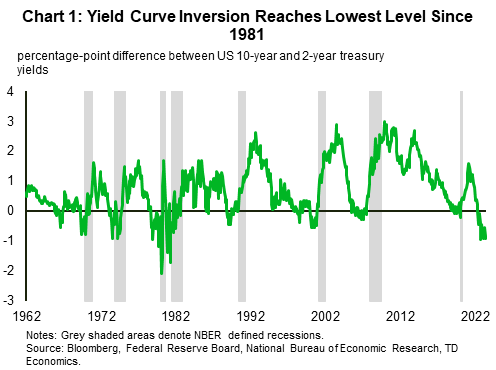
The aggressive actions of the Fed have brought recession fears to the forefront, underscored by the current spread between the U.S. 10-year and 2-year treasury yields (UST 10-2yr). The UST 10-2yr spread became negative in April 2022 and currently stands around -100 basis points (bps), levels not seen since 1981 (Chart 1).
The inversion in the UST 10-2yr spread has historically been viewed as an harbinger of a recession by financial market pundits and it has preceded every recession since 1970. Despite this track record, the spread has also provided false signals on different occasions. The time from the onset of inversion to the onset of recession has also varied across episodes.
While the depth and duration of the inversion are notable, the current spread reflects financial market expectations that the Fed will succeed in curtailing price pressures and, in the not-so-distant future, be able to cut interest rates, rather than signaling an impending recession.
Expectations for Falling Interest Rates Explain Much of the Current Inversion
Despite the conventional wisdom that an inverted yield curve is itself a sign of a recession, the yield curve primarily reflects financial market participants' expectations for future central bank policy. When the Federal Reserve is cutting the federal funds rate, expectations that it will eventually have to raise it again leads long-term yields to push further above short-term rates, a phenomenon known as a steepening yield curve.
By contrast, at some point during a rate hiking cycle, investors begin to expect the central bank will eventually have to cut interest rates. This may reflect the view that the central bank will go too far and push the economy into recession, or it may simply reflect the fact that it has pushed the policy rate above its expected long-run average and its success in bringing down inflation will allow it to later reverse course.
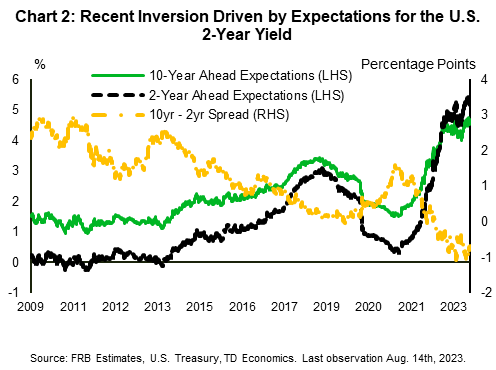
The last several years have seen this play out in dramatic fashion. Following the global pandemic in 2020, the Federal Reserve took the target for the federal funds rate to a range of 0.0% to 0.25%. This ultra-loose monetary policy drove a wedge between expectations for average short-term interest rates over the next two years versus the next ten years. The difference reached a maximum of 119 bps in November 2021. When the Fed began raising interest rates, the opposite occurred – expectations for interest rates over the short-term pushed above the long-term. At present, market expectations for short-term interest rates over the next two years are estimated to be more than 60 bps higher than over the next ten years (Chart 2).
Term Premia are Historically Low
In addition to expectations for future short-term rates, the return to holding a bond should compensate investors for the risk that its price may change dramatically before it matures. In general, the longer the bond's duration, the greater this risk. This "term premium" is why we generally expect longer-term interest rates to be higher than shorter term rates.
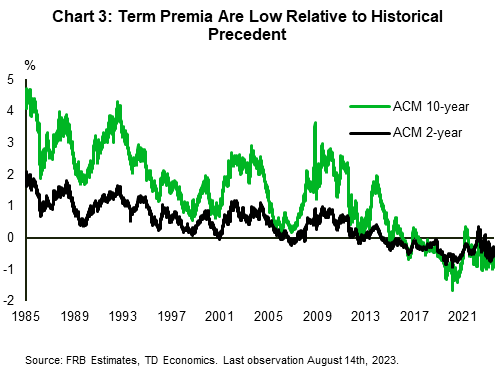
But term premia need not always be very high or even positive. Structural forces (and central bank asset purchases) can push down term premia. Indeed, a growing body of evidence suggests that term premia have been shrinking across the yield curve and currently sit at very low levels.1 This has important implications for the likelihood of the yield curve "inverting." With a lower term premium, relatively more of any yield tenor is explained by interest rate expectations.2 As a result of a low or negative term premium, even a relatively small number of expected rate cuts can push short-term yields above long-term yields.
According to estimates from the Federal Reserve Bank of New York, the 2-year and 10-year term premia are currently sitting at -0.41% and -0.56%, well below their long-run averages of 0.49% and 1.5%, respectively (Chart 3).
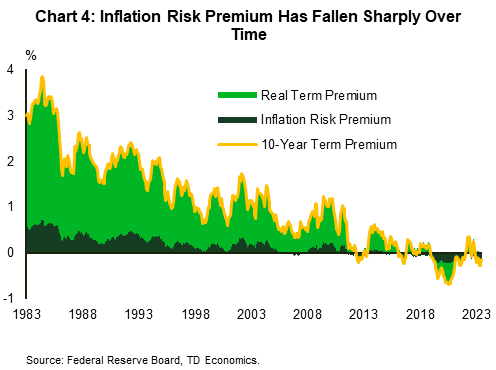
The term premium can be further decomposed into an inflation risk premium – the excess return associated with uncertainty around inflation – and a "real" term premium – the compensation required by investors for taking on interest rate risk. Both components of the term premium look to have declined since their peaks in mid-20223 (Chart 4).
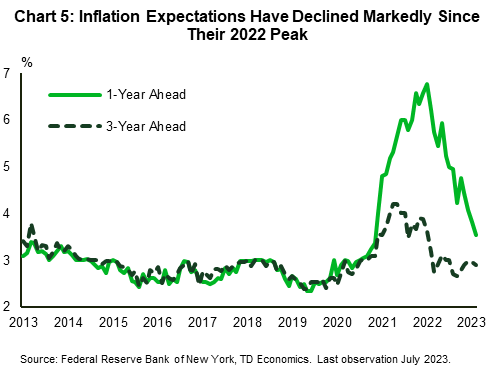
One factor behind the decline in both term premia are relatively well anchored inflation expectations. While expectations for inflation rose alongside actual inflation in 2021 and 2022, they have improved just as quickly since. According to a survey of households taken by the Federal Reserve Bank of New York, one-year ahead inflation expectations currently sit at 3.5% and are approaching their long-run average of 2.8%. Three-year ahead expectations, meanwhile, have already normalized in line with their long-run average (Chart 5).
Real Policy Rates Have Just Moved into "Positive" Territory
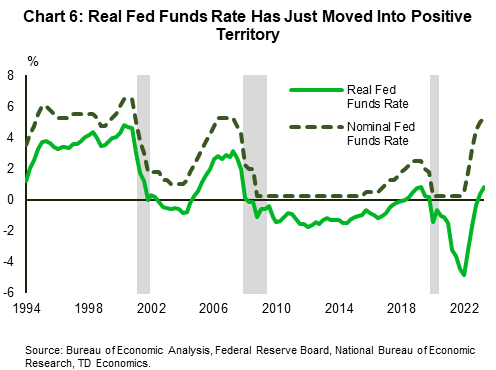
The discussion of interest rates so far has focused on nominal rates but interpreting the stance of monetary policy requires evaluating where these rates sit relative to inflation. Real interest rates – adjusted for inflation – determine the tradeoff between spending now or saving for the future. If interest rates are below the rate of inflation, households and businesses have a greater incentive to borrow and spend today.
This puts the increase in the federal funds rate in important context. Despite its 525 bps rise over the past 17-months, the real federal funds rate only moved into positive territory in the first quarter of 2023 (Chart 6).
In light of this development, it is important to recognize that the federal funds rate is not a rate that most households or businesses face directly, so its recent breach into positive territory would only indirectly be reflected in the costs faced by borrowers. It does, however, pass through to other borrowing costs. To precipitate a slowdown in economic activity, the Federal Reserve's interest rate hikes need to drive a real increase in borrowing costs.
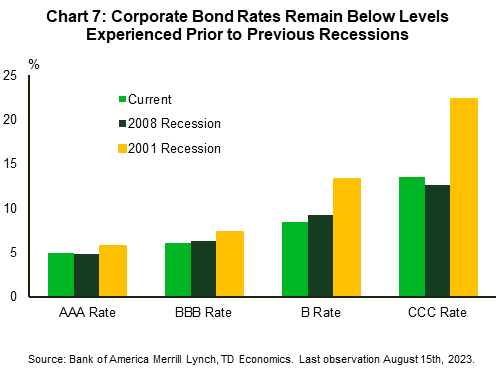
Looking at the situation faced by businesses, the rapid actions of the Fed have raised nominal corporate borrowing costs since the beginning of 2022. The AAA yield has increased by 297 bps, while the BBB yield has risen by more than 300 bps. More notable increases can be found in the non-investment grade space where the single-B rate has increased by 375 bps while the CCC rate has risen by 555 bps. Still, adjusting for inflation, corporate borrowing costs were starting from very low and even negative levels. Moreover, corporate yields remain below their peak in October; investment grade yields are now resting marginally above their long-run average and non-investment grade yields are in line with long-run averages. This translates into real borrowing costs that have increased to around their average levels from 1997 to 2005. Even in nominal terms, most corporate rates remain below the levels experienced at the onset of the 2001 and 2008 recessions (Chart 7).
A similar story emerges with respect to other measures of financial and economic risk. One such summary measure is the excess bond premium, which captures changes in credit spreads unrelated to firm-specific default factors.4 Such increases in credit costs have been shown to have significant adverse effects on economic activity and are therefore a closely watched measure of financial conditions.
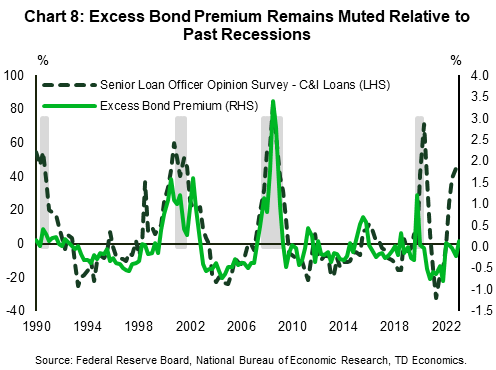
The Fed's tightening campaign and the recent banking tumult have seen credit conditions tighten, however, the excess bond premium has hardly budged. This signals low perceived risk in credit markets and contrasts sharply with the 2001 and 2008 recessions (Chart 8).
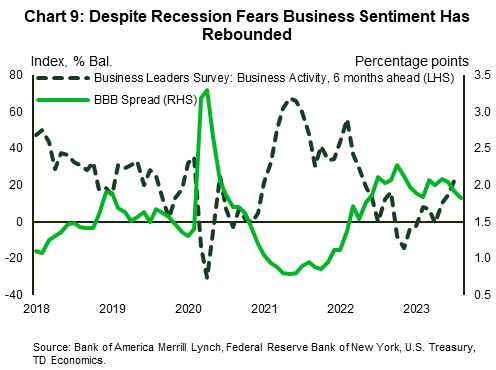
All told, financial conditions are not overly tight and do not point to an imminent recession. Indeed, more direct leading indicators of economic activity, such as the Federal Reserve Bank of New York's Business Activity survey, show a recent uptick (Chart 9) heading into the second half of this year.
Bottom Line
The inversion in the UST 10-2yr spread has put recession fears in the spotlight. However, the negative slope of the UST 10-2yr reflects a structurally low term premium and interest rate expectations that signal financial markets view that the Fed is on track to quell inflation.
Despite continued signs of economic resilience, the journey is still unfinished. Achieving a soft landing may well require the next change in monetary policy to be a cut in the federal funds rate. Should this occur due to meaningful progress in reducing inflation it could well break the yield curve's historical recession-predicting track record.
End Notes
- "Why Are Interest Rates so Low, Part 4: Term Premiums", Ben S. Bernanke, Brookings Commentary, April 13, 2015.
- "Have Yield Curve Inversions Become More Likely?", Renee Haltom, Elaine Wissuchek, Alexander L. Wolman, Federal Reserve Bank of Richmond, Economic Brief, December 2018.
- "Why Does the Yield-Curve Slope Predict Recessions?", Luca Benzoni, Olena Chyruk, David Kelley, Federal Reserve Bank of Chicago, Chicago Fed Letter, No. 404, 2018.
- "Credit Spreads and Business Cycle Fluctuations", Simon Gilchrist, Egon Zakrajsek, National Bureau of Economic Research, Working Paper 17021, May 2011.
Disclaimer
This report is provided by TD Economics. It is for informational and educational purposes only as of the date of writing, and may not be appropriate for other purposes. The views and opinions expressed may change at any time based on market or other conditions and may not come to pass. This material is not intended to be relied upon as investment advice or recommendations, does not constitute a solicitation to buy or sell securities and should not be considered specific legal, investment or tax advice. The report does not provide material information about the business and affairs of TD Bank Group and the members of TD Economics are not spokespersons for TD Bank Group with respect to its business and affairs. The information contained in this report has been drawn from sources believed to be reliable, but is not guaranteed to be accurate or complete. This report contains economic analysis and views, including about future economic and financial markets performance. These are based on certain assumptions and other factors, and are subject to inherent risks and uncertainties. The actual outcome may be materially different. The Toronto-Dominion Bank and its affiliates and related entities that comprise the TD Bank Group are not liable for any errors or omissions in the information, analysis or views contained in this report, or for any loss or damage suffered.
Download
Share: