A Sticky Situation: U.S. Shelter Inflation Easing, But Upside Risks Ahead in 2025
Thomas Feltmate, Director & Senior Economist | 416- 944-5730
Date Published: June 3, 2024
- Category:
- U.S.
- Financial Markets
Highlights
- Elevated shelter inflation remains a key source of inflationary pressure, which is preventing the Fed from returning inflation to its 2% target.
- Fortunately, market-based measures of rents point to a further easing in shelter inflation over the course of this year.
- However, the deterioration in housing affordability alongside tightening supply conditions and strong population growth could styme further progress or even pressure rents higher again. This could slow the adjustment process of inflation in 2025 and ultimately keep interest rates higher for longer.
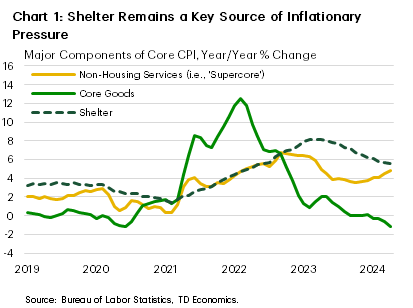
Shelter costs have been a key source of stickiness in U.S. inflation. Because housing represents more than one-third of the overall CPI basket, it remains the single biggest contributor to underlying inflation (Chart 1), and a key force preventing inflation from returning to the Fed’s target. Our baseline forecast assumes shelter inflation continues to ease through 2025, allowing core inflation to return to 2% by the end of next year. However, the potential for a tighter rental market under tightening supply conditions poses a risk to the forecast. It could keep rents growing persistently above their pre-pandemic level, slowing the adjustment process on inflation, and potentially keeping interest rates higher for longer.
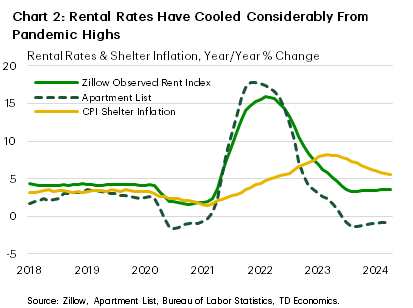
Market-based measures of rents have cooled significantly over the past year, with the twelve-month change on both the Zillow Observed Rent Index and Apartment List data showing rent inflation for new tenants at or below pre-pandemic levels (Chart 2). These measures tend to lead shelter inflation by about twelve-months, suggesting we are likely to see more downward pressure on shelter costs through the remainder of this year. However, ongoing housing affordability challenges alongside any persistence in recent strong population growth could bolster rental demand more than we had previously expected going forward.
Why are Rents so Important for Shelter Inflation?
Trends in the rental market matter for overall shelter inflation because the Bureau of Labor Statistics (BLS) uses rents to measure the cost of shelter for homeowners in addition to renters. The two subcomponents of shelter prices that explain most of the underlying movement are: rent of primary residence (henceforth, ‘rent’) and owners’ equivalent rent (OER). Rent captures the price changes in the stock of outstanding rental leases and accounts for a little less than 8% of overall CPI. Conversely, OER’s weight is more than three-times that of rents and is intended to capture the equivalent cost an owner would have to pay to rent their property, excluding furnishings and utilities1. The BLS estimates the monthly price changes of OER using reported data on rents, then adjusts for quality.2
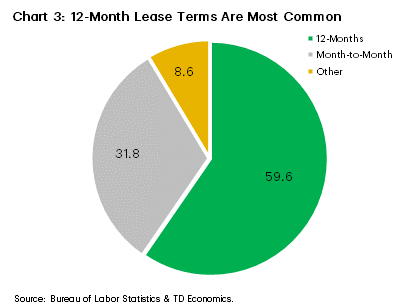
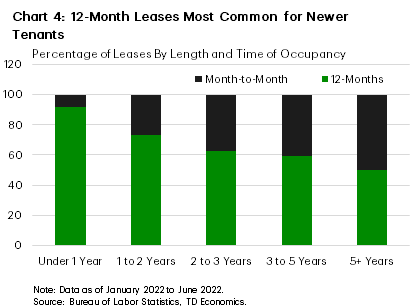
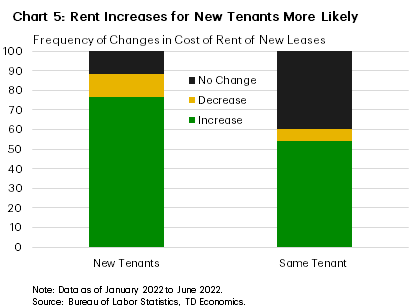
As a result, market-based measures of rent should have a similar impact on both OER and rent, but as shown in Chart 2, the impact is not immediate. This is because current market rent measures only capture price changes for new tenants, whereas the shelter measures captured by inflation are intended to represent the full stock of outstanding leases, most of which do not turn over in a given month. History would show that it takes anywhere from 12-14 months for today’s changes in rent to have a measurable impact on the stock of leases, primarily because the twelve-month lease term is by far the most common in the U.S. (Chart 3). Interestingly, month-to-month is the second most popular, though these leases seem most prominent among tenants who tend to have longer occupancy (Chart 4). Generally speaking, ‘same tenants’ tend to see lower increases in rent compared to new tenants (Chart 5).
Shelter Inflation Progress Could Slow in 2025
To date, the downward pressure from easing shelter costs seems to be progressing on schedule. Shelter inflation peaked in April 2023 at 8.2% – roughly a year after market-based measures had crested. Since then, it has gradually trended lower and today sits at 5.5%. Based on how market rents evolved in 2023, and accounting for the transmission lags on how that passes through to inflation, shelter inflation should trend lower over the near-term. However, there’s a risk that the adjustment process could stall in 2025, as rental demand remains healthy against a backdrop of cooling supply.
Renter Demand to Remain Strong, While Supply Set to Cool
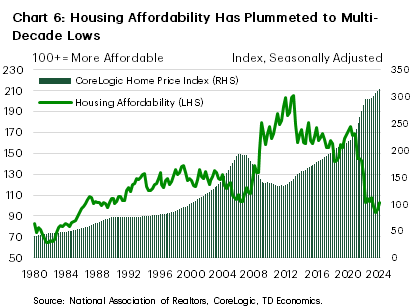
There are a few reasons why rental demand could remain elevated over the coming years. For starters, housing affordability currently sits just off a multidecade low (Chart 6). With interest rates likely to remain structurally higher and home prices showing no signs of giving back any the gains accrued in recent years, affordability is likely to remain comparatively worse than prior to the pandemic, keeping more ‘would-be’ buyers in the rental market.
Outside of affordability constraints, America has also seen a significant influx of new immigrant’s post-pandemic. Analysis done by the Congressional Budget Office suggests immigration inflows are likely to remain elevated over the next two years, with our estimates suggesting the net effect could lift U.S. population by an additional seven million individuals by the end of 2026. This has the potential to further bolster rental demand in key cities, particularly as immigrants tend to have much lower homeownership rates compared to U.S. born citizens, even after living in the country for 5+ years.
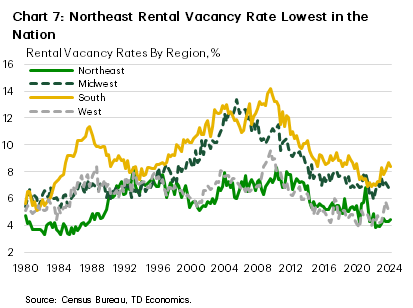
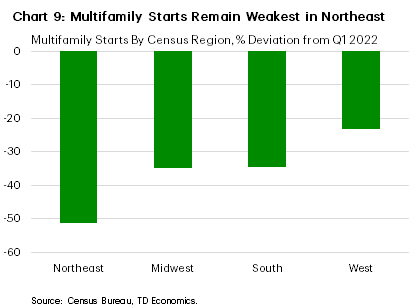
Fortunately, the increased supply in multifamily properties in recent years has been disproportionately concentrated in the South and West, which tend to be more popular landing spots for new immigrants. However, with stronger demand to persist and construction slowing, both markets are likely to tighten up over the next year. In contrast, the Northeast rental market already remains quite tight as it did not see the same boost in supply. As a result, its vacancy rate today is not only the lowest in the U.S., but also (outside of the pandemic) sits at the lowest level since the 1980’s (Chart 7).
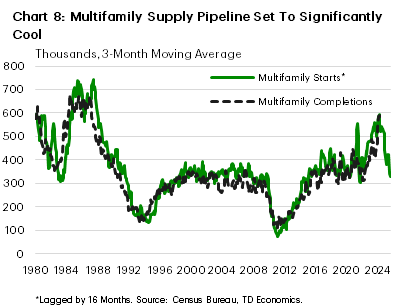
Looking forward, the supply pipeline across all regions looks set to meaningfully slow. We know this because multifamily construction tends to lead completions by about 12-18 months, and given last year’s sharp decline in construction activity, new completions have likely already peaked and will significantly cool through the remainder of this year and into 2025 (Chart 8). The Northeast is likely to come under the most pressure, as its sharp pullback in multifamily construction (Chart 9) is coming atop an already supply constrained market.
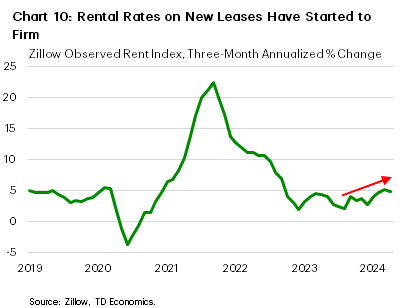
Market Measures of Rent Have Turned Higher
At the aggregate level, near-term trends on rents have already started to firm, with the three-month annualized rate of change on Zillow’s observed rent index rising to 4.8% in April – well above the 3.3% annualized pace of growth averaged through the second half of last year. If growth in rents were to stabilize at today’s pace, the twelve-month change would gradually drift higher over the coming months, reaching 5% by year-end – about a percentage point faster than prior to the pandemic. While this feeds through to shelter inflation with a lag, it would effectively mean less disinflationary pressure from shelter in 2025.
Higher shelter inflation would also mean that policymakers would have less buffer to absorb other unforeseen inflation shocks. For example, our baseline forecast assumes that non-housing services (i.e., ‘supercore’) inflation also continues to cool through 2025 – returning to a pace of growth more akin to its pre-pandemic level by the end of next year. However, if this also proves stickier, the combination of the two forces would have a meaningful impact on the Fed’s reaction function, resulting in rates staying considerably higher for longer.
The Bottom Line
Elevated housing costs have contributed to the stickiness on services prices in recent years. Fortunately, last year’s cooling in market-based measures of rent suggest we are likely to see a further easing in shelter inflation through the remainder of this year. But thereafter the story could shift. A significant erosion in housing affordability combined with tightening supply conditions and increased immigration flows could limit further progress in 2025. To the extent that this slows the adjustment process on shelter inflation and works to keep core inflation measures above the Fed’s 2% target, could ultimately result in a more gradual pace of policy easing in 2025.
End Notes
- The reason the BLS uses OER and not simply the cost of homeownership (i.e., mortgage principal & interest costs, utilities, repairs, etc.) is because it views owned housing units as capital goods, distinct from the shelter service it provides. As a result, spending to purchase and improve houses is treated as an investment and not consumption.
- A similar methodology is used to calculate shelter costs in the PCE measure of inflation, though its relative weight is roughly half that of CPI’s. This is the primary reason why PCE inflation has remained below its respective CPI comparable.
Disclaimer
This report is provided by TD Economics. It is for informational and educational purposes only as of the date of writing, and may not be appropriate for other purposes. The views and opinions expressed may change at any time based on market or other conditions and may not come to pass. This material is not intended to be relied upon as investment advice or recommendations, does not constitute a solicitation to buy or sell securities and should not be considered specific legal, investment or tax advice. The report does not provide material information about the business and affairs of TD Bank Group and the members of TD Economics are not spokespersons for TD Bank Group with respect to its business and affairs. The information contained in this report has been drawn from sources believed to be reliable, but is not guaranteed to be accurate or complete. This report contains economic analysis and views, including about future economic and financial markets performance. These are based on certain assumptions and other factors, and are subject to inherent risks and uncertainties. The actual outcome may be materially different. The Toronto-Dominion Bank and its affiliates and related entities that comprise the TD Bank Group are not liable for any errors or omissions in the information, analysis or views contained in this report, or for any loss or damage suffered.
Download
Share: