Central Banks' Homegrown Dilemma
Beata Caranci, SVP & Chief Economist | 416-982-8067
Rannella Billy-Ochieng’ , Senior Economist
Date Published: October 26, 2022
- Category:
- US
- Consumer
- Financial Markets
Highlights
- The acceleration in U.S. core CPI inflation to 6.6% in September is capturing the fastest rise in shelter costs in 40 years.
- A key influence is rising pressures within shelter inflation. Although prices for new rental leases have been slowing for seven months, this is unlikely to be captured in the CPI measure for another five months and possibly longer.
- This creates an automatic barrier on the degree to which core CPI can ease. The Federal Reserve’s preferred PCE inflation metric won’t mirror the same dynamics, but markets have been consumed with trends in CPI given its more timely release.
- If the central bank cannot credibly pivot the market’s focus to become more forward looking, the interest rate cycle risks pushing the economy into a hard landing.
It’s well known by now that U.S. inflation is stubbornly high. Despite falling energy prices taking pressure off the overall consumer price index, the core measure defiantly accelerated to 6.6% in September (from 6.3% In August).
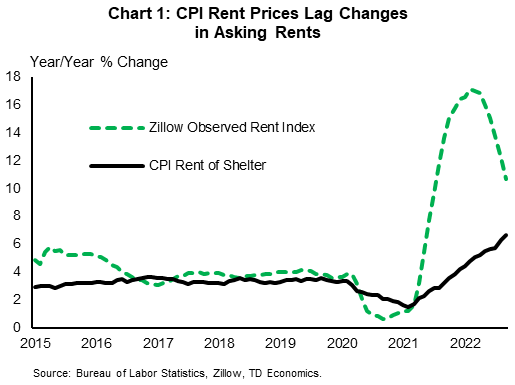
Economists have long emphasized the lagging nature of consumer prices, and the measurement of shelter costs is an apt manifestation of that narrative. Consumer price measures – both CPI and the Federal Reserve’s preferred Personal Consumption Expenditure (PCE) price index – capture the estimated rents of all housing occupants (both owners and renters). Unfortunately, the trend in rent inflation changes at a snail’s pace. Because leases renewed at current market rates are folded in with past leases, it can take up to 12 months for changes in asking rents to show up in CPI (Chart 1).1 This, in itself, is an issue given that the Federal Reserve’s come-from-behind strategy on inflation has caused financial markets to react to every monthly data report. But, the significance of the lag is magnified considering that the shelter component carries, by far, the largest weight within the measurement of inflation.
This is precisely why central banks have traditionally communicated a 12-18 month horizon for the transmission of policy decisions to economic outcomes. Unfortunately, pivoting their message to focus on that horizon may now lack market credibility. This leaves the Federal Reserve susceptible to having little choice but to overshoot on the policy rate and roll over the economy as it chases backward-looking data.
The challenges in Canada are similar on central bank communication, but with the benefit of having a more cooperative CPI measure when it comes to shelter costs. It does not capture housing costs for homeowners (the largest share of households) via rents but includes new housing replacement costs and mortgage interest costs. Mortgage interest costs make up a small weight in the index, helping to mask the circular nature of skyrocketing costs that are a direct result of monetary tightening.
No Shelter from the Storm
To understand where things are heading, it’s important to take a closer look at the forces behind shelter CPI. This component makes up 33% of total CPI, and a hefty 42% of the core index. Some clients have asked if it represents home prices. The direct answer is no. The Bureau of Labor Statistics (BLS) estimates the service provided by shelter, and not the change in the home’s value. For tenants, this is directly observable through rents, but for homeowners the CPI captures “owner’s equivalent rent” (or OER). The survey tracks what it would cost homeowners to pay to rent their home.
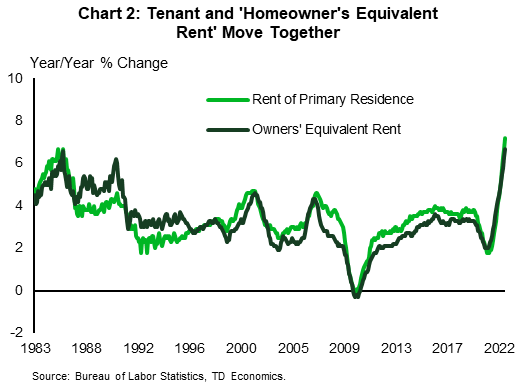
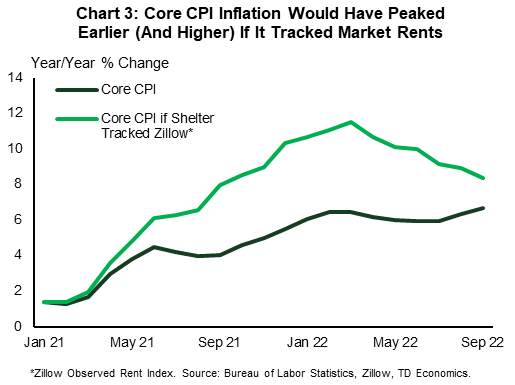
In practice, OER tends to follow the rent of tenants fairly closely (Chart 2). However, in both cases, rent captured in CPI is that of all housing occupants. Since most people do not move regularly, changes in CPI rent will tend to follow changes in the rents of new tenants. Indeed, using the Zillow Observed Rental Price Index, rents of new leases accelerated sharply over the course of 2021 and into early 2022, hitting a peak of 17.1% in February of this year. Rents in the CPI moved up much more slowly. Given the near-50% weighting of shelter in core CPI, if shelter prices were measured by the Zillow measure, core inflation would have accelerated faster through 2021, likely hitting double-digit rates, peaking in March and trending noticeably lower since (Chart 3).
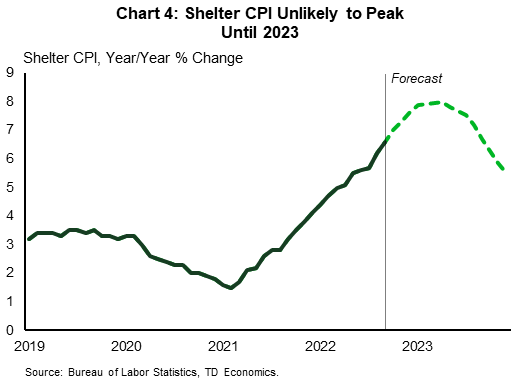
With new lease prices leading shelter CPI by nine to 12 months, rental CPI price growth on a month-on-month basis is likely to remain near its current elevated levels over several more months. Even as it starts to slow – consistent with the slowing evident in new leases – a peak of near 8% year-on-year is not expected to occur until the first quarter of 2023 (Chart 4).
With a hefty component like shelter inflation moving higher, any hope for core inflation to move materially lower will require large offsets in the rest of the consumer basket. As a simple arithmetic example, for core CPI inflation to slow to 6.2% in the fourth quarter of this year (from the 6.3% y/y pace in the third quarter), the pace of monthly price growth in non-shelter components will have to run at one-quarter of the trend from the past three months. This is a tall order.
Inflation is more likely to turn a corner in the spring on 2023, when CPI rental measures capture the turn in new leases being observed today.
PCE Measures Are Less Shelter-Sensitive
There is some good news in store. The stickiness in CPI inflation is less evident in the PCE price measure, where shelter carries about half the weight. Within the core PCE measure, it has a representation of roughly 17%, compared to 42% in its CPI counterpart.
This is still hefty, but its lagging nature will have a materially lower impact on the PCE inflation measure. For example, replicating the above exercise, monthly non-shelter price growth will have to run at roughly half its pace relative to the previous three months for core PCE inflation to slow in the fourth quarter.
Between the two measures, the PCE index is preferred by the Federal Reserve as a truer reflection of household costs. This means that a widening growth wedge will occur between the PCE and CPI measures, due to shelter’s slow nature to turn. However, this can still lead to market volatility and undermine inflation expectations, because CPI data is released ahead of the PCE measure, causing an earlier socialization with markets and central bankers. And, given that the central bank has trained markets to focus on all aspects of the near-term inflation data, the PCE metric may have to work a lot harder or hit lower thresholds to provide the market confidence that a turn in inflation has staying power.
Risky Times for Central Bankers
When the Federal Reserve started to urgently hike in early spring, the message was clear that forecast models and judgement had gravely underpredicted inflation. This was not just in terms of its stickiness, but also in the understanding of the very sources of the pressure. Confidence around model predications had eroded as economic forces moved from an unprecedented pandemic directly into the crosshair of Russia’s invasion of Ukraine.
It made sense for the central bank to focus on the observable inflation data, as they sought to restore market confidence and justify the swift removal of the hyper stimulative monetary settings. Now that policy rates have risen at the fastest pace in four decades, once again we are in unknown territory — this time on the other side of the risk. The central bank should soon return to guiding the markets with a more forward-looking stance. As we’ve said before, using the current inflation data to determine the timing and pace of interest rate hikes at each policy-decision meeting is like driving forward while looking in the rear-view mirror. Eventually an accident will occur.
Disclaimer
This report is provided by TD Economics. It is for informational and educational purposes only as of the date of writing, and may not be appropriate for other purposes. The views and opinions expressed may change at any time based on market or other conditions and may not come to pass. This material is not intended to be relied upon as investment advice or recommendations, does not constitute a solicitation to buy or sell securities and should not be considered specific legal, investment or tax advice. The report does not provide material information about the business and affairs of TD Bank Group and the members of TD Economics are not spokespersons for TD Bank Group with respect to its business and affairs. The information contained in this report has been drawn from sources believed to be reliable, but is not guaranteed to be accurate or complete. This report contains economic analysis and views, including about future economic and financial markets performance. These are based on certain assumptions and other factors, and are subject to inherent risks and uncertainties. The actual outcome may be materially different. The Toronto-Dominion Bank and its affiliates and related entities that comprise the TD Bank Group are not liable for any errors or omissions in the information, analysis or views contained in this report, or for any loss or damage suffered.
Download
Share this: