Highlights
- U.S. electric vehicle sales are expected to cross the 1-million-unit threshold in 2023 for the first time, aided by the introduction of consumer tax credits offered through the Inflation Reduction Act.
- The tax credits include progressively stringent domestic component requirements for battery components and critical minerals, which in addition to production incentives have kicked off a host of recent investments in the U.S.
- Although these investments are expected to equip the U.S. with sufficient production capacity to meet the Biden administration’s 50% target by 2030, upstream supplies of critical minerals are less certain.
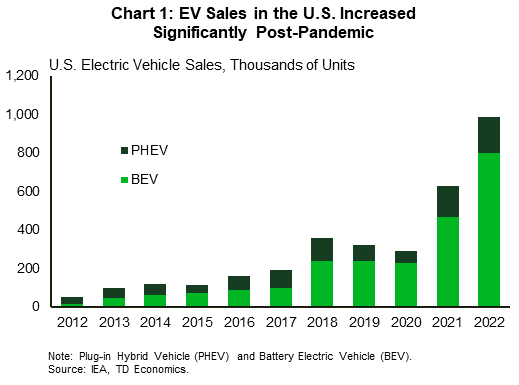
Electric vehicles (EVs) have occupied a small share of the U.S. auto market for most of the past decade, but a combination of changing consumer preferences and ambitious policy goals set forth by the Biden administration has catalyzed recent investment activity in the industry. In 2022, roughly 1 million EVs were sold in the U.S., representing about 7.2% of total light vehicle sales (Chart 1). This means that EV sales would need to grow roughly tenfold by 2030 to hit the administration’s EV sales target of 50%.
Achieving growth of this magnitude will require a large-scale ramp up in the extraction and processing of the critical minerals used to produce EV batteries. Sourcing these minerals may represent a challenge for OEMs, particularly because consumer incentives for EV adoption offered by the administration place restrictions on which countries these minerals can be procured from. Furthermore, to be able to claim the incentives by 2029, the EV’s battery must be fully produced in the U.S. While we anticipate that based on recent company announcements that the U.S. will likely have sufficient domestic battery production capacity to hit the administration’s 2030 sales target, these factories will have to sit idle if OEMs are unable to procure roughly 1 million metric tons of critical mineral inputs annually.
Recent Developments
U.S. EV sales grew by over 50% year-on-year (y/y) in 2022 and were roughly three times higher than in 2019. Most of this strength was found in battery electric vehicles (BEVs), which represent roughly 80% of total EV sales. BEV sales in the U.S. grew by over 70% y/y in 2022. The other EV category, plug-in hybrid electric vehicles (PHEVs), grew by a more modest 19% y/y. This year it is expected that total EV sales will surpass 1 million units and data for the first half appears to show solid progress in that direction, with over 643k EVs sold in the first six months of the year (8.5% of total sales). EV sales are benefitting from the rebound seen in the broader auto industry, brought on by supply improvements, in addition to the tailwinds created by the implementation of the federal tax credits from the 2022 Inflation Reduction Act (IRA).
The IRA includes significant provisions to support consumer purchases of electric vehicles through sales rebates of up to $7,500 per household. However, the purchased EV must meet applicable domestic content requirements (Table 1) that are expected to gradually become binding constraints given the current state of global supply chains.
Table 1: IRA Tax Credit Content Requirements
| Battery Components, % | Critical Minerals, % | |
| 2023 | 50 | 40 |
| 2024 | 60 | 50 |
| 2025 | 60 | 60 |
| 2026 | 70 | 70 |
| 2027 | 80 | 80 |
| 2028 | 90 | 80 |
| 2029 | 100 | 80 |
For 2023, 50% of battery components used in the purchased EV must be sourced from North America and 40% of the critical minerals used must be extracted or processed in the U.S. or a country with which the U.S. has a free trade agreement (FTA). An important caveat here is that because these requirements are value-based, they will be dynamic, meaning they may change as battery component and mineral prices change.
Starting next year, to claim the credit the vehicle’s battery components cannot be sourced from “entity of concern” (EoC) nations, which includes China, Russia, Iran, and North Korea. Critical mineral extraction and processing is similarly restricted starting in 2025. Cumulatively, these requirements in addition to a host of federal incentives and investments outlined in the IRA have catalyzed a spike in private sector investments related to the domestic production of EVs and EV subcomponents.
However, while this represents an undoubtedly positive development for the North American auto and broader manufacturing sectors, scaling up domestic production of EVs and EV subcomponents is expected to present many challenges.
Mineral Extraction & Processing
The battery is the core component of an EV, and its production is heavily reliant on so-called critical minerals. These minerals are also the primary reason why the battery represents roughly a third of the total cost of an EV. While there are many critical minerals – the U.S. Treasury’s full classification list includes 50 minerals – the set that is used the most in EV battery production includes Lithium, Nickel, Manganese, Cobalt, and Graphite. This combination is for a nickel-manganese-cobalt (NMC) battery, currently the most common in EVs. Lithium-iron-phosphate (LFP) batteries are also used to a lesser extent, but they have been gaining popularity in recent years due to lower costs. In addition, although it is not considered a critical mineral, copper is also a key input for battery production.
Now, this is where the FTA aspect of the critical mineral requirements for the IRA tax credits come into effect. This is because the U.S. has very few active mines which extract these minerals (Table 2). There has been some progress in terms of developing new mines in recent years but given it can take up to a decade or longer to go through the full process of exploration, assessment, permitting approval, and construction, this remains a long-term solution. However, considering that the U.S. has minimal reserves of the core critical minerals used in EVs, domestic sourcing is impossible in most cases.
Table 2: Shares of Global Mine Production and Reserves
Table 2: The table shows the 2022 share of global production and global reserves for copper, lithium, nickel, manganese, cobalt, and graphite, sorted by three categories; U.S., countries with which the U.S. has a free trade agreement (FTA), and 'entity of concern' nations (EoC). The U.S. has low global production and reserve shares for all listed critical minerals. FTA nations have outsized production and reserve shares in copper and lithium, and moderate reserve shares in nickel, manganese, and cobalt. EoC nations have moderate shares in copper, lithium, and nickel, and an outsized production share in graphite.
| 2022 Share of Global Production, % | 2022 Share of Global Reserves, % | |||||
| U.S. | FTA | EoC | U.S. | FTA | EoC | |
| Copper | 6 | 22 | 13 | 5 | 48 | 10 |
| Lithium | 0 | 77 | 15 | 4 | 63 | 8 |
| Nickel | 1 | 9 | 10 | 0 | 23 | 10 |
| Manganese | 0 | 18 | 5 | 0 | 16 | 16 |
| Cobalt | 0 | 6 | 0 | 1 | 21 | 0 |
| Graphite | 0 | 3 | 67 | 0 | 1 | 21 |
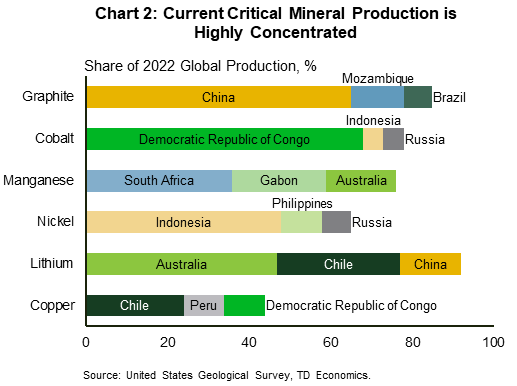
Fortunately for the U.S., its trading partners possess a notable quantity of many of these minerals. In particular, copper and lithium are highly abundant among the U.S.’s trading partners (primarily in Chile and Australia). However, there are meaningful points of concern related to the ability of the U.S. to secure supplies of some minerals. For example, graphite production is highly concentrated in China, with 65% of global graphite produced in China in 2022. In addition, although China has negligible reserves of cobalt, it has substantial ownership stakes in the mines located in the Democratic Republic of Congo, which in 2022 made up almost 70% of global cobalt production. Chinese companies have also invested heavily in nickel mines in Indonesia, which produced just under 50% of the world’s nickel supply in 2022.
It is no coincidence that the U.S. Department of Energy announced two years ago in its National Blueprint for Lithium Batteries that one of its long-term goals is to “eliminate cobalt and nickel in lithium-ion batteries by supporting processing R&D efforts”1. This may require more wide-spread use of alternative battery chemistries, such as lithium-iron-phosphate (LFP) batteries. LFP batteries tends to be cheaper to produce, but their lower energy density (energy per unit of weight) reduces their travel range. Battery chemistries continue to be a focus point for EV innovation due to the necessity to secure critical mineral supplies and reduce EV costs, which are largely dictated by battery costs.
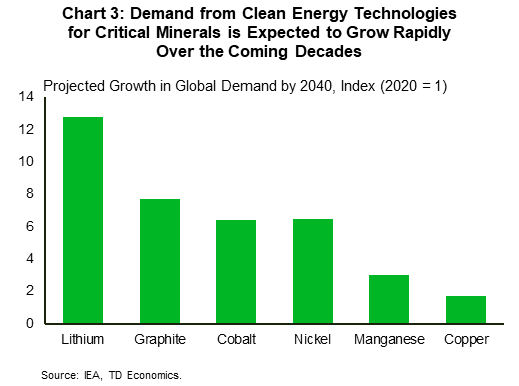
Another challenge related to critical mineral procurement is demand competition from other industries and other nations. While EVs are expected to be the central source of demand for many of these minerals over the next few decades, critical minerals also serve as important inputs to a host of other products, such as wind turbines, electronics, and pretty much anything that uses a battery. Based on current stated policy goals, global demand for these minerals is expected to increase exponentially over the next twenty years, with Manganese seeing the slowest demand growth at 200% and Lithium seeing the strongest demand growth of 1200%2 (Chart 3). All of this demand is expected to create notable competition for these minerals, which may make it difficult for automakers to procure the minerals they need to meet their sales goals.
To illustrate this point, Table 3 shows the share of 2022 global mineral production capacity that would be consumed by North American EVs based on different 2030 sales targets. Currently in 2022, with only about 7% of total auto sales being EVs, demand shares are relatively minor. However, as EV sales are projected to grow over the course of the next decade, demand for critical minerals from automakers may begin to exert notable pressure on global supply. The Biden administration’s target of 50% EV sales by 2030, if fully satisfied by NMC batteries, would be expected to require roughly 1 million metric tons of critical minerals annually. However, this demand could be decreased by alternative battery chemistries. For example, cobalt demand could be offset to a certain extent by LFP battery use but expected future demand for graphite and especially lithium will require serious investments in both mineral production and battery recycling capacity.
Table 3: NA EV Critical Mineral Demand as a Share of 2022 Global Production Capacity
Table 3: The table shows North American EV critical mineral demand as a share of 2022 global production capacity for copper, lithium, nickel, manganese, cobalt, and graphite.
Current EV critical mineral demand as a share of production capacity is highest for lithium at 5%, all other minerals have relatively lower shares of global production capacity.
For the 50% 2030 EV sales target, lithium demand for North American EVs would be equal to almost 70% of 2022 global production.
Demand for cobalt and graphite would be between 40-50% of 2022 global production, while copper, nickel, and manganese would all be less than 10%.
| 2022 | Projected Demand by 2030 Sales Targets | ||||
| ~6% of Sales | 25% | 30% | 40% | 50% | |
| Copper | 0% | 3% | 3% | 4% | 5% |
| Lithium | 5% | 34% | 41% | 55% | 69% |
| Nickel | 1% | 4% | 5% | 7% | 8% |
| Manganese | 0% | 0% | 0% | 1% | 1% |
| Cobalt | 4% | 23% | 28% | 38% | 47% |
| Graphite | 3% | 21% | 26% | 34% | 43% |
The U.S. will also have to compete with the EV production ambitions of other nations, notably in Europe and China, both of which are ahead of the U.S. in terms of EV production and consumer adoption. In particular, China has spent the past twenty years building up its EV industry and now maintains a dominant position in the global market for virtually every aspect of the EV supply chain3. This is perhaps most notable when it comes to critical mineral processing.
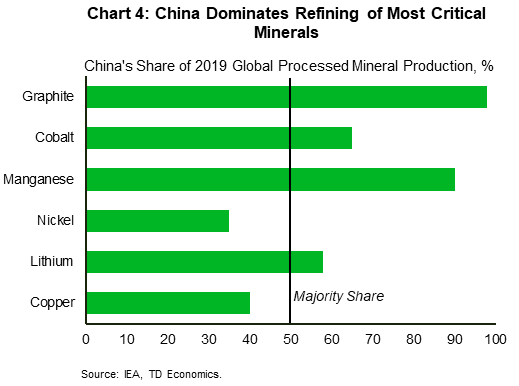
In terms of refining capacity, China has over 40% of global copper capacity, 58% of global lithium capacity, 65% of global cobalt capacity, roughly 90% of manganese capacity, and almost all global graphite capacity (Chart 4). Processing minerals is capital and carbon intensive, which in addition to the lower cost of labor in China, motivated many advanced economies to let China acquire the dominant position that it now holds. However, with EV adoption gradually rising in the U.S., automakers looking to take advantage of the IRA subsidies will need to find ways to work around China – a tall order to be sure.
In many instances, this appears to be taking the form of vertical integration, whereby automakers absorb aspects of their upstream supply chains. Tesla has perhaps taken the most forward step in this regard by building its own lithium refining facility in Texas, which broke ground in May4. Other automakers have preferred to partner with established lithium refining companies, such as General Motors’ partnership with Livent and Stellantis’ partnership with Controlled Thermal Resources Ltd. Similar arrangements have been organized for other critical minerals such as Ford’s tri-party agreement with PT Vale and Huayou Cobalt Co. to fund the construction of a nickel refinery in Indonesia.
While procuring sources for all raw and processed critical minerals outside of EoC countries will be one challenge, it is also important to note that the critical mineral requirements of the IRA subsidies start at 40% this year and max out at 80% by 2027. Based on current mineral prices and the average NMC EV battery mineral composition, nickel has the highest value share of the total battery, to the extent that it likely cannot be fully sourced from a non-FTA country and still qualify for the IRA tax credits by 2025/2026 (at least in current NMC battery chemistries). Lithium will also likely need to be sourced from an FTA country, whereas it is possible that either cobalt individually or graphite and manganese collectively could potentially be sourced from non-FTA countries and still qualify for the IRA tax credits. LFP batteries, in their disuse of nickel, manganese, and cobalt, will have most of their critical mineral quota met by lithium. However, as previously mentioned, prices will be dynamic, and it is likely that lithium and graphite will be subject to disproportionate upward price pressure over the next decade based on projected global demand and their unavoidable use in most battery chemistries.
With the critical mineral requirements on IRA tax credits coming into effect this year and ‘entity of concern’ restrictions starting in 2025, the clock is ticking for automakers to establish the supply chains they will need to meet their EV goals and capitalize on the IRA subsidies.
Battery Components & Production
One step further down the supply chain, the processed critical minerals are utilized to assemble EV battery components and eventually the battery unit itself. The central component of the battery is its collection of battery cells, with each cell made up of a cathode, an anode, a separator dividing the two, and an electrolyte used as the medium. There are many intermediate manufacturers which solely produce these individual components, however most major battery producers have this step integrated into their assembly process. Once the battery cells are fully assembled, they are then packed together, numbering in the hundreds for some EV models and thousands for others, and placed into the battery pack with additional support systems. The production of the final battery pack is typically completed by the automaker to ensure compatibility with the EV model design.
Automakers in the U.S. have traditionally outsourced battery cell production to external companies that would typically produce battery cells abroad, with South Korea and Japan representing the largest production markets. However, the combination of a growing EV market in the U.S. and the IRA tax credit domestic battery component requirements has motivated many battery manufacturers to increase their U.S. production. Table 4 outlines a list of operational and announced battery manufacturing facilities in North America.
Table 4: North American EV Battery Manufacturing Facilities as of July 2023
Table 4: The table shows a list of 11 current and 25 planned North American EV battery manufacturing facilities. Most of the new planned facilities are located in the north-south stretch between Michigan and Georgia, with production start dates expected between 2023 – 2027.
| Battery Company | Location | Automaker customer | Production Start Year | GWh |
| BMW | San Luis Potosí, Mexico | BMW | 2027 | N/A |
| CATL | Ciudad Juárez, Chihuahua, Mexico | Ford, Tesla | TBD | 80 |
| Envision AESC | Bowling Green, Kentucky | Mercedes | 2025 | 30 |
| Envision AESC | Smyrna, Tennessee | Nissan | 2012 | N/A |
| Envision AESC | Woodruff, South Carolina | BMW | 2026 | 30 |
| Ford | Marshall, Michigan | Ford | 2026 | 35 |
| Freyr | Newnan, Georgia | TBD | 2026 | 34 |
| iM3NY | Endicott, New York | TBD | 2022 | 1 |
| LG Chem | Queen Creek, Arizona | TBD | 2025 | 27 |
| LG Chem | Lansing, Michigan | GM | 2024 | 50 |
| LG Chem | Holland, Michigan | GM | 2011 | 4-20* |
| LG Chem | Lordstown, Ohio | GM | 2022 | 7-40* |
| LG Chem | Jeffersonville, Ohio | Honda | 2025 | 40 |
| LG Chem | Windsor, Ontario, Canada | Stellantis | 2024 | 45 |
| LG Chem | Spring Hill, Tennessee | GM | 2023 | 45 |
| LG Chem | Pembroke, Georgia | Hyundai | 2025 | 30 |
| Mercedes | Woodstock, Alabama | Mercedes | 2022 | N/A |
| Microvast | Clarksville, Tennessee | TBD | 2022 | 2 |
| ONE | Van Buren Township, Michigan | TBD | 2024 | 20 |
| Panasonic | De Soto, Kansas | Tesla | 2025 | 30 |
| Panasonic | Sparks, Nevada | Tesla, others | 2016 | 40-100* |
| Panasonic | TBD, Oklahoma | Tesla | TBD | N/A |
| Samsung | New Carlisle, Indiana | GM | 2026 | 30 |
| Samsung | Kokomo, Indiana | Stellantis | 2025 | 23-33* |
| SKI | Cartersville, Georgia | Hyundai, Kia | 2025 | 35 |
| SKI | Commerce, Georgia | Ford, VW | 2023 | 9.8 |
| SKI | Commerce, Georgia | Ford, VW | 2022 | 11.7 |
| SKI | Glendale, Kentucky | Ford | 2025 | 43 |
| SKI | Glendale, Kentucky | Ford | 2026 | 43 |
| SKI | Stanton, Tennessee | Ford | 2025 | 43 |
| Tesla | Fremont, California | Tesla | 2022 | 10 |
| Tesla | Austin, Texas | Tesla | 2022 | N/A |
| Toyota | Liberty, North Carolina | Toyota | 2025 | N/A |
| VinFast | Sanford, North Carolina | VinFast | 2025 | N/A |
| VW | Chattanooga, Tennessee | VW | 2022 | N/A |
| VW | St.Thomas, Ontario, Canada | VW | 2027 | 90 |
Panasonic has the largest footprint as the primary supplier to Tesla and opened their Gigafactory in Nevada in 2016. More recently, the Japanese company broke ground on a new $4 billion production facility in Kansas last November and is exploring plans to build a third U.S. facility.
SK Innovation is another battery company that has made notable investments recently. The company’s two plants in Georgia, which currently produce batteries for Ford and Volkswagen, will soon be joined by a new $4-5 billion plant in Savannah through a joint venture with Hyundai. In addition, the company has partnered with Ford on its planned $5.8 billion twin battery plants in Kentucky and its $5.6 billion battery/EV plant in Tennessee.
LG Energy has perhaps the most ambitious plans to ramp-up battery production in North America. This is mostly in the form of its joint venture with GM (named Ultium Cells LLC) which includes 3 new U.S. production facilities in Ohio ($2.3 billion, operational), Michigan ($2.6 billion, under construction), and Tennessee ($2.3 billion, under construction). LG Energy also intends to build 3 additional plants, including an Ohio plant joint with Honda ($3.5 billion), an Ontario, Canada plant joint with Stellantis ($4.1 billion), and a solo Arizona plant ($5.5 billion).
In total, there are 25 new North American battery manufacturing facilities which have either been announced or are actively under construction as of July 2023. If all projects are completed as planned, this would increase the total number of facilities to 36 by the year 2027. Based on estimates of future capacity, the U.S. is expected to have 1 terawatt hours’ worth of annual EV battery production by 2030, enough to produce over 10 million EVs. Ignoring the countless other variables that need to be considered for the moment, this would likely be enough capacity to achieve the administration’s target of 50% light vehicle EV sales by 2030. However, there are many other aspects of the EV supply chain that will need to be accounted for, not least of which is the ability of manufacturers to source the critical minerals they require in a global market with no shortage of demand. In addition, companies will need to ensure that they have the necessary workers to produce the batteries at these facilitates. The Department of Energy exercised some foresight in this regard, launching the Lithium-Battery Workforce Initiative last year and allocating $5 million for up to five pilot training programs. However, these facilities are expected to create thousands of new jobs in the coming years, and manufacturers as well as policymakers will need to ensure that they have the requisite human capital to match their physical capital allocations.
Electric Vehicle Production
The final stage of the EV supply chain, vehicle assembly, is fairly similar to that of internal combustion engine (ICE) models, although some differences require new or altered assembly processes. To implement the necessary assembly process changes and produce EVs, many traditional automakers have announced (and in some cases already implemented) measures to convert ICE production facilities into EV production facilities. An example of this can be found at GM’s Detroit-Hamtramck facility, which underwent a $2.2 billion retooling process in 2020-2021 and has since been rebranded as ‘Factory Zero’ in reference to the facility’s all electric production. Other examples include GM’s plan to invest roughly $4 billion to retool its Orion Township, Michigan plant, with the facility expected to begin operations next year, and Stellantis’ plan to invest $2.8 billion to retool its two facilities in Ontario, Canada. Both soon-to-be refurbished facilities are geographically close to EV battery plants belonging to each company, with GM’s close to its Lansing, Michigan plant and Stellantis’ close to its new Windsor, Ontario plant, with each expected to begin operations in 2024.
Coordinating battery and EV production is a common theme for automakers as they strategize over the geographic layout of their EV supply chains in North America. This is why new EV battery plants are concentrated in the section of North America known as ‘auto alley’ – a north-south stretch from the Detroit-Windsor border down to Georgia and Alabama. This section of the country was originally targeted by automakers for its proximity to the vast majority of the U.S. population, and while this still holds true today, the distribution of production facilities has partially followed the population shift southward.
The poster child for this trend is Ford’s $11.4 billion investment to build two battery production plants in Kentucky and a ‘mega-campus’ in Tennessee that will host a third battery production facility and produce electric F-series pickups. In addition, Asian and European automakers with footprints in the South have indicated their intention to increase EV production, such as Hyundai in Georgia, Volkswagen in Tennessee, and BMW in South Carolina. Tesla also relocated its headquarters to Austin, Texas at the end of 2021, shortly before Giga Texas began operating.
However, this trend is not all-encompassing, as the traditional concentration of auto production in the Midwest will see many ICE production facilities converted into EV production facilities in the region. This will likely occur gradually as automakers increase their EV model offerings. In particular, as automakers continue to ramp up their production of light truck EVs to better align with consumer preferences – roughly 80% of all new vehicle sales are light trucks – it is expected that more ICE facilities will be converted into EV facilities.
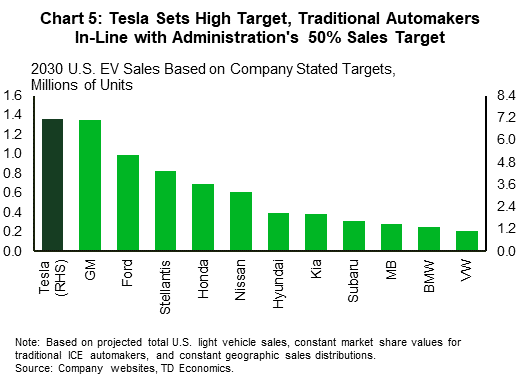
In terms of company-level targets, many automakers are setting ambitious goals for themselves (Chart 5). Two years ago, the three largest North American automakers (GM, Ford, and Stellantis) released a joint statement outlining their intention to each target EV sales of 40-50% of U.S. annual volumes by 2030. Assuming constant market shares, this would collectively equate to roughly 3-4 million annual EV sales by 2030 for these three companies alone. Current market leader Tesla has an ambitious target of 20 million global annual sales by 2030 which, given its current geographic distribution of sales, would equate to about 7.2 million annual EV sales in the U.S. For reference, Toyota is the current largest global producer of automobiles, selling 10.5 million units worldwide in 2022. In contrast, Tesla sold 1.3 million units worldwide in 2022, thus increasing global sales by a factor of 15 in 7 years amid a background of increasing domestic and international competition would likely be a challenge.
International automakers are similarly setting high targets for 2030 U.S. EV sales, with Nissan and Honda seeking to hit 40% of total sales, while Volkswagen targets 55% and Mercedes-Benz targets 70%. Hyundai and Kia have each set global volume targets of 2 and 1.6 million units respectively, while Subaru and BMW have set global sales percentage targets of 40% and 50% respectively. Collectively these eight automakers make up a little under 40% of the U.S. market and based on their targets would contribute roughly 3 million EVs by 2030.
Bottom Line
Taken altogether, the transition to electric vehicles in the United States has seen notable progress in recent years as EV sales reached new heights and automakers ramped up investments in production capacity. Based on announced investments to date, battery production capacity in North America will likely be sufficient to meet the administration’s 2030 EV sales target of 50%. However, this is entirely dependent on the ability of global critical mineral extraction and processing to increase monumentally over the next decade. Advancements in battery chemistries may be able to lessen the demand for critical minerals and thus improve the feasibility and cost of EV production, but it will take time for these innovations to be integrated into supply chains. With shovels in the ground on multiple EV production projects across the nation, automakers are intent on ramping up EV production to meet their sales targets and while this will present many opportunities, there will be no shortage of challenges ahead either.
Disclaimer
This report is provided by TD Economics. It is for informational and educational purposes only as of the date of writing, and may not be appropriate for other purposes. The views and opinions expressed may change at any time based on market or other conditions and may not come to pass. This material is not intended to be relied upon as investment advice or recommendations, does not constitute a solicitation to buy or sell securities and should not be considered specific legal, investment or tax advice. The report does not provide material information about the business and affairs of TD Bank Group and the members of TD Economics are not spokespersons for TD Bank Group with respect to its business and affairs. The information contained in this report has been drawn from sources believed to be reliable, but is not guaranteed to be accurate or complete. This report contains economic analysis and views, including about future economic and financial markets performance. These are based on certain assumptions and other factors, and are subject to inherent risks and uncertainties. The actual outcome may be materially different. The Toronto-Dominion Bank and its affiliates and related entities that comprise the TD Bank Group are not liable for any errors or omissions in the information, analysis or views contained in this report, or for any loss or damage suffered.
Download
Share: