U.S. Retail CRE: Limited New Supply Keeps Fundamentals on Solid Footing
Admir Kolaj, Economist | 416-944-6318
Date Published: October 22, 2026
- Category:
- U.S.
- Real Estate
Highlights
- U.S. retail CRE has arguably the strongest fundamentals among the four major property segments, with its 4.3% vacancy rate the lowest of the group and below its historical average.
- A construction pipeline that has remained restrained since the Global Financial Crisis is the sector’s main underlying source of strength. Of the limited development taking place, most is concentrated in a relatively small group of markets, primarily in the Sun Belt, while much of the space under construction is committed to tenants before completion.
- Higher borrowing costs and signs of stress in some corners of retail CRE debt present risks. At the same time, elevated rates should further restrain an already-lean construction pipeline, helping to keep vacancy low and rent growth positive.
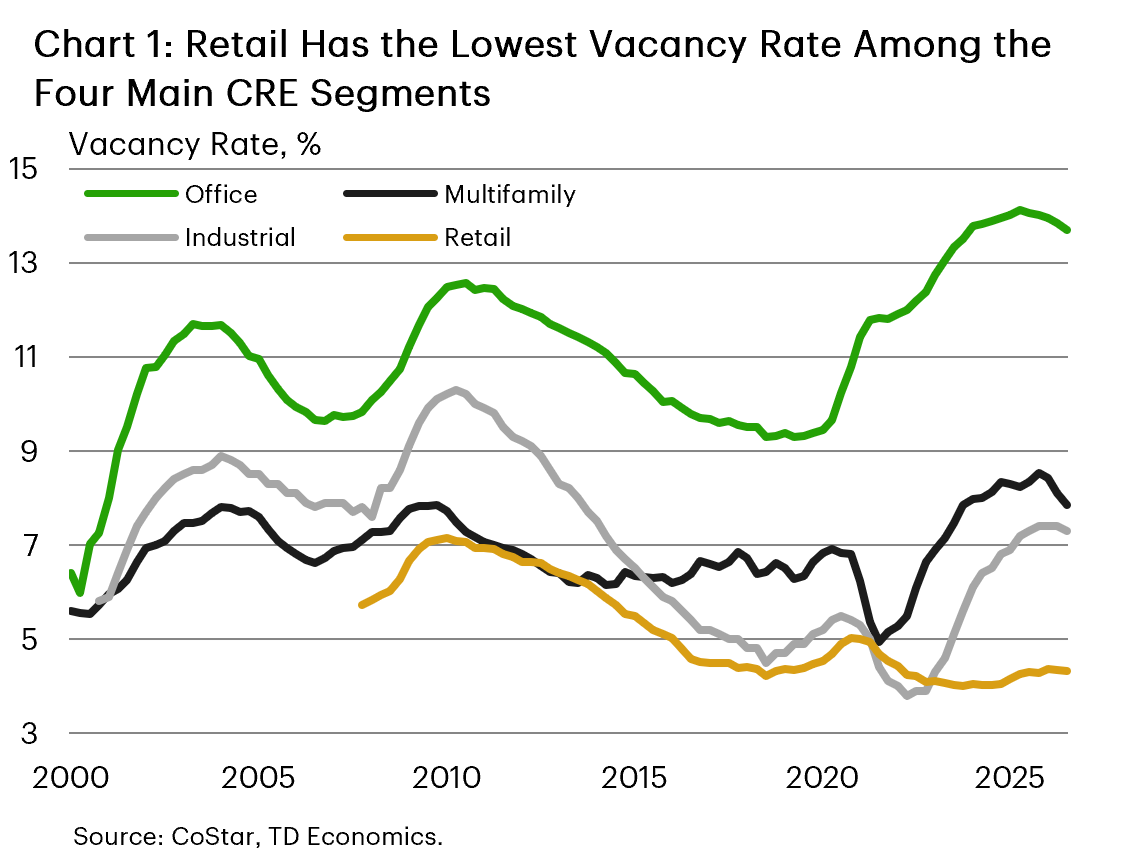
The retail sector currently has arguably the strongest fundamentals among the four major U.S. commercial real estate (CRE) segments. Its 4.3% vacancy rate is the lowest of the four and, unlike office, industrial and multifamily, it remains below its historical average. Office vacancy remains the highest at 13.7%, while industrial and multifamily vacancy rates stand at 7.4% and 7.9%, respectively, after large construction waves loosened both markets (Chart 1). Retail avoided a similar buildup because developers have added relatively little space for more than a decade.
The restrained pipeline has roots in the aftermath of the Global Financial Crisis. Retail development fell sharply following the overbuilding and weak performance of the late 2000s, while the subsequent growth of e-commerce made developers even more cautious. That caution was reinforced when the pandemic accelerated consumers’ shift toward online shopping. What was once a reflection of the sector’s challenges has since become a source of strength, keeping available space scarce and reducing retail’s exposure to swings in tenant demand.
Demand Improves Against a Tight Supply Backdrop
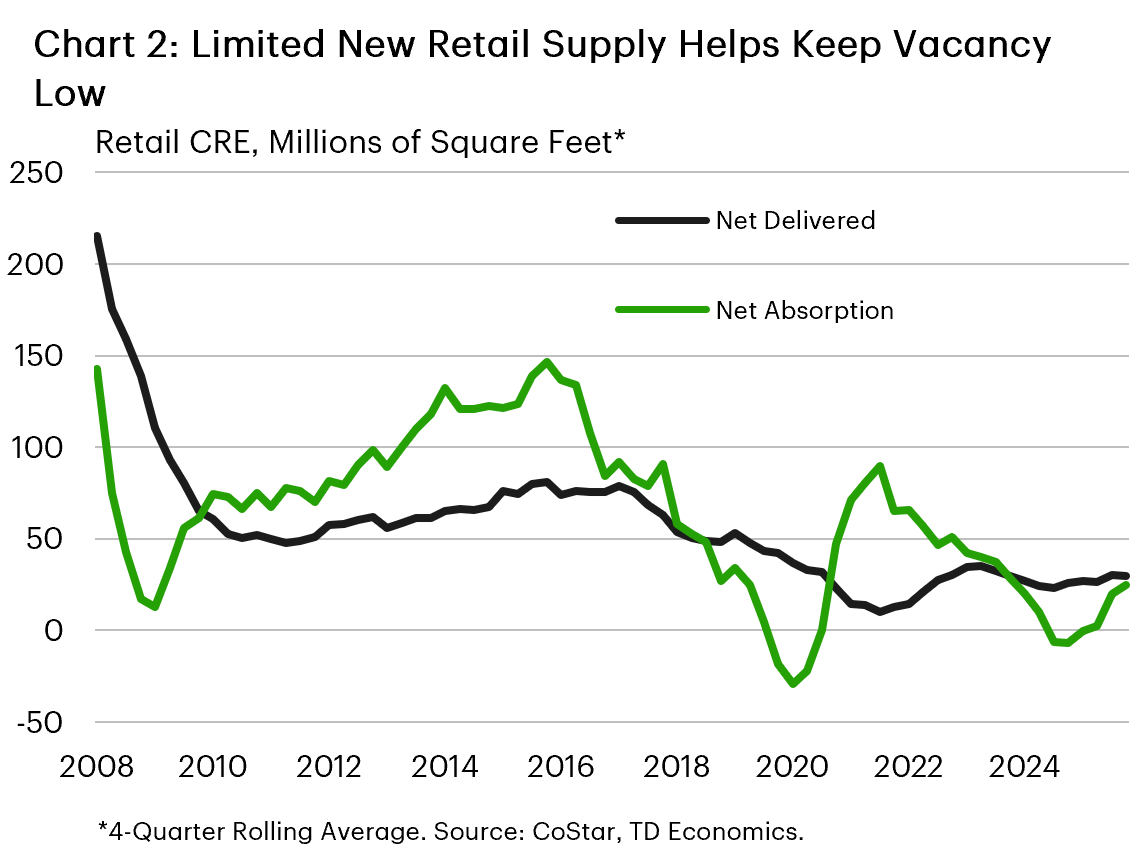
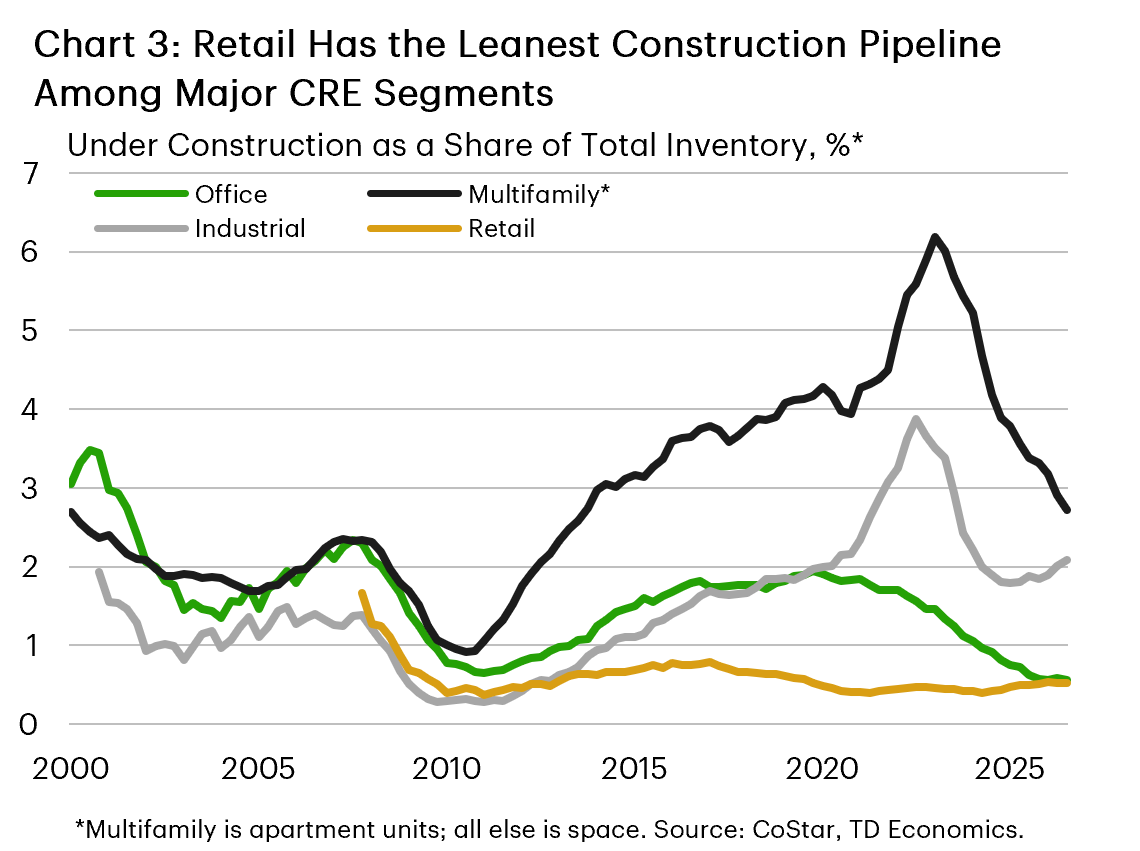
Looking past the latest pickup in demand, low supply remains the sector’s more durable source of support. Retail development has continued to trend lower despite low vacancy, leaving the sector with the leanest construction pipeline among the four major CRE segments (Chart 3). This partly reflects the fact that prevailing rents, despite holding up well, remain below the levels needed to make new projects financially viable given elevated building and financing costs. In this vein, retail construction starts fell to the lowest level on record in the third quarter, with CoStar’s data series extending back to 2007. The development that is taking place remains concentrated in a relatively small group of markets, most of which are in the Sun Belt. The Texas metros of Dallas-Fort Worth, Houston and Austin lead the national pipeline, while other notable markets include Phoenix, Las Vegas, Charlotte, Miami and Atlanta. Outside the Sun Belt, Chicago and Denver also have meaningful construction pipelines. Altogether, the 12 largest markets account for more than half of all retail space under construction, highlighting how limited development remains across much of the rest of the country.
At the same time, development has shifted toward lower-risk formats, including grocery-anchored centers and single-tenant build-to-suits, while much of the space entering the pipeline is already committed to tenants. With relatively little broad-based speculative development, new supply has had a limited effect on vacancy. The demolition or redevelopment of some older properties for alternative uses has also played a role in restraining net inventory growth.
Tight Conditions, but Not Everywhere
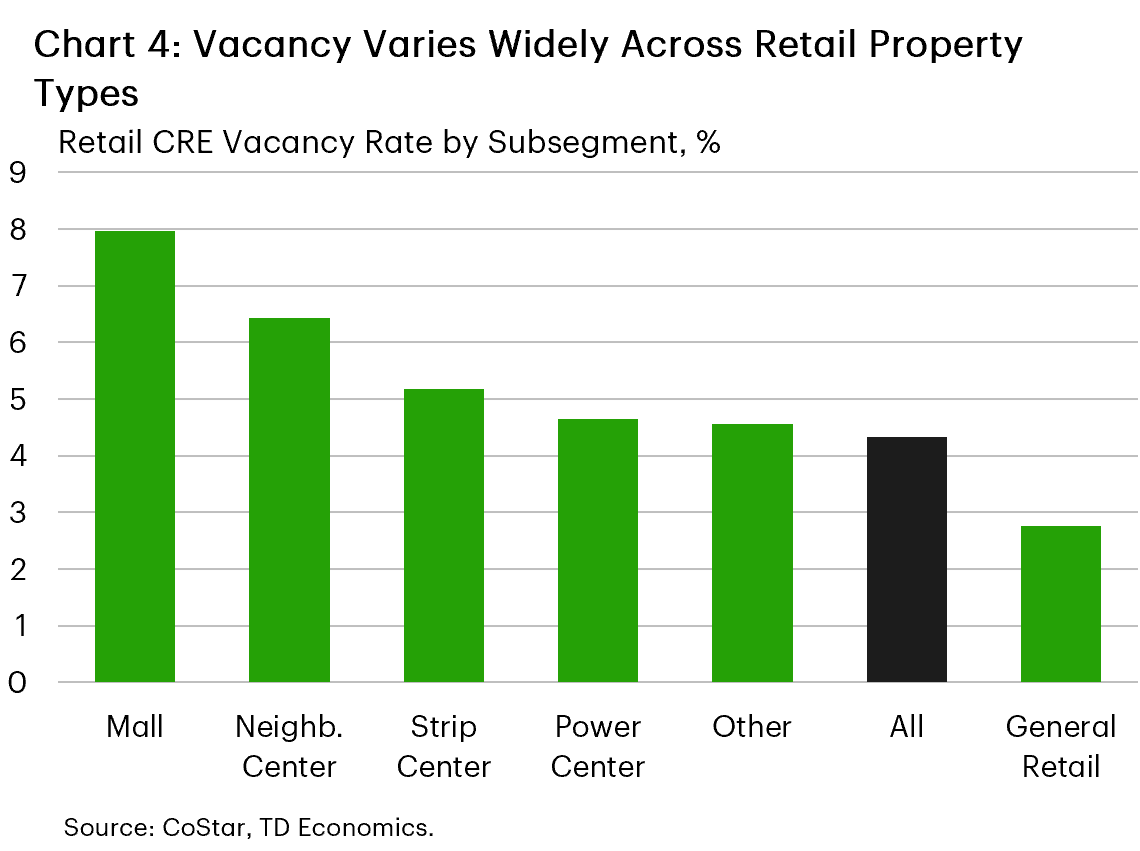
Conditions also vary across the country. Vacancy is below 3% in Boston, Minneapolis and Raleigh, and ranges from 3.1% to 3.5% in Miami, Charlotte, Austin and Nashville. These markets do not share a single regional profile. Some are mature metros where additions to inventory are difficult, while others are faster-growing Sun Belt markets where population and household growth have helped absorb new space. Conditions are looser in Houston, Baltimore and parts of Southern California, where vacancy ranges from 5.5% to 6.0%. But even these readings remain relatively contained compared with vacancy rates in other major CRE segments.
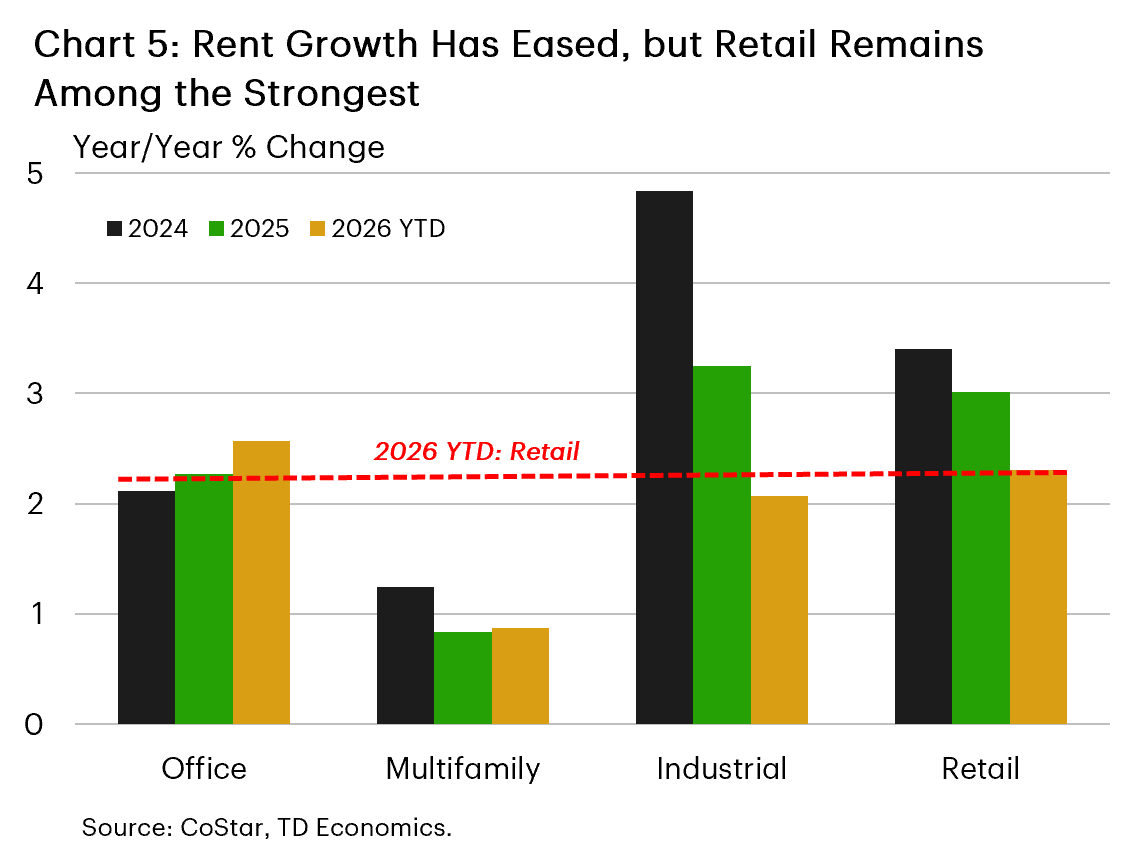
However, relatively tight retail conditions are not an unqualified benefit. In some markets, available properties may be too small, poorly located or require substantial investment to meet tenants’ needs, likely acting as a headwind to expansion plans. Nevertheless, tight conditions continue to support rents, even as the market has transitioned from unusually rapid post-pandemic gains to a steadier pace of growth. Asking rents were up just shy of 2% year-on-year in the third quarter, down from 3% in 2025, but broadly in line with the long-term average and still among the strongest showings across the major CRE segments (Chart 5). Signs of improved retailer productivity, reflected in higher sales per occupied square foot, should give some tenants greater capacity to absorb higher occupancy costs and support further rental gains.
Higher Yields Raise the Development Hurdle
The shortage of suitable space creates an incentive to build, but a meaningful supply response remains unlikely over the near-to-medium term. Construction costs remain elevated, while prevailing rents often fall short of those needed to make new speculative projects viable. The recent surge in longer-term bond yields has raised the financing hurdle further, with the benchmark 10-year Treasury yield recently holding near 5.2%, among its highest levels since 2007. Higher financing costs are also creating friction for transactions already underway, prompting some buyers to seek price reductions or revised terms while complicating refinancing and construction lending. While our forecast has the 10-year yield easing by 50 basis points or so by the end of 2027, borrowing costs are likely to remain elevated relative to most of the post-GFC period. Elevated financing costs will remain a hurdle to the pace of retail development and will likely continue to play a role in keeping it subdued over the near-to-medium term.
Healthy Fundamentals Do Not Eliminate Financing Risk
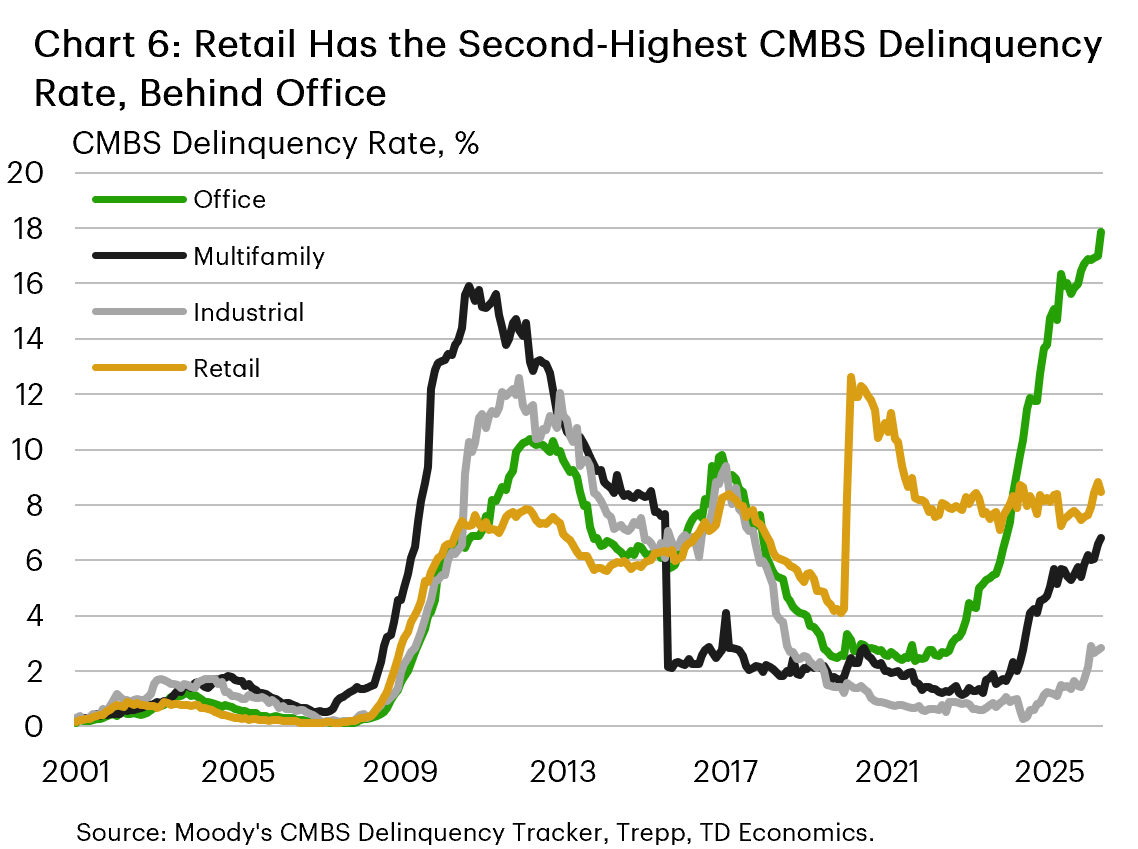
Comprehensive data on retail CRE loan performance are limited, particularly outside the securitized market. The timeliest property-specific read comes from commercial mortgage-backed securities (CMBS), which provide valuable insight into emerging risks. That said, CMBS makes up only a small portion of the CRE debt market and may not be representative of loans held by banks, life insurers and other lenders. The broader securitized category that includes CMBS accounted for about 13% of outstanding commercial and multifamily mortgage debt in the second quarter, compared with 38% held by banks and thrifts.2 The data should therefore be viewed as an indicator of potential stress in some corners of retail CRE debt, rather than a measure of performance across the entire retail loan market.
Within CMBS, retail delinquency has trended moderately higher since early 2026 and remains the second-highest among the major property types shown, behind office (Chart 6). The increase has nonetheless been considerably less pronounced than the deterioration in office loans. Still, risks could intensify as elevated interest rates challenge borrowers refinancing maturing loans that originated when financing costs were substantially lower. The divergence between healthy property fundamentals and pockets of financing stress shows that strong sector-wide occupancy does not insulate every property or borrower from refinancing risk.
Bottom Line
The retail demand outlook remains broadly supportive, although elevated interest rates remain a headwind and add to downside risks. Demand for retail space maintained its positive momentum through the third quarter, while planned store openings should support additional move-ins in the months ahead. However, elevated energy costs, broader inflation pressures, including those related to tariffs, and higher borrowing costs could weigh on household purchasing power, particularly among lower-income consumers. Overall, retail leasing could lose some momentum if consumption growth moderates to a more typical pace, as anticipated, but limited additions to supply mean the sector does not require especially strong demand to remain balanced. The sector’s lean and heavily pre-leased construction pipeline should help keep vacancy low and rent growth positive.
Endnotes
- Coresight Research, US Store Tracker Extra, September 2026. https://coresight.com/research/us-store-tracker-extra-september-2026-larger-openings-offset-closures-for-28-8-million-square-feet-net-gain/
- MBA, Commercial/Multifamily Mortgage Debt Outstanding, September 2026. https://www.mba.org/news-and-research/newsroom/news/2026/09/29/commercial-and-multifamily-mortgage-debt-outstanding-increased-by--42.9-billion-in-second-quarter-2026
Disclaimer
This report is provided by TD Economics. It is for informational and educational purposes only as of the date of writing, and may not be appropriate for other purposes. The views and opinions expressed may change at any time based on market or other conditions and may not come to pass. This material is not intended to be relied upon as investment advice or recommendations, does not constitute a solicitation to buy or sell securities and should not be considered specific legal, investment or tax advice. The report does not provide material information about the business and affairs of TD Bank Group and the members of TD Economics are not spokespersons for TD Bank Group with respect to its business and affairs. The information contained in this report has been drawn from sources believed to be reliable, but is not guaranteed to be accurate or complete. This report contains economic analysis and views, including about future economic and financial markets performance. These are based on certain assumptions and other factors, and are subject to inherent risks and uncertainties. The actual outcome may be materially different. The Toronto-Dominion Bank and its affiliates and related entities that comprise the TD Bank Group are not liable for any errors or omissions in the information, analysis or views contained in this report, or for any loss or damage suffered.