Private Credit: Risks and Realities
Ksenia Bushmeneva, Economist | 416-308-7392
Paul Kim, Economic Analyst
Date Published: June 3, 2026
- Category:
- U.S. Business Investment Financial Markets
Questions
- Q1. What is private credit: who lends, who borrows and why has it grown so fast?
- Q2. Why is private credit suddenly everywhere?
- Q3. How is private credit connected to the banking system?
- Q4. What are the key risks inside private credit?
- Q5. Where could spillovers end up?
- Q6. How serious are risks today? What would change that view?
- Q7. What are regulators doing to address these issues?
Private credit has come under scrutiny in recent months. A series of high-profile bankruptcies and loan-write downs, concerns around exposures to sectors such as software, and rising redemption pressure in retail-facing vehicles have raised questions about the resilience of the asset class. Previously steady inflows and stable valuations are now giving way to signs of strain, including steep sell-offs in publicly listed funds and elevated redemptions in non-traded funds.
These developments matter because private credit is no longer a niche market. Estimates of the U.S. private credit loan market place its size in a $1.4 - $2.0 trillion range, comparable in size to the high-yield bond or the syndicated loan markets.1 As such, it has become an important source of financing for middle-market firms and borrowers below investment grade. It is also becoming more connected to the broader financial system through banks, insurers, pension funds and, increasingly, retail investors.
This primer examines these developments and what they mean for the financial system. It outlines how the market works, why it grew so quickly, where risks are emerging, and how stress in the sector could affect credit conditions and the wider economy.
Q1. What is private credit: who lends, who borrows and why has it grown so fast?
Private credit is corporate lending that happens outside public bond markets and traditional bank lending. It is primarily originated by non-bank lenders, including private equity firms’ credit arms and asset managers that structure loans directly with borrowers.
Historically, private credit largely served middle-market firms, borrowers that are too large or risky for bank loans, but too small for public bond markets.2 Their profiles are broadly comparable to non-investment grade borrowers, with higher debt levels and more variable earnings. However, over the past decade, private credit has been increasingly financing larger borrowers and participating in transactions that would have previously been syndicated by banks or funded in public markets, particularly among faster-growing firms in the technology sector.3
For borrowers, the attraction of private credit is speed and flexibility. Companies can secure financing faster with structures tailored to their circumstances. The trade-off is price: interest rates on private credit tend to be higher than on comparable loans.4
Private credit’s initial rise followed the Global Financial Crisis. As investors searched for higher returns amid low interest rates and banks retreated from riskier corporate lending due to stricter regulations, private credit emerged as an attractive alternative, drawing capital and establishing itself as a new source of financing.
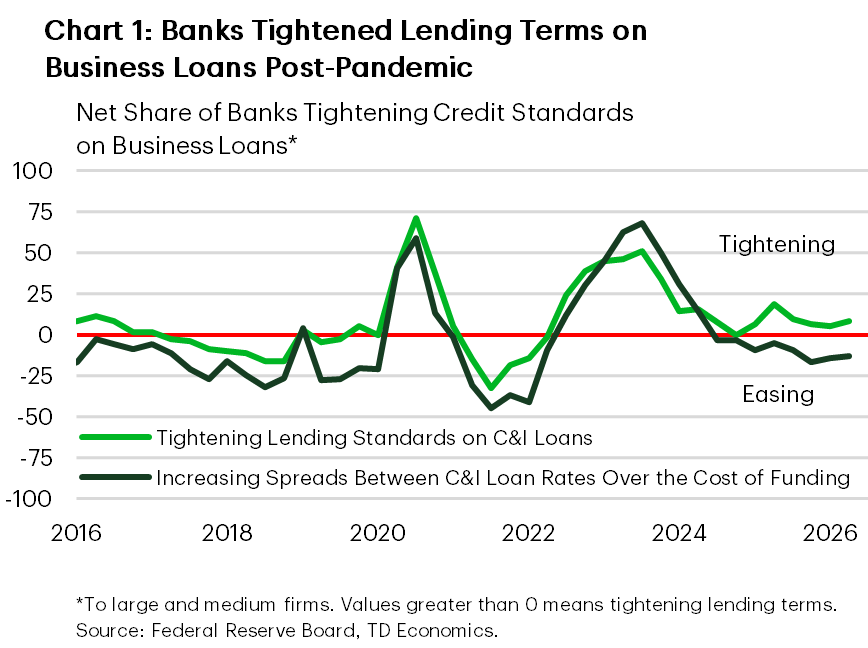
Growth accelerated after the pandemic. With rising interest rates and tighter lending standards, borrowing became more expensive and refinancing harder for leveraged firms (Chart 1). Many borrowers turned to private credit, where capital remained available and terms were more flexible.5
Investor demand provided another boost. Amid the market turbulence of 2022 and 2023, institutional and retail investors were attracted by private credit’s higher yields and lower reported volatility compared to public bonds and equities. The trade-off: reduced liquidity and transparency—investors can’t easily withdraw funds and must rely on fund managers for information about asset quality.
Institutional investor – including pension funds, insurance companies, and sovereign wealth funds – make up the bulk of private credit investors and have steadily increased their exposure to this asset class.
Banks have also contributed indirectly, providing loans and credit lines—often backed by investor commitments or loan portfolios—that offer funds extra liquidity and leverage. Even as banks reduced direct corporate lending, many continued to finance private credit funds, including credit facilities to business development companies (BDCs).6 This has created an indirect link between banks and private credit.7 Based on data through the fourth quarter of 2025, banks were still lending to private credit funds and BDCs, with loan commitments and outstanding amounts increasing over the previous quarter.
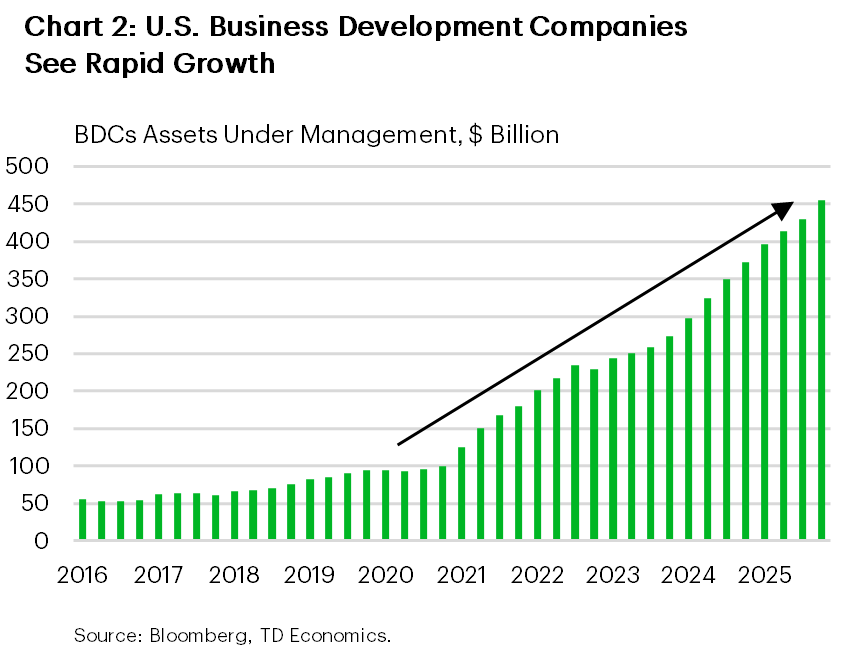
Retail access is growing but remains limited, usually through pooled vehicles like BDCs and interval funds. These vehicles restrict redemptions to protect investors during periods of stress. The number of active BDCs has nearly doubled between 2021 and 2026, and their assets under management have more than tripled, from roughly $125 billion at the start of 2021 to around $450 billion by the end of 2025 (Chart 2).
Q2. Why is private credit suddenly everywhere?
Private credit isn’t new, but it has grown rapidly, become more interconnected with the regulated financial system, and expanded into retail markets. Together, these shifts have brought a historically opaque, illiquid market into public view.
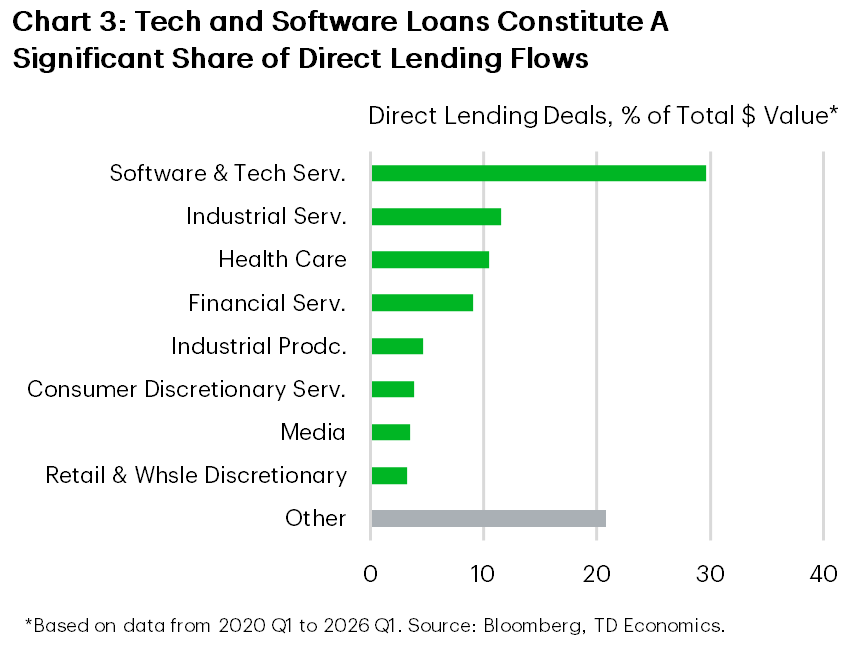
That scrutiny has intensified as signs of credit deterioration have become more visible. Higher interest rates have put pressure on more leveraged borrowers , while a handful of high-profile restructurings and loan write downs have highlighted how losses can crystallize quickly when borrower stress forces a rapid reassessment of values that had previously appeared stable.8 The sector has a significant concentration of loans to software and technology firms, with roughly 30% of the direct lending deals over the past six years made to software and technology companies (Chart 3). The risk that these companies may be disrupted by AI also intensified investors’ concerns. The result has been a growing unease among both policymakers and investors about how risk is measured and recognized.
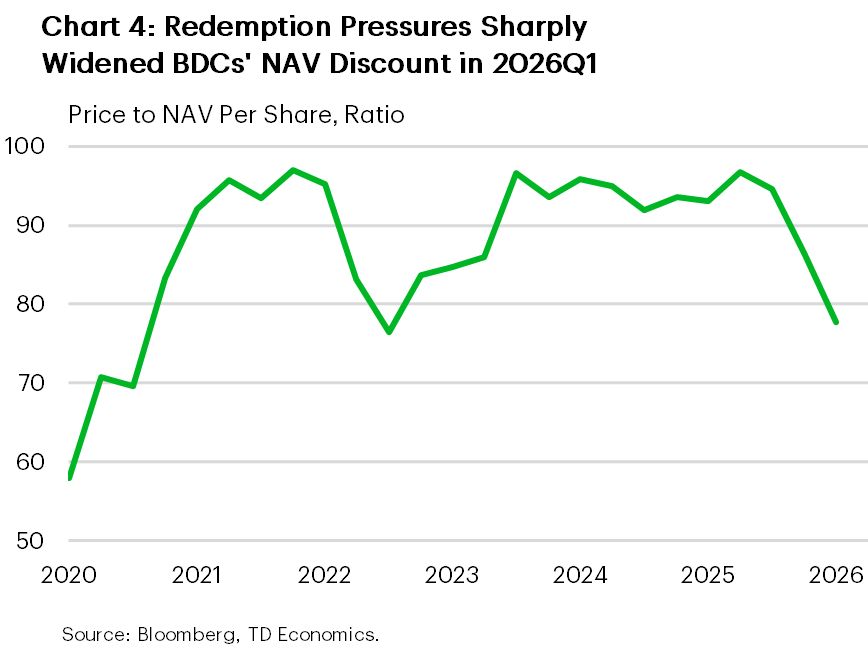
So far, the strain has been most visible in BDCs, the primary gateway for retail investors. Publicly traded BDCs have seen share prices decline. Many now trade at discounts of 5% to 45% of their reported net asset value (NAV) - the fund’s estimate of the value of its assets after accounting for debts and expenses. This suggests investors are discounting reported values in anticipation of further write downs (Chart 4).9
Non-traded BDCs have also been in the spotlight. These funds are deliberately illiquid and cap redemptions, typically at around 5% of net asset value per quarter. Recently, redemption requests have surged well beyond those limits. In the first quarter of 2026, nearly $14 billion was requested, but only about half was paid out. Without a sustained improvement in investor confidence, redemption pressure is likely to persist, carrying forward into each new redemption window.
Q3. How is private credit connected to the banking system?
Private credit is connected to banks through fund-level financing. While most private credit capital comes from long-term investors such as pension funds and insurers, banks support credit funds with revolving credit facilities and NAV-based loans that provide day-to-day liquidity.
The link is meaningful but small relative to the overall banking system. The Office of Financial Research estimates that banks and nonbanks provide roughly $410–$540 billion of debt financing to private credit funds.10 For the largest U.S. banks, which are subject to Federal Reserve stress-testing, exposures is around $120 billion in committed facilities, of which $30 billion is to BDCs. This is a small exposure relative to $1.6 trillion of Tier 1 capital held by these banks. Of the amount committed, $74 billion was utilized, representing less than 5% of total C&I loans outstanding across these large commercial banks.
At the same time, leverage inside much of the private credit sector is limited. For example, business development companies (BDCs) are subject to asset coverage requirements that effectively cap debt at roughly one to two times equity, depending on the elected regulatory threshold.
Still, these linkages can amplify in a downturn. If the value of underlying loan portfolios begins to fall, borrowing capacity tied to those portfolios can decline, while banks may simultaneously tighten credit terms or reduce available borrowing capacity. Funds may respond by drawing more heavily on existing credit lines, raising capital, or scaling back new lending. This can increase banks’ drawn exposure in the near term, even as asset values are under pressure. Even in that scenario, however, losses are absorbed first by the fund and its investors. Banks are affected only if those equity and valuation buffers are exhausted, meaning asset values can decline substantially before banks begin to incur losses.
Finally, private credit both complements the banking system, but also competes with it for borrowers. If private credit retreats, banks can step in to absorb part of the shortfall. In fact, this rotation appears to already be underway. Private credit firms saw their lending shrink in the first quarter of this year, while banks recorded a 10% year-over-year increase in commercial and industrial loans in April—a sharp reacceleration following a period of little-to-no growth through 2024 and 2025.
Q4. What are the key risks inside private credit?
The core features of private credit: that loans are privately negotiated and typically held to maturity are the source of the main risks. Private credit is opaque and lacks timely indicators on underlying asset quality. This allows lenders to look beyond short-term market volatility and work with borrowers facing liquidity challenges. However, it also results in opaque loan valuations and delayed recognition of deteriorating loan quality. Without real-time market prices, it becomes harder to assess the true value of these loans.
Losses may also be recognized with a lag – as several recent cases involving private credit have shown – and then be sharply adjusted once valuations are reassessed.8 In public markets, corporate stress is quickly reflected in prices, ratings, or loan defaults. In contrast, private credit lenders can amend terms, extend maturities, or restructure loans without triggering a formal default. This flexibility can support viable borrowers and reduce the need for fire sales, but it can also mask deteriorating financial performance. As a result, reported default rates may remain low even as underlying fundamentals worsen.
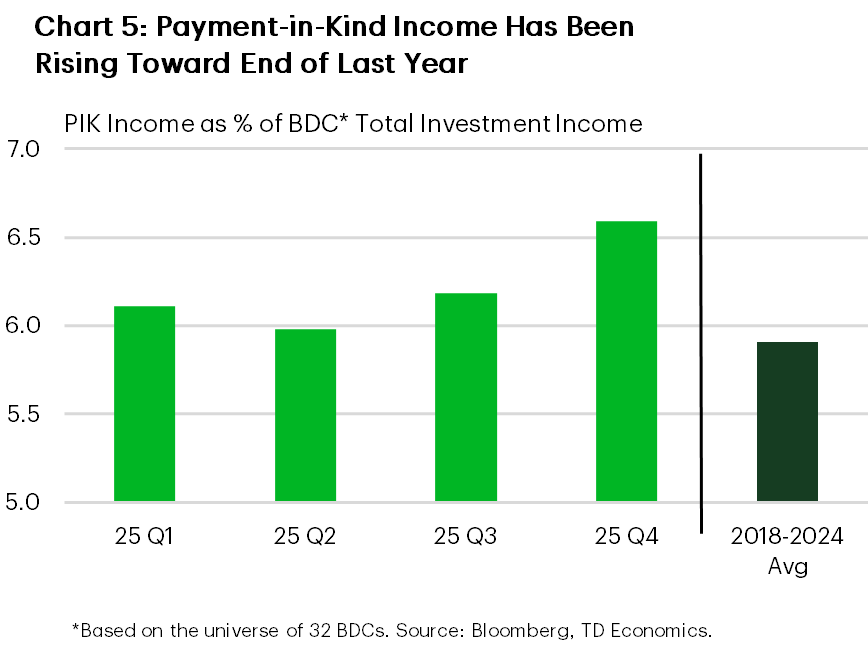
The growing use of payment-in-kind (PIK) provisions toward the end of last year has highlighted these dynamics (Chart 5). PIK allows borrowers to defer cash interest payments, easing near-term pressure on cash flows. However, this adds to the debt burden, increases leverage, and postpones the recognition of underlying financial stress.
These risks are more subdued when funding primarily comes from long-term institutional investors, such as pension funds and insurance companies. However, they become more pronounced in vehicles that offer investors greater liquidity and periodic, typically quarterly, access to capital. Semi-liquid structures, such as non-traded BDCs and interval funds, pair illiquid loans with scheduled redemption windows. When concerns rise, investors are incentivized to redeem early. If requests increase or persist, managers may limit withdrawals (typically 5% of NAV), sell assets to meet redemptions, or reassess valuations—turning a gradual credit problem into an immediate liquidity event.11
As a result, the timing of stress and volatility can differ depending on the type of investment vehicle. In more locked-up structures, losses can build gradually and emerge later – sometimes all at once. In semi-liquid vehicles, stress may surface earlier through redemptions, discounts, or limits on withdrawals. These events can serve as early indicators of credit deterioration and reflect differences in risk and liquidity preferences between retail and institutional investors. In both cases, adjustments can be sharper if funding conditions tighten at the same time credit quality weakens.
Q5. Where could spillovers end up?
The primary spillover risk from private credit at this stage is a tightening of credit conditions. Should private credit deteriorate, the effects will first become evident in the most liquid and timely segments of the market—Business Development Companies —through continuous redemption requests in non-traded BDCs and further declines in stock prices in publicly traded BDCs. Investor inflows have already shifted to outflows within BDCs as confidence has waned. Existing redemption caps in BDCs help to mitigate the risk of runs and widespread fire sales of assets; however, persistent outflows could make it difficult to raise new capital, prompting managers to hold more liquidity, slow new lending, or selectively sell assets.
Private credit is a significant source of financing for leveraged firms, and a reduced supply may leave some firms struggling to refinance their debt. This could result in higher corporate default rates, which would likely cause further tightening in business credit conditions across the financial system.
Banks may also tighten financing to private credit funds at the same time as these funds are facing increased redemption requests or rising defaults. This would further restrict the availability of private credit, reinforcing tighter lending conditions for middle-market and leveraged companies and likely prompt further asset sales.
At the heart of the issue is confidence. Private credit relies heavily on trust in manager-set valuations and underwriting standards, which are not continuously tested by the market. When that trust diminishes, stress spreads less through realized losses and more through increased caution. Risk tolerance declines, financing becomes more difficult to obtain, and activity slows—even for borrowers who remain fundamentally sound.
Q6. How serious are risks today? What would change that view?
Currently, developments in private credit markets remain contained because the market remains relatively small and its liabilities are less susceptive to rapid withdrawal. The risk of mass withdrawals is mitigated by the fact that retail-facing funds can cap quarterly redemptions, and institutional investors — who dominate the market — typically have capital locked up for several years. This structure argues for some orderly liquidation of assets should redemption or funding pressures persist.
Some added comfort stems from the private credit market still being relatively small, accounting for just 14% of nonfinancial corporate debt. Household exposure is also minimal: BDC holdings account for less than 0.5% of total household financial assets. While U.S. pension funds and insurance companies have significantly increased their allocations to private credit, they remain low as a share of their total financial assets. For U.S. pension funds, approximately 1.4% of their total financial assets were allocated to private credit at the end of 2024, while in the case of insurers, the asset class constituted around 1.5% of their total cash and invested assets.
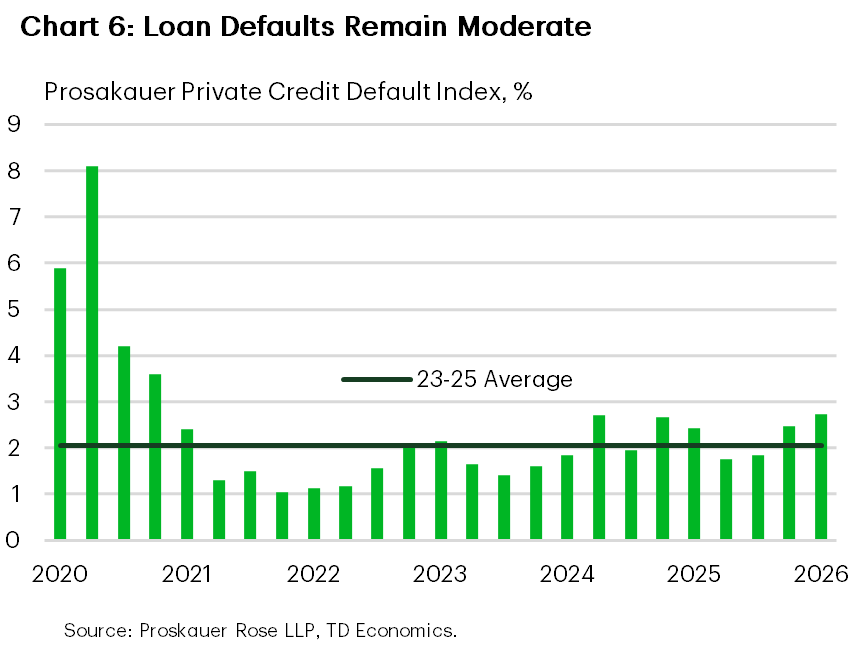
Signs of pressure are visible but remain limited. Defaults have edged up but are still low by historical standards (Chart 6). The overall PIK share of BDC income has been trending higher throughout 2025, but is generally in line with the post-pandemic average. However, there’s significant variability across BDCs – and for some BDCs the PIK share at the end of last year was nearly double its post-pandemic average.
Non-traded BDCs faced a notable increase in redemption requests above the redemption caps, and traded BDCs are trading at discounts. A few funds sold some assets to repay investors, but those were not widespread and there were no broad-based write‑downs across loan portfolios. Assets that have been liquidated so far have been sold close to their par value.12 This resilience reflects who holds the risk. The bulk of private credit exposure sits mainly with pensions, insurers, and other long‑term investors whose long time horizons allow them to be patient.
Should it intensify, stress in private credit is unlikely to destabilize the financial system solely through credit losses. In a severe default scenario with rates rising to 10%, this would translate to about $140 - $200 billion in defaults. Assuming a conservative 40% recovery rate, losses would be approximately $84 - 120 billion, likely leading to only a modest drag on GDP and lending. By comparison, during the Great Financial Crisis household credit that was more than 120 days past due had reached $521 billion at its peak in Q1 2010 – eight times its pre-crisis level.
The main risk stems from indirect transmission channels linked to liquidity and financial conditions, particularly through counterparty exposure. There is roughly $300 billion in uncalled capital commitments13 from private credit investors such as pension funds and insurers. Should redemption and liquidity pressure on private credit funds increase, the funds can tap into these uncalled capital commitments which pension funds and insurers have contractual obligation to provide. While usually manageable, capital calls can become liquidity stressors in prolonged downturns, potentially forcing pension funds and insurers to liquidate some assets to meet their contractual obligations. Meanwhile, losses on private credit investments could put pressure on funding/coverage ratios of insurers and pension funds or regulatory capital (insurers). This could trigger capital-based adjustment (for example, portfolio rebalancing and selling of riskier assets) and potential regulatory intervention for insurers, whereas pension funds could respond through higher required contributions.
The current risk assessment would change if several signals began to move together. Broad‑based asset valuation cuts, rather than isolated markdowns, would suggest losses are no longer being deferred. A sustained rise in non‑performing loans alongside heavier reliance on interest deferrals would point to borrower stress that can no longer be managed quietly. Rising frequency of the sale of assets or fund stakes at a discount, would raise the risk of feedback loops. And a simultaneous tightening of bank financing would put strain on the main link between private credit and the regulated system.
Absent that convergence, the more plausible outcome is a market adjustment, particularly in its retail facing segment, not financial rupture. Even severe stress—much like what commercial real estate has already endured—can weigh on growth and confidence for years without triggering a systemic crisis. Private credit may yet prove painful for some investors and borrowers, but its structure makes a sudden collapse unlikely.
Q7. What are regulators doing to address these issues?
Recent strains in private credit have not gone unnoticed by regulators. The central concern is migration of lending activity into parts of the financial system that are less transparent and harder to monitor in real time.
At the global level, regulators have coordinated efforts to improve oversight of non-bank finance, with a particular focus on closing data gaps through increased reporting requirements. The emphasis has been on strengthening disclosure, governance, and due diligence expectations so supervisors can better understand where leverage sits and how exposures are linked across institutions and borders.
In Canada, the response has centered on gaining a clearer picture of credit exposures across the regulated financial system. Supervisors now require more detailed, loan level reporting for wholesale credit, covering corporate and commercial lending.
In the United States, attention has focused on valuation practices, fund governance, and products that bring private assets closer to retail investors. Investor protection bodies have also emphasized stronger guardrails for retail facing funds, while the Treasury Department has stepped up coordination with insurance regulators to better assess systemic and financial stability risks associated with the sector’s growth.
In short, the regulatory response reflects caution rather than alarm. Authorities are seeking to improve visibility and market discipline in areas where opacity is greatest, while preserving the benefits private credit has brought to business financing. That measured approach is consistent with a market that warrants close monitoring, but one regulators do not yet view as an immediate threat to financial stability.
End Notes
- Preqin. (2026, May 5). BDCs at $500bn: Enhanced transparency into private credit. https://www.preqin.com/insights/research/factsheets/bdcs-at-500bn-enhanced-transparency-into-private-credit
- International Monetary Fund. (2024). Global financial stability report: Chapter 2 (April 2024). https://www.imf.org/-/media/files/publications/gfsr/2024/april/english/ch2.pdf
- Degerli, A., & Monin, P. (2024, August 2). Private credit growth and monetary policy transmission. FEDS Notes. Federal Reserve. https://www.federalreserve.gov/econres/notes/feds-notes/private-credit-growth-and-monetary-policy-transmission-20240802.html
- For example, Institutional Term Loan B in the leveraged-loan market https://www.federalreserve.gov/econres/notes/feds-notes/private-credit-characteristics-and-risks-20240223.html
- Growth has closely tracked private equity. Roughly 70% of private credit deals involve companies sponsored by private equity firms. https://www.imf.org/-/media/files/publications/gfsr/2024/april/english/ch2.pdf
- Business development companies (BDCs) are regulated investment vehicles that lend to small and mid‑sized companies and pass most of the interest income through to investors. Some BDCs trade on stock exchanges, while others are non‑traded (private) BDCs sold through financial advisers with limited, periodic liquidity. Interval funds are investment funds that hold illiquid assets, such as private credit, and allow investors to withdraw money only at set intervals and up to a capped amount, rather than daily.
- Research suggests BDCs’ cost of capital has declined over time, converging toward that of U.S. banks—further supporting growth. Bank for International Settlements. “The global drivers of private credit.” https://www.bis.org/publ/qtrpdf/r_qt2503b.htm
- Firms including First Brands Group, Tricolor Holdings, and Infinite Commerce Holdings have undergone restructurings that triggered steep write downs. In the case of Infinite Commerce, a loan marked at par was written down to zero within just three months. More recently, software maker Medallia defaulted on roughly $3 billion in private credit, with loan values dropping from about 80 cents on the dollar late last year to near 60 cents by April. https://www.wsj.com/finance/investing/two-big-loan-defaults-add-to-pain-in-private-credit-funds-b179351c
- In private credit, these values are not set by active markets but instead rely on manager estimates that are updated periodically. As a result, NAV can lag behind changes in credit conditions or investor sentiment.
- Office of Financial Research. (2026). Measuring counterparty exposures to private credit (OFR Brief No. 26-02). U.S. Department of the Treasury. Available at: https://www.financialresearch.gov/briefs/files/OFRBrief-26-02-measuring-counterparty-exposures-private-credit.pdf
- For example, Blue Owl has permanently restricted investors from existing its Blue Owl Capital Corp II debt fund and sold off some of its assets to gradually return capital back to investors. Instead of quarterly redemptions, the fund pivoted to periodic payouts, with timing being at fund’s discretion, funded by asset sales, earnings, repayments and other strategic deals. https://www.ft.com/content/cdca18df-473c-4c66-a6db-d9be32bf9d88?syn-25a6b1a6=1
- Three BDCs managed by Blue Owl Capital sold $1.4 billion of partial assets on February 12th and were priced at 99.7% of par value. Proceeds from sales went to toward debt repayment and capital return. New Mountain Finance Corp., a New Mountain Capital BDC, sold $477 million in assets at 94% of par value.
- Uncalled capital commitments are the portion of an investor’s pledged capital that has not yet been drawn by the fund manager, but remains a binding contractual obligation to be funded when called.
Disclaimer
This report is provided by TD Economics. It is for informational and educational purposes only as of the date of writing, and may not be appropriate for other purposes. The views and opinions expressed may change at any time based on market or other conditions and may not come to pass. This material is not intended to be relied upon as investment advice or recommendations, does not constitute a solicitation to buy or sell securities and should not be considered specific legal, investment or tax advice. The report does not provide material information about the business and affairs of TD Bank Group and the members of TD Economics are not spokespersons for TD Bank Group with respect to its business and affairs. The information contained in this report has been drawn from sources believed to be reliable, but is not guaranteed to be accurate or complete. This report contains economic analysis and views, including about future economic and financial markets performance. These are based on certain assumptions and other factors, and are subject to inherent risks and uncertainties. The actual outcome may be materially different. The Toronto-Dominion Bank and its affiliates and related entities that comprise the TD Bank Group are not liable for any errors or omissions in the information, analysis or views contained in this report, or for any loss or damage suffered.