Shedding Light on U.S. Office CRE Risks
Date Published: May 1, 2023
- Category:
- US
- Real Estate
- State Local & Analysis
Highlights
- Office CRE fundamentals remain sluggish – a narrative highlighted by the fact that the sector’s vacancy rate recently eclipsed its Global Financial Crisis peak and rose to a new all-time high. The persistence of remote and hybrid work arrangements, an expected deceleration in U.S. economic growth, and the fact that more office inventory is slated to hit the market this year, suggest that there’s no relief on the horizon.
- Between the weak fundamentals weighing on the revenues generated by office properties, interest rates moving sharply higher over the past year and banks tightening CRE lending standards, there’s little doubt that we will see more office loan defaults, particularly as a substantial number of loans are set to renew in this tough environment.
- The recent banking turmoil adds to the risks given that regional banks are an important source of funding for commercial real estate loans.
- Smaller banks, including regional and community banks, are generally more exposed to CRE debt compared to the top 25 largest banks. However, their exposure to the weakest corner of CRE (the office market) is more limited. Moreover, once factoring in nonbank players in the CRE lending space (i.e., Life insurance companies, CMBS etc.) the exposure and perceived risks tied to the smaller banks is much lower. Fed measures to help support liquidity in the banking system are expected to continue to serve as an important mitigating factor.

The COVID-19 pandemic has come and gone, but three years after, the office commercial real estate (CRE) market remains in a precarious position. The persistent sluggishness in the sector – most recently highlighted by a record high vacancy rate – has kept downward pressure on rents and prices, with the latter showing a pronounced underperformance compared to the other major CRE sectors (Chart 1).
As commercial office loans come up for renewal this year, the combination of weak fundamentals, tighter credit conditions and a high interest rate environment is likely to challenge the ability of many office owners to meet debt obligations. This raises red flags regarding the potential for loan defaults, a decline in property values and other second-order impacts that could ripple through financial markets. The recent turmoil across the regional banking sector adds to these risks given that regional banks are an important source of funding for commercial real estate loans. In this paper, we take stock of the pressures in the office sector and address several burning questions regarding this important corner of the CRE market.
Q1. What are the main problems in the office CRE market?
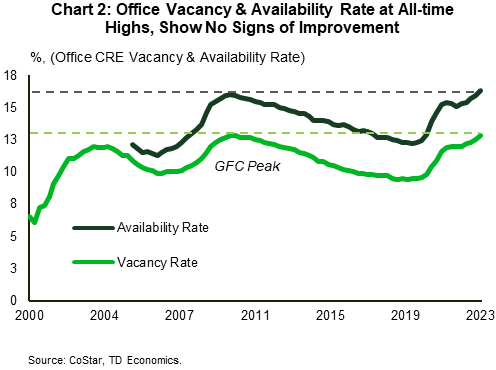
According to CoStar, the commercial office sector’s vacancy rate eclipsed its Global Financial Crisis (GFC) peak, rising to a new record high of 12.9% last quarter. Vacancy rate levels vary by data source due to market coverage differences and potential variations in methodology etc. For instance, Cushman & Wakefield, and JLL point to a much higher U.S. office vacancy rate of respectively 18.6% and 20.2% last quarter.1 That said, the theme that the office vacancy rate has risen to very high levels is consistent across sources. Sticking to CoStar data, last quarter’s record-high vacancy rate is actually hiding some weakness. Utilization rates across the office space remain well below their pre-pandemic level given that many corporations are operating under hybrid work arrangements. Based on one source, office usage across ten large U.S. metro areas is still less than half its pre-pandemic level.2 Many firms with existing long-term leases are choosing to sublease part of their office space. Across the country, there’s an estimated 214 million square feet available for sublease – more than double that pre-COVID. Due to the massive flood of sublease inventory, the availability rate – a better measure of slack under current conditions – stands at a much larger 16.4%, which is also its highest level on record (Chart 2).
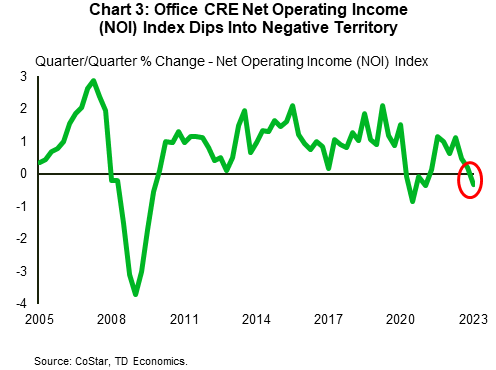
The loose market conditions are impacting the revenue stream generated by these properties. Office rents have barely grown since the start of the pandemic and are up only 1% over the past year – a much softer showing compared to other major CRE sectors, especially industrial and multifamily (refer back to Chart 1). Keep in mind that this comparison is in nominal terms. With price measures up in the double digits since the start of the pandemic (i.e., 16% for total CPI or 14% for PCE), inflation-adjusted office rents are down substantially over the same period. In addition, net operating income (NOI), a measure that factors in operating expenses, fell modestly last quarter in nominal terms, marking its first pullback (outside of the pandemic) since 2009 (Chart 3).
Note that there’s a regional element to the weak narrative in the office space. Looking through the 30 largest office markets across the country, we can see that pressures are not spread out evenly (see Table 1 in the appendix). In some Southeast markets, such as Miami and Tampa, which benefited from an inflow of people and businesses during the pandemic, office vacancy rates are not that much higher today than they were at the end of 2019. However, the pandemic’s lingering impact has proven more severe for others, such as San Francisco and Seattle, with vacancy rates in these two metros at respectively around triple and double their pre-COVID levels.
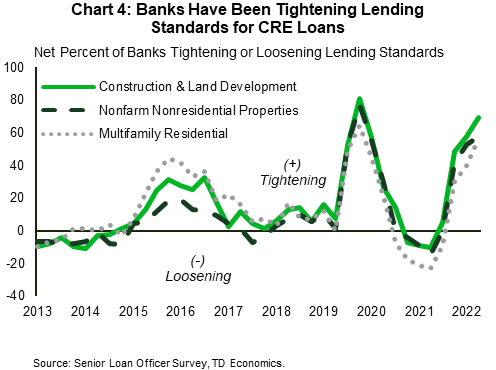
Office properties are often bought through commercial loans. Servicing the debt on an existing property purchased through a floating-rate loan or securing financing at renewal have gotten more difficult with weak fundamentals challenging income-generation, and with interest rates migrating sharply higher over the past year. This combination of factors has meant that some owners have not been able to keep up with debt obligations, with PIMCO’s Columbia Property Trust and Brookfield Corp marking recent high-profile defaults. Moreover, reflecting an increased risk environment, banks have been tightening lending standards for all types of CRE loans at a fast clip (Chart 4). The tighter lending environment is an added headwind for new deal activity, which has already retreated swiftly. New transaction volume for office properties fell to just under $14 billion at the end of last year, the weakest fourth-quarter print since 2009, while 2023 has similarly gotten off to a slow start.
Q2. Is there a turnaround in sight for office CRE fundamentals?
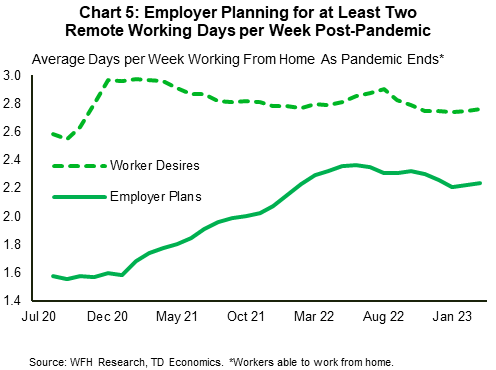
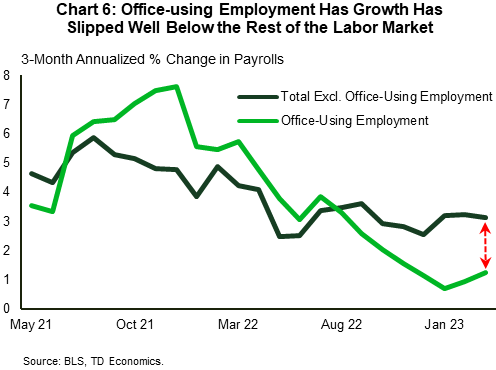
Office-using employment recovered quickly following the onset of the health crisis, outperforming the rest of the economy. Sectoral payrolls are up 5.8% from its pre-pandemic level, with notable strength exhibited across professional and business services (+7.1%) and information (+6.4%) – well above the 2.7% seen across aggregate private sector hiring. However, because of the persistence in remote working arrangements, the strength in office-using employment has not been fully reflected in demand for office space, with net absorption of office space remaining in negative territory for the fourth quarter in a row at the start of this year. To date, close to 30% of a 5-day workweek is still spent away from the traditional work office (for those that can work remotely).3 Employer plans for remote work have eased over the past year, but with 2.2 days per week still earmarked for remote work, it appears that the trend is here to stay in the post-pandemic world (Chart 5). Moreover, with employment growth poised to slow in the U.S. this year alongside a broader deceleration in the economy, demand for office space will also be impacted. The pandemic outperformance has already given way to a slower hiring pace, with office-using employment growth now trailing behind the rest of the economy by a wide margin (Chart 6). These conditions suggest that many office properties will continue to face pressures as lease renewal rates likely drift lower in the years ahead. Of the tenants that do renew, it is likely that some portion of tenants will be looking to reduce their overall footprint.
Making matters worse, the supply side is looking quite rich given the weak demand backdrop. Construction of previously scheduled projects is still going forward, with some 60 million square feet of new office space expected to come online by the end of the year. The uptrend in office-to-apartment conversions has grabbed media attention as one potential avenue that may offer some offset by removing slack out of the market, but we believe that this trend is unlikely to meaningfully affect conditions in the grand scheme of things. As a result, the office sector’s vacancy rate is expected to edge higher in the quarters ahead, likely peaking just below 14% by mid-2024 – roughly a full percentage point above its GFC peak.
Tilting to monetary policy, the Fed is nearing the end of its hiking cycle, with a final quarter-point hike expected at its next meeting in early May. After that, we expect the Fed to remain on hold for the rest of this year before gradually easing the policy rate starting in early 2024. Seeing through the cycle, and assuming no major surprises on the inflation front, long-term Treasury yields should trek lower in the quarters ahead, though at a very moderate clip (see our latest forecast here). Putting the pieces together, monetary policy should remain restrictive for some time. Its burden on the economy and office-using employment will eventually begin to loosen, but a “supportive” monetary environment, is further out in the forecast horizon, likely in 2025.
Q3. Will we see more defaults on commercial office debt?

The share of commercial office loans coming up for renewal is substantial, with Mortgage Bankers’ Association data indicating that about a quarter of office loans are set to mature this year.4 From a dollar-figure perspective, some $150 billion in nonbank office debt is expected to mature over the next two years – the bulk of which is set to come due this year (Chart 7). Given the tightening in credit conditions alongside the fact that many of these loans will be resetting at much higher interest rates, odds are that commercial office mortgage defaults will be on the rise over the coming year. It’s also worth mentioning that because valuations have been falling over the past several months, investors may have to make an equity injection in order to maintain an adequate loan-to-value ratio to even qualify for a new loan. Failure to do so would lead to a default.
Ascertaining property values across a broad range of assets is complicated by low deal activity. This challenge – combined with methodological differences in the way prices are calculated – has led to a wide variation in price measures. For example, the RCA Commercial Property Price Index (CPPI) for office properties has dropped a relatively moderate 7% from the recent peak through March. However, others – like the Green Street CPPI – show a much steeper decline of 25% from the recent peak (see here). The bigger the price drop, the higher the equity injection needed at maturity.
The combination of forces expected to lead to more defaults are easy to spot, but the number and size of defaults in the office sector remains difficult to estimate. Data from Trepp shows that the CMBS office delinquency rate (+30 days) has risen from 1.83% in January to 2.61% in March – not particularly high, but noticeably above levels seen at the start of the year. Similarly, the CMBS special servicing rate for office properties – yet another indicator of problems in the space and a reliable precursor as to where delinquencies may be headed – has risen from 4.01% to 4.77% over the same period.5 Lastly, prices for CMBS have also plunged recently, as yields have risen sharply higher, widening the spread between the return on these riskier assets and the risk-free rate (i.e., the 10-year Treasury note).
Keeping with the above theme, a recent report estimates that one in five commercial office loans will default, with a loss severity assumption of about 40% pegging “cumulative” losses to $82 billion across all institutions.6 Under this scenario, commercial office loan losses among banks alone are estimated at $38 billion, while losses to insurance companies and CMBS are estimated at $16 billion apiece. It’s important to reiterate that there’s a great deal of uncertainty with such estimates.
Among other things, the losses will depend on negotiations between the borrower and the original lender or the special servicer as in the case of CMBS. Just like in residential housing, the last step for an owner in default is to lose the asset if no alternative solution, such as a loan restructuring, can be found. Under current market conditions, some lenders may be less inclined to take this drastic step as doing so may result in significant losses given the decline in valuations. Extending better credit terms to the borrower may help them ride out the storm, potentially softening the overall decline in prices. Still, there are limits to how accommodative lenders or special servicers may be. In what can be viewed as a mitigating factor from a loss perspective, loan-to-value (LTV) ratios in the 50-60% range mean that only large price drops will ultimately result in a loss to the lender.7 As an example, if a property’s value falls by 30% and the LTV is 60%, then there’s still a cushion of around 10% insulating the lender from loss.
Q4. How does the recent stress in regional banking feature into this?
Regional banks are responsible for a good chunk of CRE lending and they have been under considerable stress of late. Following the collapse of Silicon Valley Bank (SVB) and Signature Bank, smaller regional banks across the country recorded large deposit outflows. This is likely to have weighed on their ability and appetite to issue commercial real estate loans. The cautiously optimistic news on this front is that deposit outflow among smaller banks appears to have abated in recent weeks.8 However, should the pressures return on this front – and assuming that the void left by regional banks is not fully satiated by other players in the market – this dynamic may lead to more commercial loan defaults and exert additional downward pressure on bank balance sheets, thus reducing further their ability to issue CRE loans.
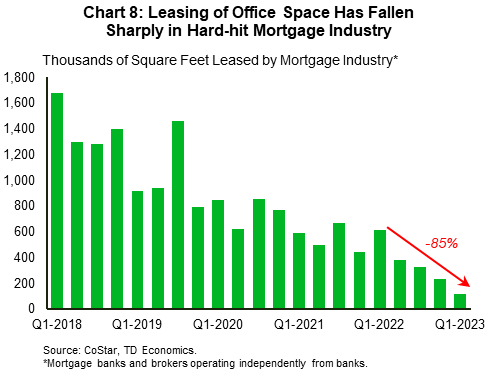
In addition, the banking sector is itself an important user of office space. Accordingly, to the extent that regional bank difficulties restrict hiring plans or lead to job losses, this could be an added factor that weighs on office usage. We’ve already seen this trend transpire in the hard-hit mortgage industry, where demand for office space has fallen sharply over the past year (Chart 8). Putting all the pieces together, it’s clear to see the potential for a significant negative feedback loop.
The exposure of regional banks to CRE is another area of concern. During last month’s banking turmoil, figures circulating in financial articles suggested that regional banks accounted for around three quarters of CRE lending. Federal Reserve data confirms that smaller banks (those not in the top 25) accounted for about 70% of all CRE loans among domestically chartered commercial banks last quarter.9 However, it’s important to recall that banks, both large and small, are not the only institutions that fund CRE loans. A Moody’s report shows that 135 regional banks with assets between $10-160 billion hold just under 14% of the $4.5 trillion of U.S. CRE debt, community banks with assets between $1-10 billion hold 9.6% of debt, while the smallest banks hold just over 3%. This makes up for a combined share among smaller banks (excluding the top 25 banks) of about 27%, which is much lower than 70% cited above (Chart 9). Yet another report, reaffirms the narrative for much lower exposure of about 30%. To be clear, within the banking sector, regional and community banks are still notably more exposed than the top 25 largest banks, but when factoring in the other players in the market, the exposure and risks associated with smaller banks is much lower.

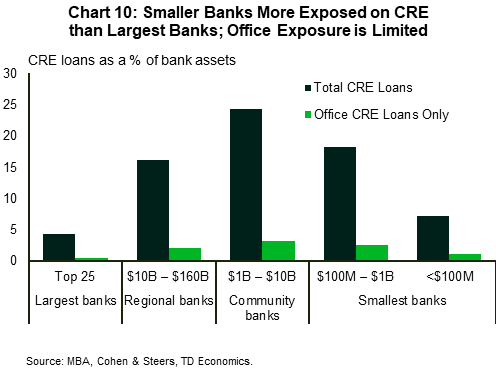
What’s more, it’s important to note that the above figures pertain to the broader CRE market and not just the office sector. There are certainly concerns with other CRE sectors too, such as retail and multifamily, with the vacancy rate in the latter having recently risen above its pre-pandemic level. But the fundamentals of these other sectors (especially the industrial sector) are generally in better shape, as they are not facing the same structural issues on the demand side as the office sector coming out of the pandemic. Outstanding office loans make up only about a fifth of total CRE debt, so exposures to the sector facing the biggest problems are even lower than overall CRE exposures may indicate. This diversification between the sectors may serve as a risk mitigating factor. Similarly, focusing on the banking sector, while regional and community banks are overexposed to CRE loans as a share of their assets compared to the largest 25 banks, office loans make up a relatively small share of this tally (Chart 10).
Finally, unlike prior periods of considerable stress, such as during the GFC, there are now more programs in place to help support liquidity in the banking system and keep the flow of credit going. One of these is the Fed’s new Bank Term Funding Program (BTFP) facility. BTFP loans to banks are lent to book value instead of the market value of assets. This feature is important as it reduces the need for an institution to sell assets quickly and perhaps at a loss, in times of stress. Weekly Fed data show that banks’ use of emergency loan programs – including the Fed’s traditional backstop lending program, known as the ‘discount window’ – while below the peak recorded in March, remains elevated and has been trending moderately higher in recent weeks. This is a sign that the recent banking stress lingers and has yet to meaningfully abate.
Bottom Line
The fundamentals of the commercial office market remain weak and are unlikely to experience a meaningful turnaround anytime soon. Between the latter weighing on revenues generated by office properties, a higher interest rate environment, and tightening CRE lending standards, there’s little doubt that we will see more office loans default in the year ahead. Emerging signs of stress in the CMBS space second this view. One source that has put numbers on paper, estimates that about a fifth of office loans will default, with cumulative losses totaling just over $80 billion. However, because of the many moving parts at play, there’s a great deal of uncertainty with such estimates. Some elements, such as the fact that a substantial amount of office loans in the tens of billions of dollars are coming up for renewal in a tough financing environment, increase the risks of large defaults. Others, like the important steps taken by the Fed to ensure that there’s ample liquidity in the financial system, work as mitigating factors. Ultimately, because of the potential for large defaults, some losses among lenders, and negative spillovers to financial markets, the office sector – this particularly weak corner of the CRE market – will continue to bear careful watching.
Appendix
Table 1: Increase in Office Vacancy Rate Varies by Market
| %, Office CRE Vacancy Rate | Pre-pandemic | Latest* | Increase |
| Q4-2019 | Q1-2023 | % Chg. | |
| National | 9.5 | 12.9 | 36% |
| Houston - TX | 16.1 | 19.0 | 18% |
| Dallas-Fort Worth - TX | 14.8 | 17.8 | 21% |
| San Francisco - CA | 6.0 | 17.2 | 186% |
| Washington - DC | 12.5 | 15.7 | 25% |
| Chicago - IL | 12.1 | 15.5 | 28% |
| Austin - TX | 8.5 | 15.4 | 82% |
| Denver - CO | 9.7 | 15.2 | 57% |
| Phoenix - AZ | 11.4 | 15.1 | 33% |
| Los Angeles - CA | 10.3 | 14.9 | 44% |
| Atlanta - GA | 11.5 | 14.1 | 22% |
| Northern New Jersey | 10.9 | 14.0 | 28% |
| Orange County - CA | 9.6 | 13.2 | 37% |
| New York - NY | 8.1 | 12.8 | 57% |
| East Bay - CA | 8.2 | 12.5 | 52% |
| Charlotte - NC | 7.3 | 12.4 | 70% |
| San Jose - CA | 9.2 | 12.3 | 34% |
| Detroit - MI | 9.5 | 12.2 | 29% |
| Portland - OR | 6.9 | 12.1 | 74% |
| Baltimore - MD | 10.3 | 11.7 | 13% |
| Seattle - WA | 5.6 | 11.3 | 102% |
| Kansas City - MO | 6.9 | 11.2 | 61% |
| Pittsburgh - PA | 7.5 | 11.1 | 47% |
| San Diego - CA | 9.2 | 10.9 | 19% |
| Minneapolis - MN | 7.8 | 10.9 | 40% |
| Philadelphia - PA | 8.2 | 10.5 | 28% |
| Columbus - OH | 6.9 | 10.5 | 53% |
| Boston - MA | 6.8 | 10.4 | 51% |
| Saint Louis - MO | 7.2 | 10.3 | 42% |
| Tampa - FL | 7.3 | 9.2 | 26% |
| Miami - FL | 8.2 | 9.1 | 11% |
End Notes
- Cushman & Wakefield (Q1 2023) see here; JLL see here.
- Kastle Systems Back to Work Barometer, see here.
- WFH Research, see here.
- See article here; see also Cohen & Steers report here.
- Trepp, CMBS delinquency rates, April 2023 here, special servicing rate, April 2023 here.
- JP Morgan, “Stressing Banks, Insurance and REITs for CRE Weakness”, March 2023 here.
- See Cohen & Steers report here; also view Exhibit 8 for “effective” LTV ratios over last few years using an initial LTV ratio of 50%.
- Federal Reserve data tracking deposits at small domestically chartered commercial banks shows a moderate turnaround in the two weeks ending on April 5th, 2023; see here.
- Federal Reserve, Assets and Liabilities of Commercial Banks in the United States - H.8, here. “ Small domestically chartered commercial banks are defined as all domestically chartered commercial banks not included in the top 25.”
Disclaimer
This report is provided by TD Economics. It is for informational and educational purposes only as of the date of writing, and may not be appropriate for other purposes. The views and opinions expressed may change at any time based on market or other conditions and may not come to pass. This material is not intended to be relied upon as investment advice or recommendations, does not constitute a solicitation to buy or sell securities and should not be considered specific legal, investment or tax advice. The report does not provide material information about the business and affairs of TD Bank Group and the members of TD Economics are not spokespersons for TD Bank Group with respect to its business and affairs. The information contained in this report has been drawn from sources believed to be reliable, but is not guaranteed to be accurate or complete. This report contains economic analysis and views, including about future economic and financial markets performance. These are based on certain assumptions and other factors, and are subject to inherent risks and uncertainties. The actual outcome may be materially different. The Toronto-Dominion Bank and its affiliates and related entities that comprise the TD Bank Group are not liable for any errors or omissions in the information, analysis or views contained in this report, or for any loss or damage suffered.
Download
Share: