New Versus Existing U.S. Home Prices: Why the Divergence?
Admir Kolaj, Economist | 416-944-6318
Date Published: January 16, 2024
- Category:
- US
- Real Estate
- Consumer
Highlights
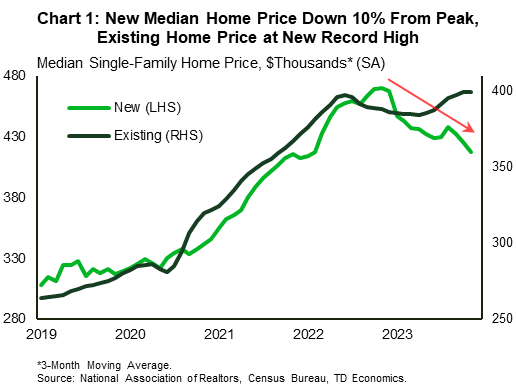
- Prices for existing homes, which make up the bulk of housing activity and tend to drive headlines, have been on the rise again for a few months now, recently eclipsing their pandemic peak. But prices for new homes, which make up a much smaller share of the sales pie, continue to trend lower, with the median single-family home price having fallen more than 10% from its peak at the end of 2022.
- These diverging price performances are the result of very different supply backdrops in each respective market, but several other post-pandemic forces are also at play.
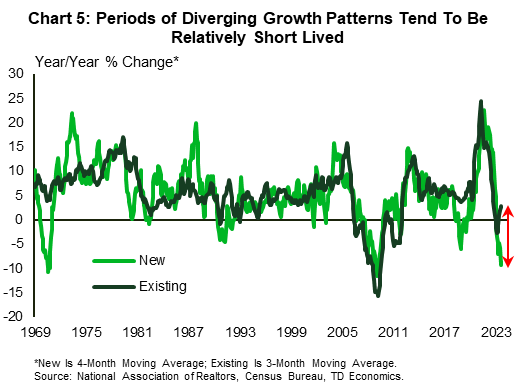
- History would suggest that these periods of divergence tend to be relatively short lived. But, given the amount of new home inventory at hand and some more supply in the pipeline, builders are likely to continue unloading new homes with a bit of a discount compared to the top-dollar prices recorded earlier in the pandemic. An easing in mortgage rates should bring some more existing inventory to market, but we still expect the resale market to remain comparatively tighter. As such, the underperformance in new home price growth vis-à-vis existing is likely to continue for a few more quarters, even as we see scope for existing home prices to also give back some ground this year.
Mortgage rates are down by about 125 basis points from their cyclical peak in mid-October, but a prevailing mortgage rate 6.7% is still among the highest levels recorded in the last two and a half decades. This higher rate environment continues to take a toll on housing activity, with the resale market bearing the brunt of the adjustment. Existing home sales are down roughly 30% from their 2019 pre-pandemic level and 7% from year-ago levels as of November. New home sales have not escaped unscathed, but have held up much better, with the sales activity much closer to its pre-pandemic average and up modestly on a year-ago basis. However, when we look at price metrics, a juxtaposed picture emerges, with existing home prices outperforming new home prices in the post-pandemic period.
After falling by a modest 3.5% following the start of the Fed’s aggressive hiking cycle, the median existing home price has been on the rise again, slightly eclipsing its pandemic peak recently (Chart 1). A host of other indicators, including the popular S&P CoreLogic Case-Shiller home price index, confirm the theme of home prices rising to a new all-time high recently. In comparison, the median price for new single-family homes has continued to trend lower, falling by more than 10% from its pandemic peak at the end of 2022.
Build It and They Will Come
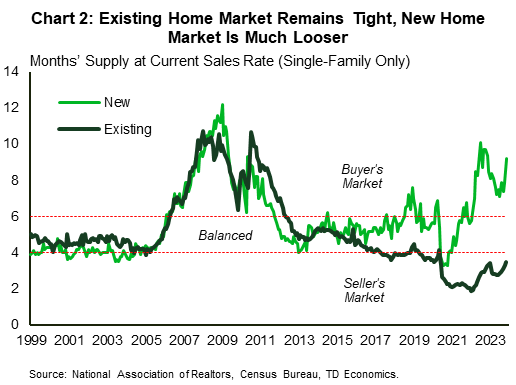
While the new home market is smaller relative to the resale market, accounting for 10-14% of total single-family sales over the last several years, it is currently much looser than the resale market. Indeed, the months’ supply of inventory for new homes stands at 9.2, which is much higher compared to 3.5 months for the existing home market (Chart 2). These supply dynamics can help explain a large part of the price divergence, given that the looser a market is, the softer the price performance tends to be.
Motivated Builder-Sellers vs. Unmotivated Homeowner-Sellers
The sellers in the new home market represent businesses whose goal is to maximize profits. This goal may not necessarily be achieved by demanding peak prices and holding inventory for long periods of time. Instead, by lowering the price somewhat, builders can more readily move inventory, thus minimizing carrying costs. Price cuts are just one of several strategies employed by builders to keep inventory moving. According to the National Association of Home Builders (NAHB), roughly 60% of builders were offering some sort of incentive at the end of last year, with popular options besides price cuts including the payment of closing costs, upgrades at no or reduced costs, and mortgage rate buydowns. The latter – a financing measure employed by the builder to lower a buyer’s mortgage rate either temporarily or permanently – is deemed to be a very effective measure in today’s market, given the challenges posed by the elevated interest rate environment.
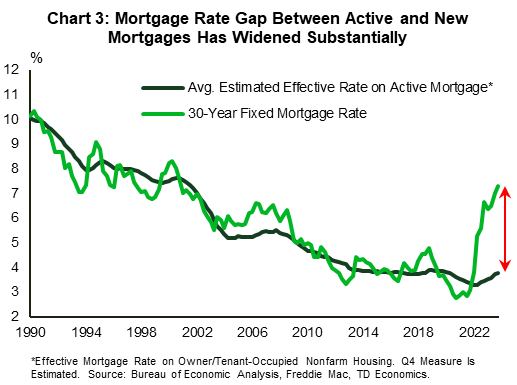
Priorities for individual homeowner sellers may be different. Individual sellers often have only one home and need to maximize the return by demanding top dollar. The fact that they’ve had little need, and little incentive to sell their homes has helped them keep a firmer hold on prices. When it comes to forced selling, a healthy labor market and the prevalence of long-term fixed mortgage terms are two key elements that have helped keep this trend at a minimum so far this cycle. As data from the NY Fed shows, the share of seriously delinquent mortgages is still well below its pre-pandemic level (see pg. 12 here for more). In addition, there has been little ‘incentive’ to sell because a dearth of inventory would make it challenging to find the next home to live in, and because moving now would mean facing a much higher mortgage rate on the next home. Note that the typical 30-year mortgage rate averaged 7.3% last quarter, while the effective rate on mortgages negotiated at some point in the past was estimated to be around 3.9% – making for a stark difference of at least 230 basis points (Chart 3).
One final point is that existing owners may also be slower to adjust to market dynamics than builders. Emotional considerations tend to play a role with this group; for example, the stubbornness to try and sell their property as much as their neighbor did some time ago when the market may have been on much stronger footing. In contrast, builder strategy would largely leave out the emotional aspect, relying much more heavily on financial calculations and forecasts. Given all the above, the divergence in the price performance of new and existing homes that has developed over the past year is not entirely unusual.
Post-pandemic Dynamics Also Playing a Part
At this point in the post-pandemic cycle, close to 60% of those employed are back working fully on-site, while the share of hybrid-remote workers has stabilized to around 30%. On the other hand, only 12% of workers are fully remote (see pg. 12 here). The latter can work from (and can purchase a home) anywhere, including further out in the suburbs and exurbs, where housing costs are lower and new developments are more common. However, most workers, such as those fully on-site or hybrid, would generally be geared to purchase a home within some proximity of central business districts, to allow for more manageable commutes. This limitation has likely geared this larger group more heavily toward the resale market – given that the closer one is located to a central business district, the higher the concentration of existing homes. We believe that this has likely been another factor working in favor of existing home prices of late.
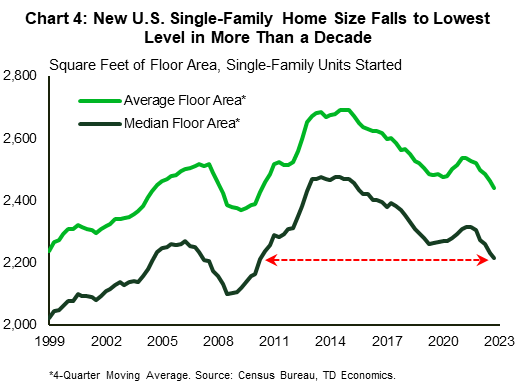
Another important aspect contributing to the lower price of new homes is the fact that builders have been focusing on smaller-sized structures. Initially, the pandemic led builders to gear toward larger homes in 2021 as people were spending more time indoors and required more space to use as an office, a gym etc.. But, that trend subsequently faded with the pandemic and the Fed’s aggressive tightening cycle, and the floor area of homes being started has now fallen to the lowest level in more than a decade (Chart 4). Generally, the smaller the home, the cheaper the price.
Similarly, builders may be in a more manageable position to offer somewhat lower prices compared to earlier in the pandemic, given that there has been an easing in some key material costs. While some material costs are still rising, the price of gypsum, steel mill products, and softwood lumber have generally trended lower recently (see here). The change in lumber prices, a key material in the construction of single-family homes, is quite notable. After topping $1,680 dollars per 1000 board feet in the spring of 2021 and subsequently $1,400 in early 2022, lumber prices are now sitting near $560 – a major decline from the pandemic peaks and only a little higher compared to the pre-pandemic period ($450). Overall, the savings from the pullback in the price of lumber and other materials can help offset rising costs elsewhere, and may allow builders to adjust new home prices down moderately, without significantly hurting their bottom line.
Can this Divergence Last?
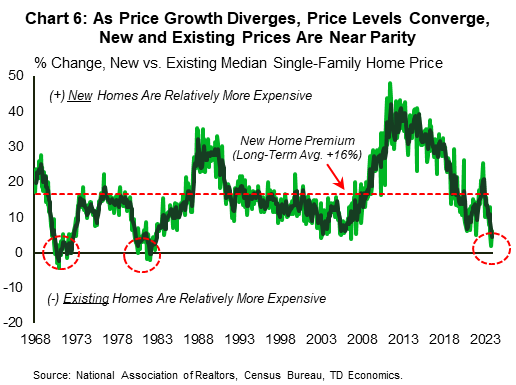
Historical performances show that these diverging price performances cannot be sustained indefinitely (Chart 5). Over the last six decades, new homes have typically commanded a premium of 16% over existing homes. That premium has now shrunk to near zero. Historical patterns show that periods of new and existing homes prices being at or near parity (defined here as +/- 4%), don’t tend to last very long, extending anywhere from 3 quarters and a maximum of 8 quarters (see Chart 6, highlighting previous examples beginning in year 1970 and 1980). Ultimately, market forces tend to lift the prices of new homes – which are viewed as a comparatively higher quality product – somewhat above the price of existing homes.
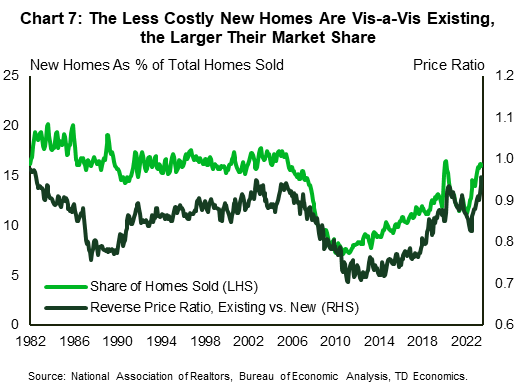
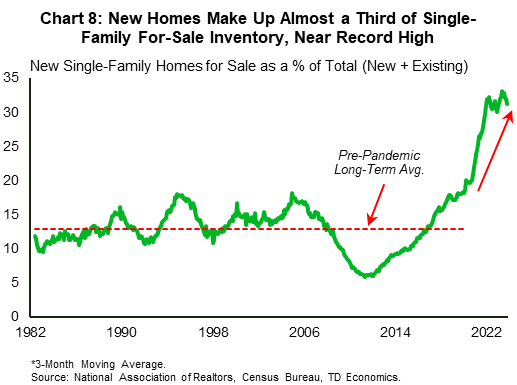
It’s interesting to note that the lower the new home premium vis-à-vis existing homes, the larger the sales market share grabbed by the new home market (Chart 7). This share is likely to remain elevated given that new homes currently make up a much larger portion of total for-sale inventory than at any other point in the past. Over the last several decades, new home inventories have made up less than 15% of single-family homes available for sale, on average, but now they make up close to a third of the entire pool (Chart 8). Builders will need to unload this inventory, and may continue to do so with the help of moderate price cuts and other incentives.
With the Fed signaling that rate cuts are coming this year, we anticipate mortgage rates to head moderately lower from here on out – albeit from elevated levels – with our forecast calling for the 30-year fixed rate to end 2024 at just below 6%. This expected pullback in interest rates should diminish the gap between active mortgages and those to be taken on a next property, gradually incentivizing more owners to put their homes on the market. Still, given that we’re starting from a low base (refer back to Chart 2), we expect the resale market to remain comparatively tighter to the new home market over the next several quarters. This means that while we also see scope for existing home price growth to slow and dip into shallow negative territory this year alongside a softening in the labor market (see our forecast here), a notable gap in the two growth measures as shown in chart 5, is likely to persist for at least a few more quarters. In practical terms, an underperformance in new home price growth vis-à-vis existing, even as the latter is also expected to give back some ground, means that new and existing home prices are likely to continue hovering near parity for much of this year, before market forces eventually begin to pull new home prices above existing home prices and widen the new home premium to more typical levels.
Bottom line
Very different supply backdrops combined with several other post-pandemic forces have all been key factors leading to a significant divergence in price growth patterns across the new and existing home market. History would suggest that these periods of divergence tend to be relatively short lived. But, given the amount of new home inventory at hand and the fact that there’s more supply in the pipeline, builders may continue to unload new homes with a bit of a discount compared to the top-dollar prices earlier in the pandemic. What’s more, while we expect an easing in mortgage rates to incentivize more owners to put their properties on the market this year, we expect the resale market to remain comparatively tighter to the new home market. In this vein, the underperformance in new home price growth vis-à-vis existing is likely to continue for a few more quarters, even as we see scope for existing home prices to also give back some ground this year.
This report is provided by TD Economics. It is for informational and educational purposes only as of the date of writing, and may not be appropriate for other purposes. The views and opinions expressed may change at any time based on market or other conditions and may not come to pass. This material is not intended to be relied upon as investment advice or recommendations, does not constitute a solicitation to buy or sell securities and should not be considered specific legal, investment or tax advice. The report does not provide material information about the business and affairs of TD Bank Group and the members of TD Economics are not spokespersons for TD Bank Group with respect to its business and affairs. The information contained in this report has been drawn from sources believed to be reliable, but is not guaranteed to be accurate or complete. This report contains economic analysis and views, including about future economic and financial markets performance. These are based on certain assumptions and other factors, and are subject to inherent risks and uncertainties. The actual outcome may be materially different. The Toronto-Dominion Bank and its affiliates and related entities that comprise the TD Bank Group are not liable for any errors or omissions in the information, analysis or views contained in this report, or for any loss or damage suffered.
Download
Share: