Market Insight:
The Fed’s Drive to Survive
Beata Caranci, SVP & Chief Economist | 416-982-8067
James Orlando, CFA, Director & Senior Economist | 416-413-3180
Date Published: April 13, 2023
- Category:
- US
- Forecasts
- Financial Markets
Highlights
- Similar to a Formula One driver, central banks need to find the right balance of speed, control, and strategy to cross the finish line without rolling over the economy.
- A strong tailwind from inflation and employment has kept the Fed biased towards tightening monetary policy, but leading indicators are starting to point to some obstacles on the road.
- The Fed should pause after its next meeting to ensure it doesn’t put too much pressure on the economy.
Binge watching shows on Netflix doesn’t usually help us understand the challenges facing central banks, but the Formula One (F1) docuseries, Drive to Survive, offered some insights. F1 drivers will push the limits of mechanical engineering to win a race. Their supercharged cars average a maximum speed of 220 miles per hour (mph). But despite all the metrics at their disposal, most drivers don’t rely on speedometers. That’s because winning involves more than maximizing the speedometer. The driver must find the perfect balance of speed, control, and strategy.
The same concepts apply to the Federal Reserve. It has already achieved speed with the 475 basis points (bps) in interest rate hikes over the last year. The downshift to smaller increments of 25 basis points over the last two meetings in the face of still-high inflation demonstrates some element of control. Now the question is whether they’ve got the right strategy to not crash and burn the economy. With the smell of burning rubber wafting up from stress among regional banks, will the Fed push the limit on what the economy can handle or take a pit stop?
Hitting its limits
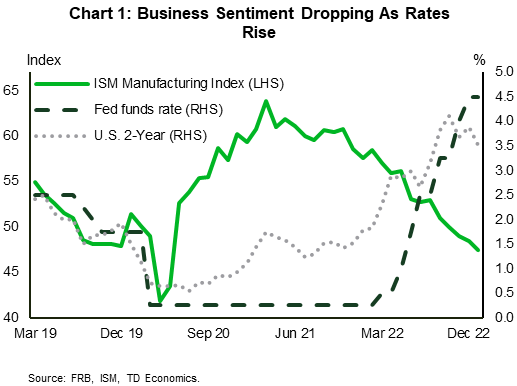
Leading economic indicators are signaling that the U.S. economy may be approaching its limits. The ISM manufacturing index has been a reliable historical indicator in predicting economic slowdowns, or outright recessions. Business sentiment has steadily declined since interest rates began rising more than a year ago (Chart 1). Initially, it was coming off lofty levels, but it moved into contractionary territory five months ago and hasn’t yet found a bottom. Although a rapid downshift in the new orders subindex (currently at 44.3) was the first signal that momentum had turned, that negative sentiment has now bled broadly into all areas of the survey.
Concern over the economy’s engine could be contained if not for some clanking now also coming from the service side. This ISM index is sitting just a hair above the break-even 50 threshold and has shown some uncharacteristic volatility in recent months. Not surprisingly, our TD Leading Economic Index is waving a yellow flag, signaling that the economy is at risk of stalling within the next three-to-six months.
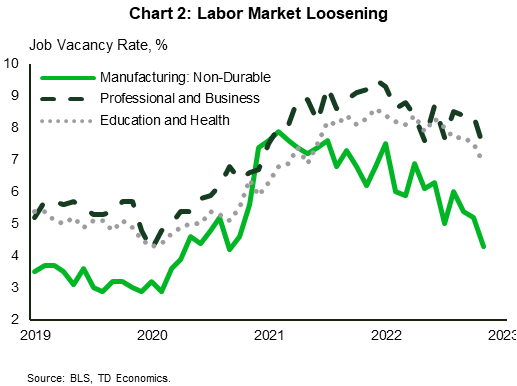
That caution is also showing up in the employment statistics. Yes, you read that right. The jobs market is softening. Sure, the economy clocked in 236k new jobs in March, but the engine is rattling under the hood. Fewer sectors are behind the thrust of new hiring. Three-quarters of those jobs were created by just three sectors – hospitality, government, and health/education. This reinforced a theme that appeared in prior months that a smaller group of sectors were contributing to the top-line job figures. In addition, the track is shortening for two of those sectors – hospitality and government. We have been flagging these sectors for about six months as being among the remaining few to reflect the final legacy of the pandemic. Both sectors were climbing out of a deep deficit in employment. As a result, these two sectors have accounted for an abnormally large job impulse that has boosted the headline figure and obscured the fact that the broader economy is not showing the same eagerness to hire. We estimate that the hiring impulse from this narrow group of employers will be nearing exhaustion within the next couple of months, setting up a pivot point in the summer months. Job vacancy data offer some validation. Many sectors are already scaling back job postings (Chart 2). Given that the labor market is a highly lagging indicator, when there’s smoke, it could be just a matter of time before fire appears.
By placing a strong emphasis on the labor market to justify ongoing rate hikes, there’s valid concern that a strong pace of job hiring risks reigniting consumer spending and inflation. However, the job market is a well-established lagging indicator. Looking in the rear-view mirror while driving forward carries its own risks, particularly when obstacles are starting to appear along that path. The central bank must be mindful of the two-sided nature of risks.
And those regional banks
Smoke has also emerged within the banking system. The failure of SVB, Signature, and Credit Suisse are largely a byproduct of mismanagement, but the rising interest rate environment amplified those outcomes by reducing the market value of bank assets and squeezing liquidity in situations where interest rate risk hadn’t been appropriately managed. Were those banks isolated anomalies, or canaries in the coal mine of other interest rate risks lying in wait?
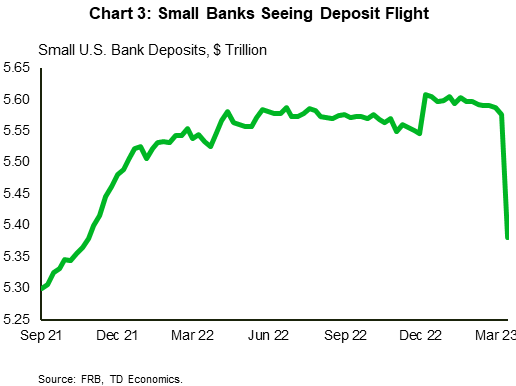
Market participants usually don’t wait around to find out the answer. Even though the Fed, FDIC, and U.S. Treasury have responded with safeguards, consumers and businesses have stripped a significant amount of deposits out of regional banks (Chart 3). At the very least, this should lead to some tightening of credit lending standards, particularly among those concerned over the stability of the deposit base and potentially tighter bank regulation. According to the Fed, small banks make up about one-third of industrial and commercial loans and about one-half of real estate loans.
Bank lending standards were already tightening prior to recent events due to higher interest rates raising the cost of funding and pushing up delinquency rates. In the Fed’s Senior Loan Officer Survey, 43% of lenders reported tightened standards. This survey was completed prior to the failure of those banks and marks a huge shift from last summer when lenders were not tightening at all.
Equities cheering, but the bond market crew is calling for a pit stop
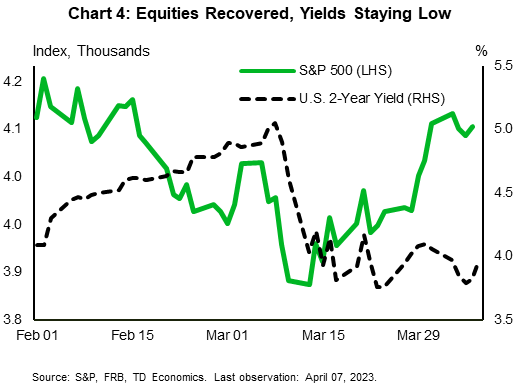
Financial markets appear to be of two minds right now (Chart 4). On one side, equity markets are bouncing off their lows. The S&P 500 is trading just shy of its 2023 high, even with the regional bank stock index sputtering at a floor established in mid-March. This deviation signals a belief that the regional bank risk has been successfully ring-fenced, limiting contagion to the rest of the economy.
The bond market has a different view. The U.S. 2-year Treasury yield is hovering around 4%, marking a significant retracement from the March high of 5.05%. Markets think the Fed will need to stop hiking after the next meeting in May, and quickly reverse course with rate cuts as early as September. Bond markets are clearly focused on the risks to the outlook, evidenced by the Treasury volatility index sitting at more than double its average of the last decade. Meanwhile, the equity market volatility index is calmly back to its historical average.
Which is the more likely path? We think the answer rests in between these two extremes. It would be unusual for the Federal Reserve to cut rates just four months following its final hike. The average timeline is between six and twelve months, and typically against a much lower inflation backdrop. The Federal Reserve would need to be strongly convinced that inflation was not just trending towards their 2% target, but that the economic backdrop can sustain it there. This places the likely timing for the first rate cut to materialize in the timeframe of Q4 2023 to Q1 2024, at the earliest.
Disclaimer
This report is provided by TD Economics. It is for informational and educational purposes only as of the date of writing, and may not be appropriate for other purposes. The views and opinions expressed may change at any time based on market or other conditions and may not come to pass. This material is not intended to be relied upon as investment advice or recommendations, does not constitute a solicitation to buy or sell securities and should not be considered specific legal, investment or tax advice. The report does not provide material information about the business and affairs of TD Bank Group and the members of TD Economics are not spokespersons for TD Bank Group with respect to its business and affairs. The information contained in this report has been drawn from sources believed to be reliable, but is not guaranteed to be accurate or complete. This report contains economic analysis and views, including about future economic and financial markets performance. These are based on certain assumptions and other factors, and are subject to inherent risks and uncertainties. The actual outcome may be materially different. The Toronto-Dominion Bank and its affiliates and related entities that comprise the TD Bank Group are not liable for any errors or omissions in the information, analysis or views contained in this report, or for any loss or damage suffered.