U.S. Payrolls:
Too Hot or Just Right?
Thomas Feltmate, Director & Senior Economist | 416-944-5730
Date Published: February 2, 2023
- Category:
- US
- Financial Markets
Highlights
- U.S. payrolls rose by 4.5 million in 2022, more than double the pace of job growth experienced in 2019. While hiring
slowed sequentially through the year, it still expanded by 247,000 jobs per-month through the last three months of 2022
– nearly 2.5 times what’s required to meet trend growth in the labor force. - The strength through the latter half of last year seems to be at odds with many other soft economic indicators – suggesting payrolls may be overstating some degree of strength in the labor market.
- This could be the result of the Bureau of Labor Statistics estimates of birth-death firm creation potentially overestimating the number of new establishments formed. However, we won’t know for sure until August, when the BLS releases
2023 preliminary benchmark revisions. - Over the coming months, we expect the pace of hiring to slow considerably as economic growth slips to a stall speed. The
unemployment rate is expected to rise by 1.5 percentage points, peaking around 5% in mid-2024.
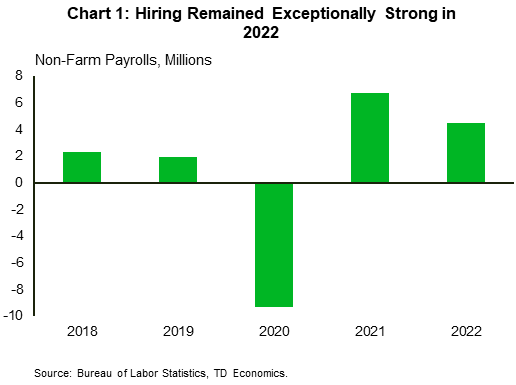
The U.S. labor market showed tremendous strength from start to finish last year. Perhaps no statistic better captures this point than non-farm payrolls, which rose by a whopping 4.5 million or an average of 375k jobs per-month in 2022 (Chart 1). This is more than twice the pace of job growth experienced in 2019, which is an impressive feat given that the economy had recovered all the jobs lost during the pandemic by mid-year. While payroll growth did slow in the second half of 2022, it continued to run well ahead of what’s required to meet growth in the labor force – closer to 100k jobs per-month – and consistently surpassed expectations in nearly every month last year. So, what gives? Has the post-pandemic U.S. economy become a job creating machine, or is there perhaps some estimation error underneath the surface that may be overstating the recent strength in payrolls. More importantly, what does the crystal ball hold for 2023? These are the questions we’ll tackle in this report.
Running Too Hot? Other Data Suggests So
Economists can only be fooled so many times before they begin asking questions. And last year’s payrolls have certainly delivered no shortage of surprises. In fact, 9 of the 12 employment reports released in 2022 all meaningfully exceeded the consensus forecast. Indeed, economic data rarely comes in spot on expectations, but to consistently miss in one direction suggests something could be amiss.
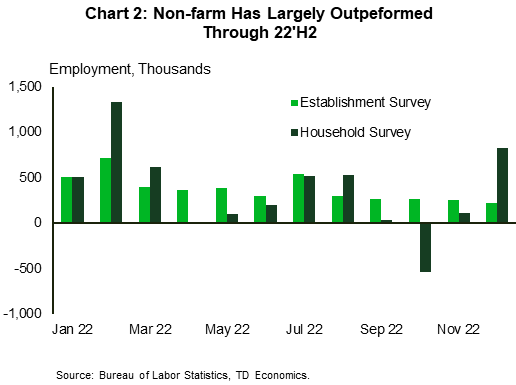
Perhaps the most compelling argument lies within the comparison to other measures of employment. Looking at the household survey – used in the calculation of the unemployment rate – and adjusting for a like methodology to the establishment survey shows employment gains through the second half of last year averaged 246k per-month, or roughly 60k jobs per-month less than what was suggested by the non-farm measure (Chart 2). Doing the same comparison to ADP private payrolls and comparing to non-farm private employment shows a similar differential, with the latter outperforming by approximately 50k jobs per-month through the second half of last year.
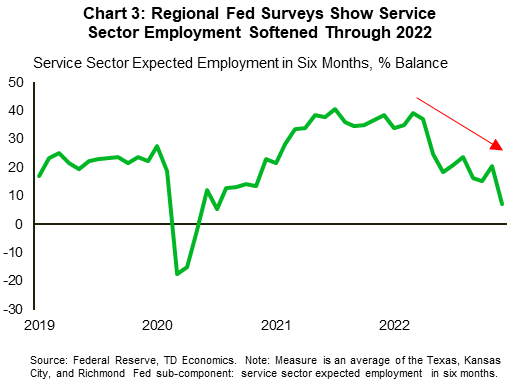
There are also growing differences between what other “soft” economic indicators are saying versus what’s showing up in the hiring numbers. For example, the employment sub-component of both the ISM manufacturing and service sector surveys have trended lower in recent months, with the latter flipping into contractionary territory in December. Other regional Federal Reserve surveys have shown similar weakness in recent months (Chart 3). Meanwhile, a separate survey conducted by the National Federation of Small Independent Businesses has shown that the number of firms planning to increase employment has steadily trended lower through 2022 – albeit from elevated levels – and is now slightly below pre-pandemic levels.
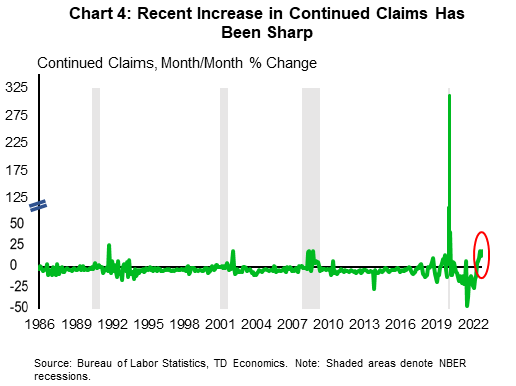
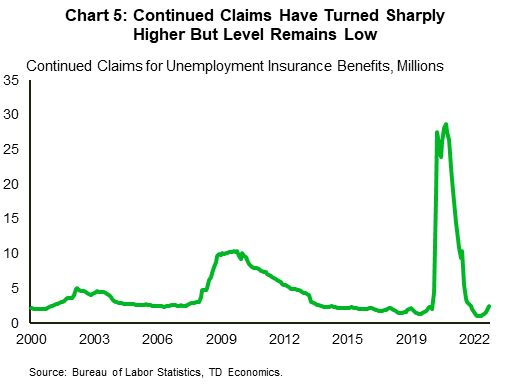
Then there’s the argument on continued claims. Despite initial jobless claims having trended lower over the past month and a half, continued claims – the number of people who have already filed an initial claim and have experienced a week of unemployment – has turned sharply higher. The increase in the month-on-month change has been stark (Chart 4). Looking over history, any time there has been such a sharp increase in continued claims, the economy has subsequently fallen into a recession. Indeed, we need to be careful when interpreting these “large” month-on-month moves as it is coming from a low base (Chart 5). Continued claims have only recently surpassed December 2019 levels, so it’s hard to say whether the recent turn higher is related to normalization dynamics or an inflection point. However, the fact that the median duration of unemployment has been on the rise, at a time when hours worked have been declining and the number multiple job holders has recently returned to pre-pandemic levels suggests the labor market is in fact cooling faster than payrolls may suggest.
Methodology Adjustments Could Hold the Answer
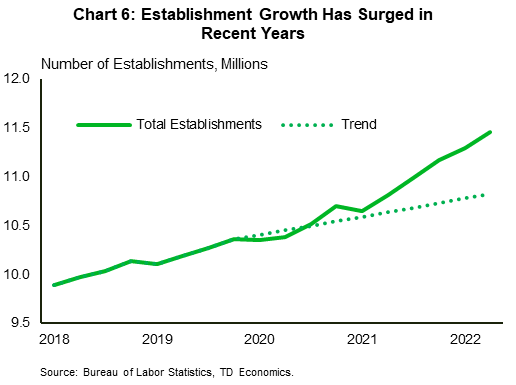
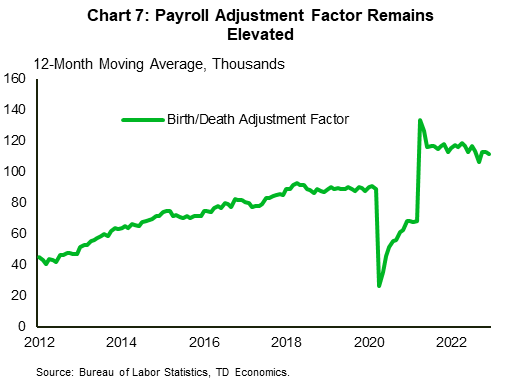
Looking beyond the observable and focusing on the methodology of how the monthly establishment survey numbers are constructed provides some insight on why payrolls may be overstating the degree of strength. Each month, the Bureau of Labor Statistics (BLS) surveys from a sample of 131,000 businesses and government agencies, which represents about one-third of all non-farm workers. This sample gives a good starting point for hiring activity on the month, but a well-known limitation is the inability to capture the impact from new business formations that may have occurred. This is because the sample frame is built from quarterly unemployment insurance tax records, and updates to firm “births” and “deaths” occur with a lag – only becoming available 7-9 months after the reporting month. As a result, the BLS uses data from the Quarterly Census of Employment and Wages survey to forecast a birth-death adjustment factor which is then overlaid on the sample estimate. However, this technique comes with its own limitations. Because the birth-death adjustment factor is estimated using lagged firm establishment data, the forecasts run the risk of missing turning points. This is particularly true in the current environment. Chart 6 shows how the number of total establishments has increased since 2021, which has led to a sharp increase in the “birth-death” adjustment factor (Chart 7). While the estimated adjustments for 2021 and early-2022 may be closer to what was actually occurring, the degree of strength through the second half of 2022 could be somewhat overstated – biasing the payrolls numbers higher.
Benchmarking Revisions Could Provide Insight, But Won’t Happen until August
Accompanying the January payroll figures, the BLS will also release its annual benchmark revisions for 2022. The benchmarking aims to better align its national employment count with state unemployment insurance tax records. Based on data released by the BLS back in August, the annual revisions for this year will show March payrolls revised higher by 462,000 or 0.3% – implying a stronger pace of employment through 2021 and early-2022. However, the revisions will not provide any insight on what has happened since March. This will not occur until next August when the BLS releases its preliminary benchmark revisions for 2023.
While we suspect that they will likely show a softer undertone in hiring through the latter half of last year, it won’t change the underlying narrative that the labor market remains incredibly tight. This is evident across a wide swath of indicators. For example, job openings remain historically elevated, the unemployment rate sits at 50-year low, layoffs remain below 2019 levels and the degree of voluntary job switching (i.e., the quit rate) also remains elevated. Moreover, surveys of businesses as well as respondents to the Federal Reserve’s Beige Book all continue to corroborate the fact that the labor market remains tight, and finding labor is one of the biggest constraints facing firms. So while it seems likely that payrolls may have been somewhat flattered in recent months, downward revisions for the year are likely to be in the 250,000-500,000 range.
Employment Growth Poised to Slow
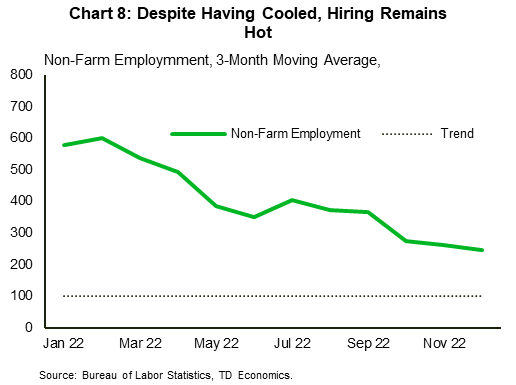
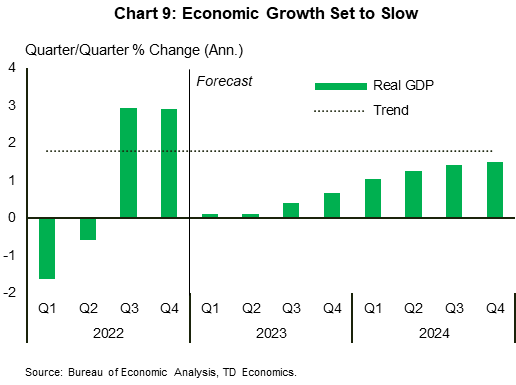
Irrespective of what the revisions hold, a substantial slowing in the pace of job growth over the coming months seems very likely. A clear pattern has already emerged through 2022, with hiring having steadily trended lower through much of last year (Chart 8). We suspect this trend will accelerate over the coming months as the cumulative impact of the Fed’s actions starts to play catch-up with the economy. Growth is set to slow from 2.9% in Q4 to a stall speed over the coming months (Chart 9). As this happens, not only will job openings turn meaningfully lower, but the number of layoffs will intensify. This will put upward pressure on the unemployment rate, which is expected to rise by 1.5 percentage points over the next year and half – reaching a peak of around 5%.
From a historical standpoint, the expected increase in the unemployment rate is relatively mild compared to prior recessions. Looking back since the post-war era and averaging across all previous downturns (excluding the 2008/09 Global Financial Crisis and 2020 Global Pandemic) shows the average trough-to-peak increase in the unemployment rate has been around three percentage points. So why the difference this time around? We think the ongoing issue of labor shortages will result in a higher degree of employee retention compared to previous economic downturns.
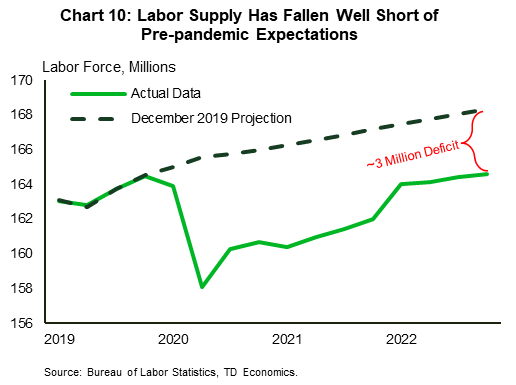
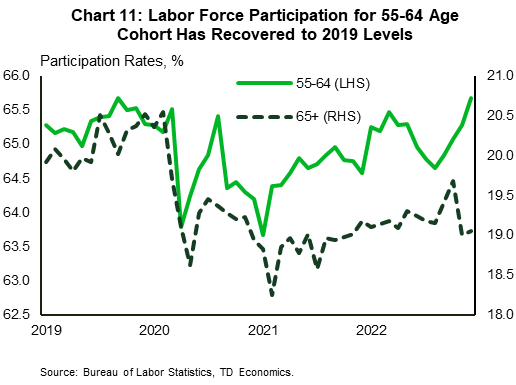
While aging demographics have long been touted as a factor set to weigh on labor supply, the pandemic made things far worse by creating a significant and persistent shortfall in the number of available workers. Comparing today’s labor force figures to both our own and the CBO’s pre-pandemic forecast shows the shortfall could be as much as 3 million workers (Chart 10). In a speech last November, Federal Reserve Chair Jerome Powell suggested that as much as two-thirds could be attributed to “excess retirements” – the number of retirees above that suggested by demographics. This certainly seems like a plausible defense given the participation rate for those 55+ remains over a full percentage point below its pre-pandemic level. However, digging deeper into the data shows labor force participation among the 55-64 age cohort having recently recovered to 2019 levels. The dearth appears to be entirely concentrated in the 65+ cohort, where demographics are also likely playing some role (Chart 11). This suggests that the number of excess retirees is likely quite a bit smaller than previously thought. That said, the pandemic had a measurable impact on both immigration and deaths, both of which are other factors that are contributing to today’s shortfall.
Outside of these more commonly quoted reasons, a recent study from a Harvard economist found there could also be a socioeconomic factor at play. Chetty et. al found that a significant number of the “missing workers” are low-wage earners who (prior to the pandemic) worked in wealthy business centers – mainly in leisure & hospitality. However, the economic uncertainty of the pandemic along with the high cost of living drove a mass exodus from these areas during the early days of COVID restrictions. While some have since returned to the labor market, Chetty et. al found that hiring among the bottom 20% of wage earners still remains well below pre-pandemic levels. Analyzing local trends, the authors conclude that these workers are the scarcest in dense urban business centers like Boston, New York and Los Angeles. Moreover, with most businesses moving to a hybrid work arrangement, many of the bars, restaurants and other related amenities are operating on reduced hours. This makes the income stream of those workers more precarious and hence why many are forgoing returning to those jobs.
As a result, hiring in leisure & hospitality remains over 4% (or 720k) below pre-pandemic levels. Historically speaking, this has typically been an industry that tends to be one of the first to shed jobs during a downturn. The same holds true for the manufacturing sector – where employment has only recently returned to pre-pandemic levels, despite job openings remaining elevated. Because employers have had such a difficult time restaffing post-pandemic, it suggests that employee retention is likely to be far greater through this coming economic slowdown. This should help stem the tide on job losses and lead to a more muted increase in the unemployment rate relative to what history would suggest.
Bottom Line
U.S. payrolls ran hot in 2022, and there’s reason to believe that some of the more recent strength through the latter half of last year may be the result of favorable adjustments stemming from the BLS’s birth-death estimates. However, we won’t know for sure until later this year when the BLS releases its 2023 preliminary benchmark revisions, which will extend back to April 2022.
Irrespective of how the data revisions settle, the labor market looks set to slow considerably in 2023. Over the coming months, we expect the cumulative effect of past rate increases to tighten its grip on the economy – pushing growth to a near stall speed and leading to an increase in the number of layoffs. The unemployment rate is set to rise by 1.5 percentage points – about half the increase experienced over past recessions – as weaker labor force participation drives increased employee retention and limits the number of job losses.
End Notes
- Bloomberg, Job Market’s 2.6M Missing People Unnerves Star Harvard Economist, January 2023
- Bureau of Labor Statistics, Technical Notes for the Current Employment Statistics Survey
- Bureau of Labor Statistics, Introduction of Quarterly Birth-Death Model Updates in the Establishment Survey
- Bureau of Labor Statistics, CES Preliminary Benchmark Announcement, August 2022
- Opportunity Insights, Economic & Employment Tracker
- Powell, J. Inflation & the Labor Market, Speech given on November 30th, 2022.
Disclaimer
This report is provided by TD Economics. It is for informational and educational purposes only as of the date of writing, and may not be appropriate for other purposes. The views and opinions expressed may change at any time based on market or other conditions and may not come to pass. This material is not intended to be relied upon as investment advice or recommendations, does not constitute a solicitation to buy or sell securities and should not be considered specific legal, investment or tax advice. The report does not provide material information about the business and affairs of TD Bank Group and the members of TD Economics are not spokespersons for TD Bank Group with respect to its business and affairs. The information contained in this report has been drawn from sources believed to be reliable, but is not guaranteed to be accurate or complete. This report contains economic analysis and views, including about future economic and financial markets performance. These are based on certain assumptions and other factors, and are subject to inherent risks and uncertainties. The actual outcome may be materially different. The Toronto-Dominion Bank and its affiliates and related entities that comprise the TD Bank Group are not liable for any errors or omissions in the information, analysis or views contained in this report, or for any loss or damage suffered.
Download
Share: