Highlights
- A steep drop in the labor force participation rate following the COVID-19 shock has left the U.S. labor force roughly three million people smaller. This despite ongoing population growth and persistent economic expansion.
- After an initial recovery as the economy reopened, the labor force participation rate has shown little movement since the summer of last year, leading many to wonder how permanent the decline may be.
- About 40% of the Americans missing from the labor force are over the age of 55 and roughly one third are older than 65. Prior to the recession, this group was a key source of labor force growth. People can and do return to the workforce from retirement, but the odds diminish with every passing year.
- Among core working age people (25 to 54), more women have left the workforce than men. The difference in participation is most notable among Americans in their late twenties.
- For young people below the age of 25, the biggest decline in participation has been among college-aged students. Changes to campus life brought on by the pandemic have likely contributed to this phenomenon.
- Teenagers are the one group of Americans with higher labor force participation rates than prior to the pandemic. It remains to be seen if this is sustained as the pandemic moves further into the rear view mirror.
One of the most striking and persistent consequences of the COVID-19 pandemic-induced downturn is its impact on the labor force. The American economy has surpassed its pre-recession peak, but the labor force is still three million people smaller than it was prior to the pandemic. The fall in the labor force is even more stark considering that the adult population (16+) has grown by two million people over that same time period.
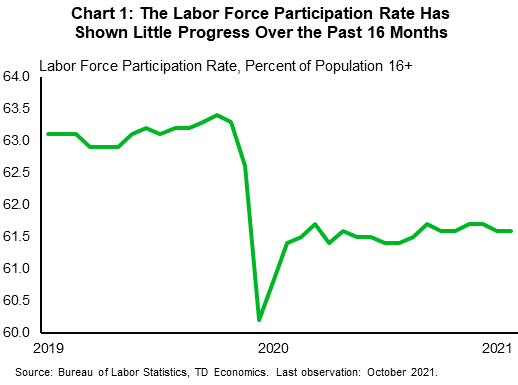
The lack of traction in labor force growth is explained by a stalling in the labor force participation rate – the share of the population 16-years and older working or actively looking for work. After plunging by over three percentage points as the economy went into lockdown in March and April of last year, the participation rate recovered just half the losses upon reopening before stalling in a tight range around its current level of 61.6% for the past sixteen months (Chart 1).
A key question for the outlook is when (and if) these missing workers will return to the labor market. In order to get a sense of the prospects for recovery in the labor force, it’s useful to understand who they are. The declines are broad based and span most major demographic groups, but deficits are relatively larger for the older population. For the core working age population (25 to 54), the gap in participation is larger for women relative to men. Gaps are especially significant for men and women in their late twenties. By educational attainment, every group has seen a noticeable drop in participation, but high school graduates without any college education have seen the biggest decline. Among younger people (16-24), the drop in participation is largest among 20 to 24 year-olds enrolled in school.
For many groups, the decline in participation rates reverses the considerable progress that was made in the tight labor market prior to the pandemic. The drop in the participation rate of older Americans, for example, is most acute among those over the age of 65. This may reflect greater health concerns as a result of the pandemic, but even as these are alleviated, the population will continue to get older and therefore less likely to participate in the job market.
While we expect labor force participation rate to rebound, it may take several years before key demographic groups return to their pre-recession levels. In the meantime, relatively little growth in the population under 65 years of age will mean labor force growth remains below historical norms.
The Pandemic Reversed Trend Of Rising Labor Force Participation Among Older Americans
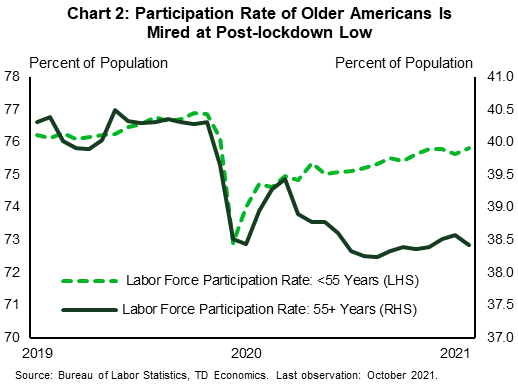
The pandemic has not been kind to older Americans. This is true health wise and with respect to the labor market. Among Americans over the age of 55, the labor force participation rate was down 1.9 percentage points as of October, compared to 1.1 percentage points for the population below (Chart 2). Population aging explains about a quarter of the decline in the participation rate of Americans over 55, but the rest is due to changes in participation rates within more granular age groups in which aging is less significant.
Digging a bit deeper, for the population between the ages of 55 to 64, declines are smaller and limited to males, but for the population over 65, both men and women have left the labor force in droves, reversing the pre-recession trend. Consequently, about one third of the roughly three million Americans missing from the labor force are over the age of 65.
The pandemic reversed a trend of increasing labor force participation among the oldest Americans. In the year before the lockdown, the labor force over 65 was its fastest growing segment, increasing by a whopping 6% percent, compared to just 0.5% in the labor force below that age. Over that time, a full 45% of the growth in the labor force was among people above the age of 65.
Most of the decline in labor force participation among older people appears to be due to increased retirement during the pandemic over and above its previous trend.1 However, people can and do move from retirement back into the workforce. Data on gross labor force flows show that people re-entering the workforce from retirement is an important source of labor force growth and that a decline in the number of people making this return explains much of the net increase in retirement during the pandemic.2
This suggests that as the labor market heats up, health concerns diminish, and fewer grandparents are taking on emergency childcare duties, more of the currently “retired” will re-enter the workforce. The question is how quickly they do so. Returning to pre-pandemic transition rates into and out of retirement, researchers at the Kansas City Fed found it would take at least two years to unwind the increase in the retirement share.3 It may take even longer for the participation rate of older Americans to move toward its pre-recession level. In the relatively hot labor market that persisted prior to the pandemic (from 2014 through 2019), the labor force participation rate of people over 65 rose by roughly 0.3 percentage points annually. At that rate, it would take at least five years to recover the decline that has taken and place and persisted over the past year and a half.
At the same time, this population continues to age, reducing the likelihood of moving back into the labor market. Over the last five years (2015 to 2020), the fastest growing segment of the population was 70-74 year-olds, over the next five it will be 75-79 year-olds. The labor force participation rate drops off significantly after 75, falling from close to 20% in the former population to under 10% in the latter.
Core Working-Age Women’s Participation Down More Than Men’s
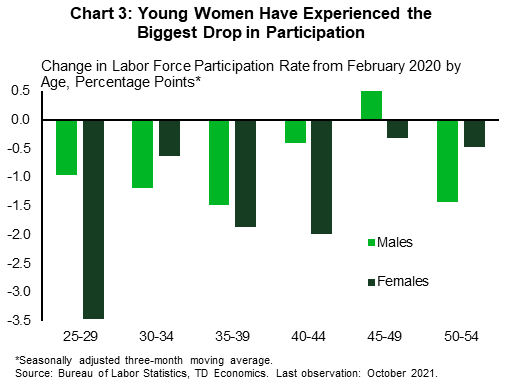
Among the senior population, the changes in participation are relatively similar between men and women. For the core working age population (25 through 54), the decline is noticeably larger for women (-1.4 percentage points) than it is for men (-1.0 percentage points). Looking under the surface, the biggest gap is by far among the youngest group (25-29). The participation rate of women between 25 and 29 is down over three percentage points, while that of men in this age group is down less than one percentage point (Chart 3).
The difference in the participation rate of women and men in their late twenties – years when people are often having their first children – has contributed to commentary that limited access to childcare during the pandemic has led to the disproportionate decline in female participation. It has had an impact, but comparing the participation rate of mothers of young children to non-mothers with the same demographic features, lower participation rate among mothers explains only a fraction of the decline.4
Another explanation of the disproportion decline in female participation is their greater exposure to employment in higher-contact occupations and industries. Women are disproportionately represented in service industries and occupations relative to men and have lost more jobs over the course of the pandemic than men have. Women make up close to 85% of the jobs in healthcare support occupations, 80% of personal care and service occupations, 75% of healthcare practitioners, and 55% of food prep and serving occupations. The greater health risks associated with these occupations likely explains some of the greater decline in female participation.
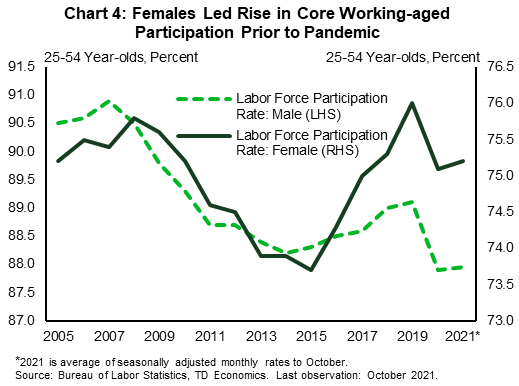
As the pandemic fades, the participation rate of core working-age women should be expected to rebound. If the pattern that existed prior to the pandemic holds, women will be faster than men to rejoin the workforce. Still, the lesson from the labor market in the aftermath of the financial crisis is that this recovery can take longer than initially hoped. For women, the core working-age participation rate did not hit a trough until 2015, more than five years into a steady jobs recovery. Once it did, the labor force participation of core-working age women rose twice as fast as that of men (Chart 4). In fact, the largest increase in participation was for women aged 25 to 29. For men, the participation rate of the same age hardly budged in the five years leading up to the pandemic, though relative to its long-run downward trend this still marked an improvement in performance.
Drop In Participation Even Among The Most Highly Educated
Labor force participation rates tend to increase with educational attainment, but looking at changes in labor force participation of people over 25, the decline has been widespread since the pandemic.
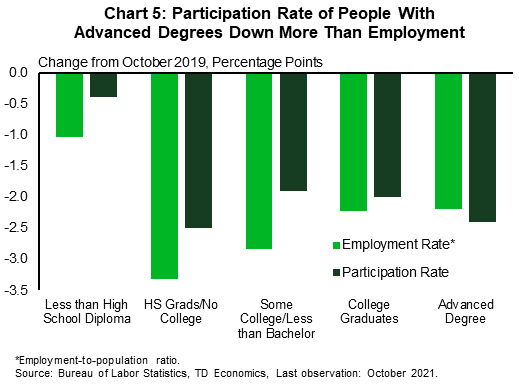
Surprisingly perhaps, participation rates have fallen noticeably even among the most highly educated – people with advanced degrees. As of October, the participation rate of people with advanced degrees was down 2.4 percentage points from the same point in 2019, roughly the same rate as people without any college education (2.5 percentage points). What makes this even more surprising is that the participation rate for this group has fallen even more than the employment-to-population ratio (Chart 5). As a result, the unemployment rate of folks with advanced degrees was just 1.6% in October, 0.2 percentage points below its level in October 2019.
Some of this decline reflects greater retirement among older Americans. Indeed, some of the excess retirement likely reflects gains in wealth and income among highly educated Americans that afforded them the opportunity to retire when the pandemic hit.
While declines in labor force participation rates have hit all levels of educational attainment, they are smallest for people without a high school diploma. The biggest decline in participation has been among people with a high school diploma but no college. The change in the participation rate of this group appears to follow employment outcomes – the employment to population ratio of high school graduates without college degrees is also down the most relative to its pre-pandemic level. This suggests that as job market opportunities increase, many of these workers will make their way back into the labor force.
College Students Have Been Slow To Return To the Workforce
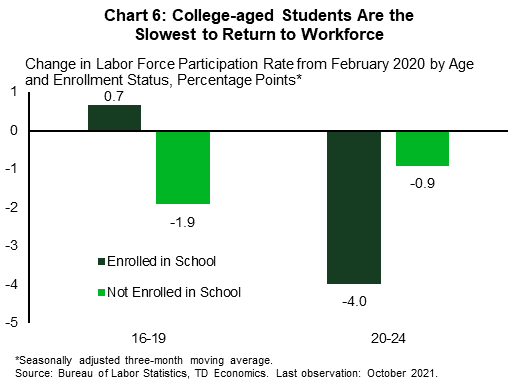
Among the population below the age of 25, the participation rate is down 0.7 percentage points relative to February 2020. All of this decline is among 20 to 24 year-olds, the participation rate of American teenagers (16-19) was 0.2 percentage points higher in October than it was prior to the pandemic, due to greater participation rate among students.5
Digging further into changes in participation between those enrolled in school and those that are not, the drop in participation among 20-24 year-olds is is considerably larger for those enrolled in school than those that are not (Chart 6).
The decline in the participation rate of students likely reflects the impact of the pandemic on student life. In 2020, post-secondary education very quickly moved from campus to the computer (and home), dissuading or disabling college students from working or looking for work. As students now make their way back to campus, the participation rate of students is slowly rebounding.
Given that young people, including college students, are more likely to be employed in higher-contact service industries, the drop in participation is also likely a symptom of the nature of pandemic. As the pandemic ebbs and regular college life resumes, many of these people appear likely to return to the workforce.
Bottom Line
One of the longer lasting impacts of the pandemic shock has been a persistent decline in the number of people participating in the labor market. How quickly these people return is a central economic question. With stronger labor force growth, wage pressures will be mitigated, reducing inflationary risks.
Digging into the data by age, educational attainment and school enrollment suggests that there is good reason to expect many of the missing workers to return to the labor force. Key to their return will be moving past the pandemic.
At the same time, the lesson of the decade following the financial crisis is that it takes a tight labor market to bring people back into the work force. The participation rate tends to lag the unemployment rate.6 It was not until several years after the shock of the 2008-2009 recession – late 2014 – that the labor force participation began to steadily trend higher. But, once it did, progression was continuous, interrupted only by the shock of economic lockdowns in early 2020.
Our baseline forecast is that it takes at least a few years to move age-specific participation back to pre-recession levels. The return of people to the workforce will temporarily counter some of the aging pressures, allowing labor force growth to accelerate in 2022. After that it is likely to resume its downward trend, caused mainly by the continued aging of the population.
End Notes
- Miguel Faria e Castro, “The COVID Retirement Boom,” Economic Synopses, No. 25, 2021. https://doi.org/10.20955/es.2021.25
- Jun Nie and Shu-Kuei X. Yang, “What Has Driven the Recent Increase in Retirements?,” KC Fed Economic Bulletin, August 11, 2021. https://www.kansascityfed.org/documents/8240/eb21NieYang0811.pdf
- Ibid.
- Furman, Jason, Melissa S. Kearney, Wilson Powell III, “The Role of Childcare Challenges in the U.S. Jobs Market Recovery During the COVID-19 Pandemic, Peterson Institute for International Economics Working Paper 21-8, June 2021. https://www.piie.com/sites/default/files/documents/wp21-8.pdf
- It could well be that some of the jobs left unfilled by college-aged students have become available to teenagers, or that with more limited extra-curricular activities available to them, teenagers have been more willing to look for and take employment.
- Hobijn, Bart and Aysegul Sahin, “Maximum Employment and the Participation Cycle,” Prepared for the 2021 Jackson Hole Economic Policy Symposium, Draft: September 4, 2021. https://www.kansascityfed.org/documents/8361/JH2021HobijnSahinKCFedVersion.pdf
Disclaimer
This report is provided by TD Economics. It is for informational and educational purposes only as of the date of writing, and may not be appropriate for other purposes. The views and opinions expressed may change at any time based on market or other conditions and may not come to pass. This material is not intended to be relied upon as investment advice or recommendations, does not constitute a solicitation to buy or sell securities and should not be considered specific legal, investment or tax advice. The report does not provide material information about the business and affairs of TD Bank Group and the members of TD Economics are not spokespersons for TD Bank Group with respect to its business and affairs. The information contained in this report has been drawn from sources believed to be reliable, but is not guaranteed to be accurate or complete. This report contains economic analysis and views, including about future economic and financial markets performance. These are based on certain assumptions and other factors, and are subject to inherent risks and uncertainties. The actual outcome may be materially different. The Toronto-Dominion Bank and its affiliates and related entities that comprise the TD Bank Group are not liable for any errors or omissions in the information, analysis or views contained in this report, or for any loss or damage suffered.
Download
Share this: