Transportation Costs to Ease, but U.S. Inflation Will Remain Elevated through 2022
James Marple, Managing Director & Senior Economist | 416-982-2557
Date Published: January 20, 2022
- Category:
- U.S.
- Forecasts
- Financial Markets
- Consumer
Highlights
- Inflation was the big surprise of 2021, coming in well above both analyst and central bank expectations.
- The mantra that price pressures are transitory has been increasingly challenged by the ongoing mismatch between supply and demand.
- Expectations for inflation to move lower hinge on supply constraints easing, especially within the transportation sector, allowing production to pickup and, goods price pressures to diminish.
- As vehicle and gasoline price gains slow, other goods and services are likely to take up some of the slack. Rents are top of the list, and more likely to accelerate than decelerate over the next several months.
- With an increasingly high-pressure economy, a higher federal funds rate and tighter financial conditions will be required to lower the temperature on inflation.
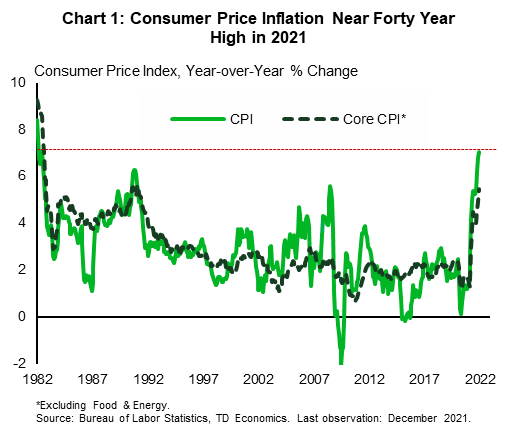
Nothing surprised economic forecasters in 2021 more than consumer price inflation. Price growth skyrocketed through the year, culminating in year-on-year growth in the U.S. Consumer Price Index (CPI) of 7.0% in December 2021 – the fastest rate in 40 years (Chart 1).
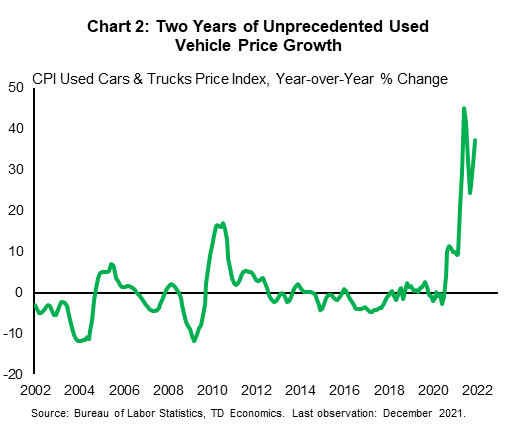
The surge in price growth has been concentrated in goods. The poster child of higher prices is the used vehicle market, where prices surged nearly 40% in 2021 and are up an unprecedented 50% over the past two years. The cost of filling up those vehicles has been similarly eye popping, up 50% in 2021 alone. Taken together, transportation costs, while accounting for less than a fifth of the consumer basket, contributed well over half of the acceleration in overall price growth in 2021.
The pandemic-related factors behind the run up in transportation costs should fade, though perhaps not as quickly as we might like, especially in light of the latest Omicron setback. However, price growth is accelerating for a wider range of items, including food, clothing and rent. One can point to idiosyncratic sources of price pressures within any of these categories, but the broadening of inflation reflects the underlying strength in demand relative to supply and will only slow as these move closer to balance.
Inflation is likely to come down in 2022 but remain above the Fed’s 2% target, providing the impetus for continued normalization in monetary policy that will extend past this year.
Vehicle Prices to Remain Elevated, but Growth Should Slow by Year End
Few things have been more impacted by the pandemic than transportation. The initial shock hit demand as much as supply. As lockdowns were introduced in the spring of 2020, flights were grounded and busy public transit systems suddenly emptied. As recovery set in, demand rebounded but also shifted toward vehicles. Supply issues, on the other hand, continued to build.
Used vehicles were the first front in this war, accelerating as soon as economic reopening started in the summer of 2020 (Chart 2). Between July and September of 2020 used vehicle prices rose over 14% (non-annualized). This initial run up in prices was unique to the used vehicle market, attributable in part to resurgent demand, but also to a drop in trade-in activity due to the months long closure of dealerships, as well as rental agencies refraining from upgrading fleets, eliminating a major source of used vehicle supply.
Over the past year, supply constraints in the new vehicle market have become more acute. Shortages of microchips and other inputs led to a steep reduction in vehicle production in 2021 and record low inventories of new vehicles. This prolonged and amplified the demand push into the used vehicle market. In 2021, used vehicle sales hit a record high of over 41 million, overtaking their pre-pandemic level. New sales on the other hand came in at just under 15 million, two million below their level prior to the pandemic.
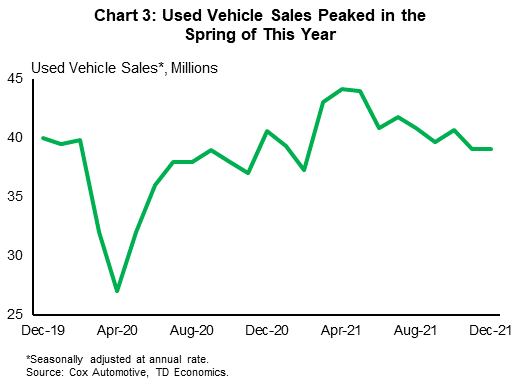
The hyperactive rise in prices looks to have weakened vehicle demand. Used vehicle sales peaked in the spring of 2021 and fell through the end of the year (Chart 3). Weaker demand should help to alleviate some of the shortages, as should a return to more normal trade-in activity and fleet deliveries. Indeed, inventories of used vehicles began to move higher in late 2021 according to Kelley Blue Book, but remain at low levels.
At the same time, auto makers plan to increase production over the course of this year. Hitting these goals will require supply chain constraints to ease. The good news is that investment has increased and automakers are increasingly partnering with chip companies in an effort to secure supply. The bad news is that it will take time – likely years – to bear fruit. In the meantime, the Omicron variant may worsen production challenges. Indeed, several automakers have recently announced plant shutdowns due to input shortages.
All told, we expect continued pressure on vehicle prices over the first half of the year, but by the second half a pickup in auto production, alongside a more stable demand environment should allow inventories to be rebuilt and prices to slow. With any luck, by the end of the year vehicles should no longer be a source of upward pressure on inflation.
Energy Prices Unlikely to Add to Inflation in 2022
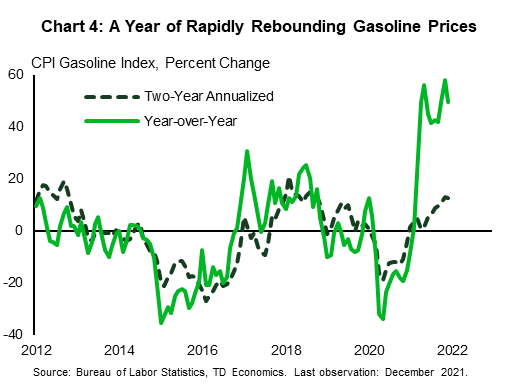
The other major contributor to price growth over the course of the past year was also transportation related. Over the course of 2021, the cost of gasoline soared, rising 50% year-on-year to December (Chart 4). Much of this was due to a higher price of oil. From a starting point under $50 a barrel, the benchmark West Texas Intermediate (WTI) oil price rose 50%, ending the year just shy of $75. The price of oil hit a peak near $85 a barrel in October before pulling back in November and December, then bouncing back again this month.
The dramatic increase in the price of oil in 2021 must be taken in the context of the previous year when it plummeted to a record low. As we move further away from this extreme shock, price dynamics should be more quiescent. While supply risks remain front and center, oil production is expected to remain on an upward trajectory across OPEC+ and North American producers in 2022. Consumption is also likely to grow, but likely not as fast as it did in 2021, providing some relief to tight markets. Overall, we expect the price of oil to end 2022 to end the year averaging $75 in the fourth quarter, slightly below the $77 it averaged in the fourth quarter of 2021. As a result, gasoline prices should also fall slightly over the course of 2021, removing this source of inflationary pressure.
Outside of oil, energy prices were also pushed higher by spiking natural gas rates, which rose in part due to a global supply crunch driven by several simultaneous shocks in Europe and Asia. Geopolitical risks remain elevated, especially in Europe, but price spikes of the magnitude observed over the past year appear less likely. At the same time, like oil, higher prices should bring on more natural gas production. We expect the Henry Hubb benchmark natural gas price to fall to $4.0 per million Btu, down from $4.8 in the final quarter of 2021. Overall, we anticipate energy prices to fall slightly in 2022, bringing the year-on year contribution to inflation from two percentage points to below zero by the end of this year.
Housing Costs Alone Will Keep Inflation Above 2%
As transportation costs cool, other components of the CPI basket are likely to continue to heat up. First and foremost among these are shelter costs. Shelter costs make up over a third of the consumer basket, so any acceleration in price growth in this area will contribute more to overall inflation.
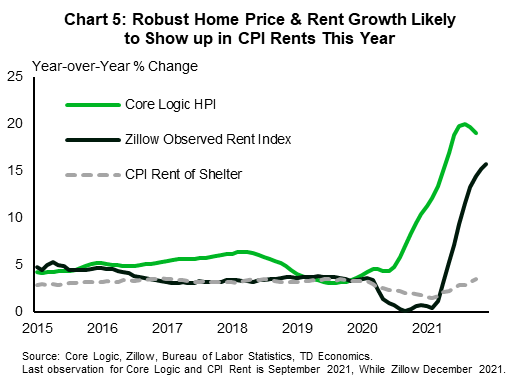
The largest component of shelter costs is rent, both among actual renters and “owners’ equivalent rent,” which captures the rent that owners would pay if they had to pay rent. Practically speaking, rents in the CPI are slow moving measures that follow home price and market-based rent measures with a lag. This suggests that the past strong run up in home prices in rents over the past year – the Core-Logic Home Price Index was up 19.1% to October, while the Zillow Observed Rent Index was up 15.7% to December – will show up in accelerated shelter costs within CPI over the next one (Chart 5).
Indeed, based on the historical relationship with home prices and rents, we anticipate CPI shelter costs to move from 4% to above 5% by mid-year. As a result, shelter costs alone will contribute over two percentage points to CPI. In other words, even if price growth for every other component of the CPI falls to zero, housing costs alone will push the Consumer Price index north of 2%.
Hot Economy Will Keep Pressure on Inflation
Of course, other areas of the consumer basket, including food, apparel, and other goods and services have also seen an acceleration in prices in recent months. The broadening of price pressures evident in recent CPI data is consistent with an economy where overall demand is running above supply.
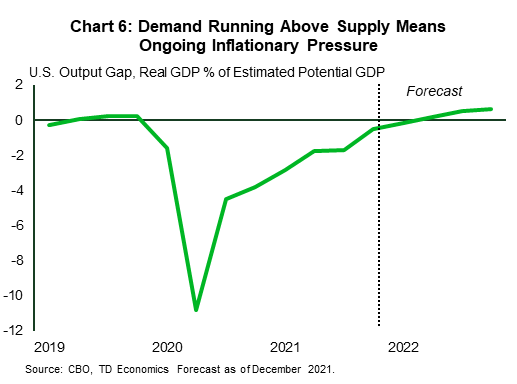
One way of showing this is the output gap, which measures actual activity (demand) relative to an estimate of the economy’s productive potential (supply). The Congressional Budget Office estimates the latter on an annual basis. Based on their most recent estimates, the American economy is roughly in balance now, but based on our expectations for economic growth it will exceed its productive potential by close to a percentage point by the end of this year (Chart 6). This suggests continued pressure on overall inflation.
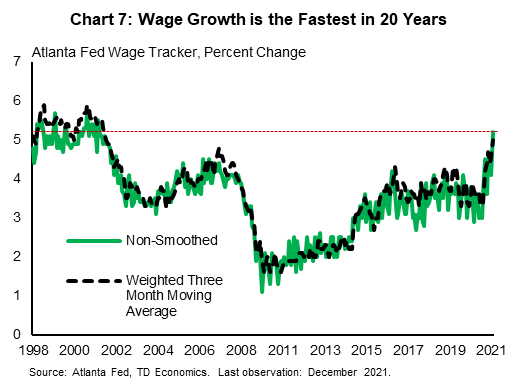
In fact, the the labor market is arguably already in “excess demand” territory. Job openings are running higher than the number of unemployed and wage growth has picked up sharply. In December, the Atlanta Wage tracker accelerated to 5%, its highest level in over 20 years (Chart 7). Given the continued mismatch between labor demand and labor supply, wage growth appears unlikely to decelerate any time soon. Over the past two decades, wage trends have not been a great predictor of inflation, but this is likely because both wages and inflation were so benign. The attention given to inflation now has sharpened the awareness of workers that their earnings are being eroded by higher prices. With solid pricing power among businesses, this raises the likelihood that the two become more intertwined, keeping the heat turned up.
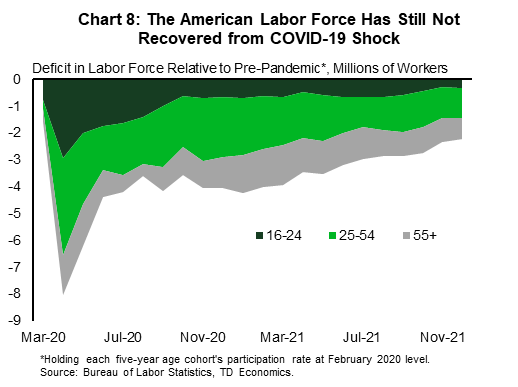
Hopefully, the strong growth in wages will help to draw people back into the labor market – the decline in the labor force participation rate of Americans of all ages since the pandemic began means that there are over two million fewer people actively participating in the labor market (Chart 8). Higher wages should bring some of these people back, but if recent history is any guide, it will not happen quickly. With solid productivity growth around 2% annually, 5%-6% wage growth is consistent with inflation between 3% and 4%.
Bottom Line
Taking a bottom up and top down approach to the outlook for U.S. inflation over the next year, there is good reason to expect it to slow from the 7% reached in December. The outsized contribution from transportation – both vehicle prices and fuel – is likely to fall out over the next year, reducing the headline rate by around 3.5 percentage points.
At the same time, the contribution from housing is likely to increase. Based on the historical relationship with home prices and rents, shelter costs look set to add upwards of 0.5 percentage points more to inflation over the course of 2022 than it did in 2021.
For the remaining half of the consumption basket, the rate of price growth is likely to remain above 2%. While some moderation in goods prices should happen as production normalizes, global supply challenges could remain acute for several more months, especially in light of the spreading Omicron variant and its impact on global trade. As demand shifts back to services, price growth could accelerate further, especially given the ongoing tightness of the labor market.
All told, the balance of risks to the inflation outlook suggests a rate between 3% and 4% at the end of 2022. Key to reducing inflationary pressures will be the withdrawal of monetary policy, which is likely to extend well past 2022 in order to move inflation to the Fed’s 2% target.
{related-articles-row}
Disclaimer
This report is provided by TD Economics. It is for informational and educational purposes only as of the date of writing, and may not be appropriate for other purposes. The views and opinions expressed may change at any time based on market or other conditions and may not come to pass. This material is not intended to be relied upon as investment advice or recommendations, does not constitute a solicitation to buy or sell securities and should not be considered specific legal, investment or tax advice. The report does not provide material information about the business and affairs of TD Bank Group and the members of TD Economics are not spokespersons for TD Bank Group with respect to its business and affairs. The information contained in this report has been drawn from sources believed to be reliable, but is not guaranteed to be accurate or complete. This report contains economic analysis and views, including about future economic and financial markets performance. These are based on certain assumptions and other factors, and are subject to inherent risks and uncertainties. The actual outcome may be materially different. The Toronto-Dominion Bank and its affiliates and related entities that comprise the TD Bank Group are not liable for any errors or omissions in the information, analysis or views contained in this report, or for any loss or damage suffered.
Download
Share: