What are the Costs of the Federal Reserve Being Behind the Curve?
Vikram Rai, Senior Economist | 416-923-1692
Date Published: May 18, 2022
- Category:
- US
Highlights
- The robust recovery from the pandemic recession has pushed U.S. inflation to a multi-decade high while bringing the unemployment rate back to its pre-pandemic level.
- Chances of a "soft landing" are closely tied to whether households and businesses expect the Fed to succeed. If inflation expectations remain moored, the amount of economic output that the Fed must sacrifice to bring inflation down will be lower.
- Inflation expectations are showing signs of moving higher, aided by strong labor demand. This adds to the urgency of the Fed to act, thus raising the risk of turbulence ahead.
- If the Fed must reestablish its credibility as an inflation fighter, it may well opt to sacrifice yet more economic activity to bring down inflation.
Sand has shifted quickly under policymakers in the wake of the pandemic. The economic context is very different from what policymakers have been reckoning with for the past several decades. The U.S. unemployment rate stood at 3.6% in April, just a tenth of a percentage point above its pre-pandemic low. The consumer price index (CPI), on the other hand, is up 8.3% from a year-ago, the highest rate in over forty years. Since 1955, every time inflation has been this high and the unemployment rate this low, a recession has followed within twenty-four months.1
The Federal Reserve's economic projections do not imbed this risk, but they do recognize what the situation calls for in the coming years: in order for inflation to fall, interest rates must rise and economic growth must slow.2 The Federal Open Market Committee's Summary of Economic Projections (SEP) shows that the median FOMC member expects the federal funds rate to rise to 2.8% by the end of 2023, real GDP growth to slow to 2% by 2024, and inflation to return to its 2% target no earlier than 2025. This is possible, but it won't be easy. Success depends on a small enough sacrifice ratio – how much economic activity must slow to bring down inflation. Even if everything goes right and the current mismatch between demand and supply narrows, if inflation expectations move much higher, a hard landing will become more likely.
What are the Federal Reserve's challenges?
The primary challenge of the Federal Reserve in setting rates is in understanding how inflation and economic growth will respond to policy rate increases. The economy has been in a low interest rate environment for ten years, and the Federal Reserve's policy rate has never lifted off from such a low level at a time when the unemployment rate has plumbed the depths to this degree.
The inflation process is typically captured in macro models that relate future inflation to two factors: the degree of slack in the economy, and inflation expectations. The less slack there is, the more competition will lead to higher prices. The higher household and businesses expect inflation to be, the more likely it is to be imbedded in input costs and therefore realized inflation.
To probe the importance of inflation expectations, we use our in-house model to consider two alternative scenarios around baseline forecast. First, we consider a "Well-Anchored Scenario", in which a high share of consumers and businesses expect future inflation to return to target, despite its current elevated level. Second, we consider an "Unanchored Scenario," where more consumers and businesses develop backwards-looking inflation expectations. That is, they expect inflation to be where it has been recently. For these individuals, they will only believe inflation will come down after it begins to.
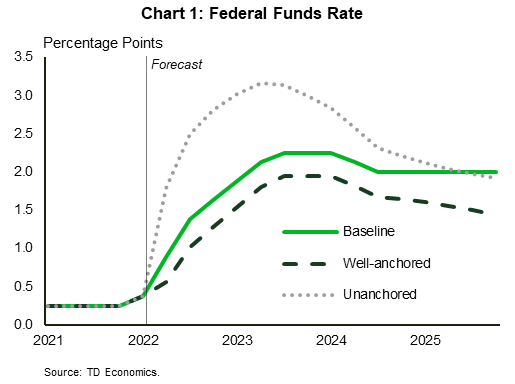
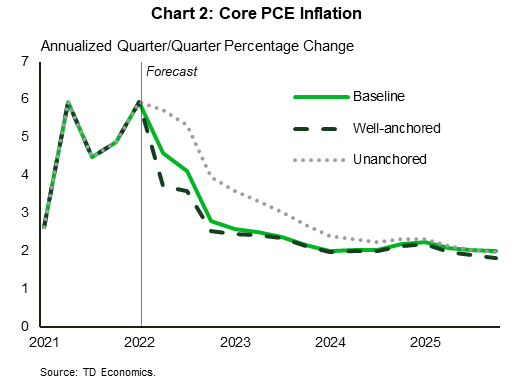
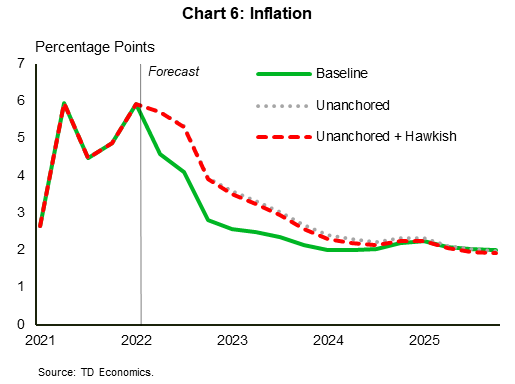
The differences in outcomes from these scenarios is apparent and stark: the federal funds rate must rise well above our baseline forecast in the Unanchored Scenario and remain higher for the next three years (Chart 1). Comparatively, in the well-anchored scenario, the Federal Reserve does not have to raise rates as high and could afford to begin easing interest rates sooner than in our baseline. The picture with respect to inflation is similar – inflation remains above 3% in the unanchored scenario until late in 2023 (Chart 2).
Just as important is the impact on unemployment, shown in Chart 3. Our baseline forecast expects the unemployment rate to rise gradually beginning later this year, as the economy is slowed down by higher interest rates.
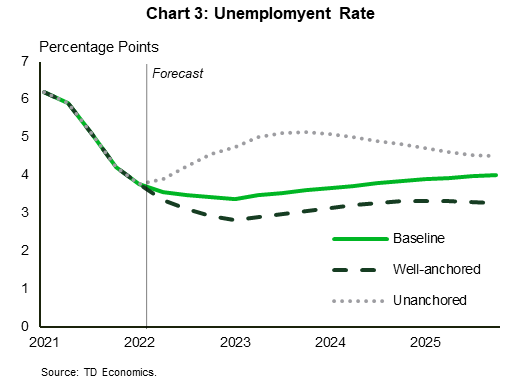
While technically not a recession in terms of declining real GDP growth, the unemployment rate rises more in the Unanchored Scenario than in our baseline. It is a full point higher for most of the next three years. Economic growth in this scenario is below potential for almost the entire forecast period and weak for some quarters, though it never falls into negative territory – avoiding a recession.
Note that in the Unanchored Scenario, despite unemployment and interest rates both rising more than in the baseline, inflation remains elevated, as Chart 2 shows. This is because the Fed follows the same policy rule in both scenarios, putting roughly equal weight supporting economic activity and achieving the inflation target. It is possible that in this scenario, the central bank will instead decide that to reestablish its credibility, it must be willing to accept an even greater economic shock.
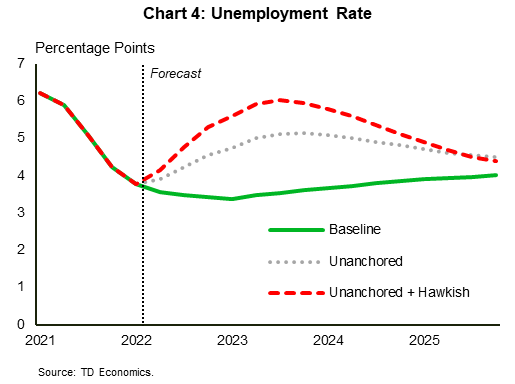
To explore what might happen if the Federal Reserve adopts a more hawkish approach than it has in the past, we reconsider the "Unanchored" scenario if the Fed's reaction function puts more importance on inflation and less on economic output. We modify the Federal Reserve's policy rule in our model so that the relative weight on the inflation target is just outside the bounds of historical estimates, and we lower the weight on output to close to zero. This is intended to be an extreme case – what might the Federal Reserve do if it prioritized bringing down inflation above all else?
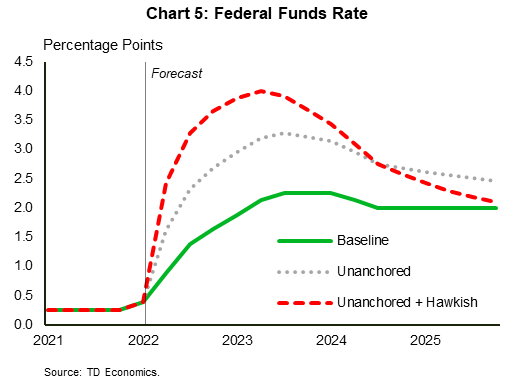
In this more-hawkish Fed scenario, the unemployment rate rises rapidly through to the end of 2022, peaking at 6% where it remains for some time (Chart 4). This is accompanied by the federal funds rate rising above 4%, a level not seen since just before the 2008 recession (Chart 5). The disappointing result in this scenario is that the impact on inflation ends up being almost nothing (Chart 6). It is modestly lower throughout the scenario, but the expectations channel is much more powerful than the impact of economic activity on prices.
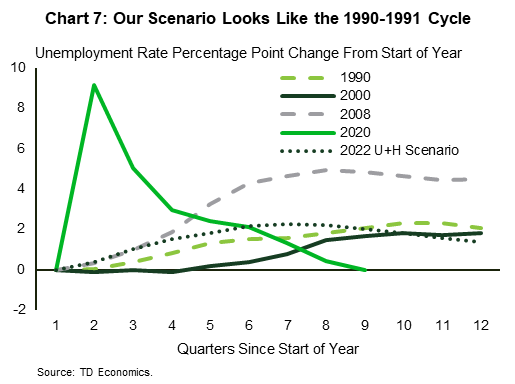
We compare our scenario to previous years in which a recession has occurred in Chart 7. Compared to past business cycles, the evolution of the unemployment rate in this scenario is quite like the recession of the early 1990s. Though our modelling suggests this path could be occur without a recession, the U.S. did go through a technical recession in that cycle.
Are higher inflation expectations setting in?
So, which of these scenarios is the economy heading towards? In real time, inflation expectations cannot be observed directly. You can ask people, but economists do not have consensus on how much to rely on surveys. You can also use market-based measures – the compensation for inflation risk that bond holders require to hold nominal instead of real return bonds.
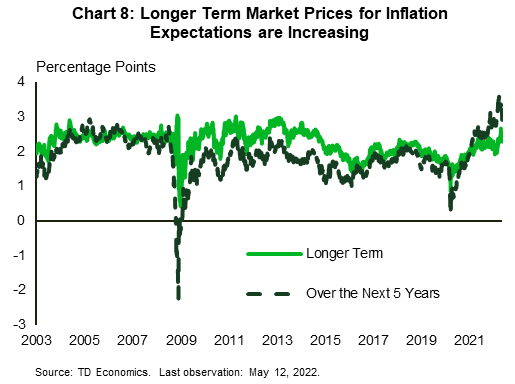
The data we have so far shows that when consumers are asked what they expect, they see higher inflation next year, but not in the long term (Chart 8). Market-based measures show that bond holders are pricing average inflation over the next 5 years around 3%, relatively close to our baseline given the impact of high inflation in 2022 on that average. Over the subsequent five years, inflation expectations are priced closer to 2.5%, somewhat higher than the average since 2015. While expectations have been migrating higher, the Federal Reserve should be comforted that long-run expectations are still close to target. We would take this to mean that it is still manageable for the central bank to manage a soft landing if it acts relatively swiftly.
The bottom line
Our baseline forecast is for the Fed to achieve a "soft landing." With the federal funds rate rising to 2.25-2.5% over the course of the next 12 months, continued improvement in supply chains, and some shifting in demand from goods to services, economic growth and inflation should slow to a more sustainable pace.
However, this forecast imbeds the assumption that inflation expectations remain relatively stable and that this allows for a comparatively small sacrifice in terms of economic output and inflation to bring down price measures in a reasonable time frame. If expectations are becoming less anchored – as some recent data would suggest – then the Fed will have to act more swiftly and accept more economic harm. This would suggest that the risks of an economic downturn over the next two years is more elevated than it has been in the recent past.
Disclaimer
This report is provided by TD Economics. It is for informational and educational purposes only as of the date of writing, and may not be appropriate for other purposes. The views and opinions expressed may change at any time based on market or other conditions and may not come to pass. This material is not intended to be relied upon as investment advice or recommendations, does not constitute a solicitation to buy or sell securities and should not be considered specific legal, investment or tax advice. The report does not provide material information about the business and affairs of TD Bank Group and the members of TD Economics are not spokespersons for TD Bank Group with respect to its business and affairs. The information contained in this report has been drawn from sources believed to be reliable, but is not guaranteed to be accurate or complete. This report contains economic analysis and views, including about future economic and financial markets performance. These are based on certain assumptions and other factors, and are subject to inherent risks and uncertainties. The actual outcome may be materially different. The Toronto-Dominion Bank and its affiliates and related entities that comprise the TD Bank Group are not liable for any errors or omissions in the information, analysis or views contained in this report, or for any loss or damage suffered.
Download
Share: