U.S. Housing Market –
A Path Back to Affordability
Shernette McLeod, Economist | 416-415-0413
Date Published: August 28, 2024
- Category:
- US
- Real Estate
Highlights
- The U.S. housing market has undergone significant changes in recent history – going from an unprecedented level of home affordability in the aftermath of the 2008 housing crisis, to a current state of unaffordability not experienced within the last 20 years.
- The current level of unaffordability is the result of a combination of factors reflecting forces of both supply and demand. What’s more, the drop in affordability is evident across all regions of the country and among homebuyers as well as renters.
- Nevertheless, the situation is not irreversible. Our analysis suggests that with moderate adjustments to interest rates and income, even with continued mild home price growth, national affordability could be restored to acceptable levels within 3 years.
The U.S. housing market is coming off a tumultuous half decade with rapidly rising home prices and higher interest rates contributing to a notable decline in affordability. Since December 2019, just prior to the start of the pandemic, affordability, as measured by a housing affordability index (HAI), declined 44%. The last time buying a home was this unaffordable was in the mid-1980’s. In this report we take a closer look at the issue, including examining the recent drivers of the deterioration as well as what mix of price and rate dynamics would be required to restore affordability to a reasonable level nation-wide.
How is Affordability Calculated?
The HAI used in this report follows the industry standard and is computed in a manner similar to that reported by the National Association of Realtors’ (NAR). It measures whether or not a family earning the median income could qualify for a mortgage loan on a median-priced home.
More specifically, a value of 100 means that a family with the median income has exactly enough income to qualify for a mortgage on a median-priced house, assuming a 20% down payment and monthly payments not exceeding 25% of income. This is considered to be the benchmark for “full affordability”. An index above 100 signifies that a median earning family has more than enough income to qualify for a mortgage loan on a median-priced home. For example, a HAI of 150 means a family earning the median family income has 150% of the income needed to qualify for a conventional mortgage loan covering 80% of a median-priced home. An increase in the HAI, therefore, is associated with greater affordability.
Decomposing the Decline in Affordability
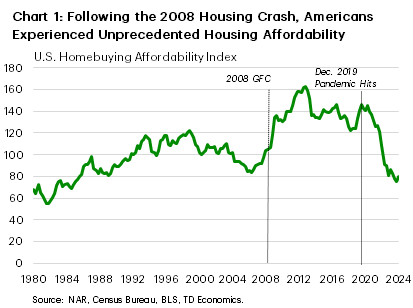
Prior to the pandemic, American homebuyers had enjoyed a prolonged period of affordability that followed the 2008 housing crash. In fact, 2012 marked the most affordable single year in data going back to the early 1980’s (Chart 1).
Since 2020, deterioration in the affordability metric has been steady and swift, but the underlying drivers have shifted over time (Table 1). Between late 2019 Q4 and 2022 Q1, the bulk of the erosion was owing to soaring home prices amid low interest rates, increased trend of remote working and fear of missing out among non-homeowners.
In the most recent wave (2022 Q1 to current), the big culprit behind the decline in the HAI has been higher mortgage rates. And while home price gains have cooled to below the pace of income growth, the resilience of home prices has still been impressive in the face of lofty borrowing costs. This reflects a mix of factors, both on the supply and demand sides, such as:
- A lack of product on the resale market. Namely, homeowners who had secured mortgages when rates were low, were unwilling to sell, resulting in a lower supply of existing homes.1
- Demand also remained relatively elevated due to significant immigration to the US as well as a large cohort of millennials transitioning into their household formation years.
- Additionally, with the resale market essentially in suspended animation, there wasn’t much relief to be had in the new home market as rising construction costs, unavailability of labor and other factors held back the construction of new homes. Consequently, a supply of new homes was not available to help offset the drop in supply on the resale market. What’s more, the relatively higher price tag on most new homes did little to alleviate the affordability problem.
To sum it up, a combination of high home prices, higher interest rates, limited supply and still high demand all combined to significantly erode the affordability of housing in the U.S. Furthermore, while much of the decline in the early period was largely due to rising prices, by 2022 Q2, rates had begun taking on an increasingly larger role in eroding affordability.
Table 1
| Change Between Periods | ||
| Q4 2019 - Q1 2022 | Q1 2022 - Q1 2024 | |
| Housing Affodability Index (%) | -23.5 | -26.8 |
| Home Prices (%) | 37.5 | 6.7 |
| Mortgage Rates (ppts*) | 0.1 | 2.9 |
| Income (%) | 6.7 | 8.4 |
Costs of Ownership Also Stymied Affordability
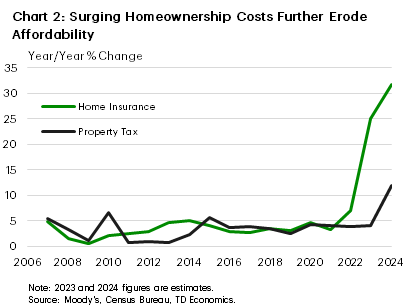
If the declines recorded in affordability weren’t eye-opening enough, standard measures (including our HAI) could be understating the true picture. This is because calculations do not directly take into account non-mortgage costs such as property taxes and insurance. These costs, however, can move the needle on affordability if growing at an outsized rate. This has been the case for home insurance premiums, in particular. Premiums have risen notably and continue to do so due to factors such as the impact of inflation on building materials, recent losses experience by insurers and greater frequency of payouts due to extreme weather events (Chart 2). In fact, between 2022 and 2023 annual average insurance premiums increased by an estimated 25%, with current projections putting the annual increase for 2024 north of 30%.
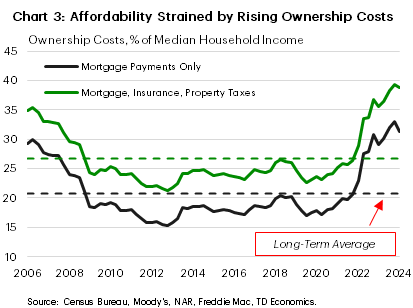
Looking at it another way, mortgage payments on their own are currently just about 30% of median household income (Chart 3). If insurance and property taxes are added, the share jumps closer to 40%, which is notably above its long-term average of around 27%. This means homebuyers have to allocate an increasingly larger share of income to account for home ownership costs, thereby stretching the limits of affordability.
Implications of Lower Housing Affordability
The current state of unaffordability in the U.S. housing market is likely to have lasting impacts as studies have shown that a lack of affordable housing can have negative effects on community development, businesses growth and even the health and wellbeing of individuals.2 One of the most direct impacts is a likely decline in the home ownership rates throughout the country. Generally, the proportion of Americans who own their home tends to decrease as median home prices increase. From the most recent high of 66% in 2023 Q3, ownership rates have slipped to 65.6% in 2024 Q1 and both these figures are well below rates of almost 68% enjoyed in early 2020. In fact, less than half of current non-homeowners expect to own a home one day according to data from the Federal Reserve Bank of New York. Their annual housing survey found that just 40% of current renters, a new series low, ever expect to own a home, with approximately 74% stating that obtaining a mortgage is somewhat or very difficult.3
Not surprisingly, the lack of affordability in the homeownership space has pushed more would-be buyers into the rental market or caused others to remain there longer than preferred. This is yet another fallout of lower homebuying affordability and is likely to increase pressure on rental prices. In fact, respondents in the NY Fed housing survey, which was administered in February 2024, expected rent price growth next year to reaccelerate to 9.7% y/y – the second highest reading in the series since 2022 and reversing last year’s decline. Given the significance of shelter costs in the consumer price index (CPI) basket, this could have implications for inflation and the Fed’s policy action, should an uptick in shelter prices materialize.
Owning vs Renting
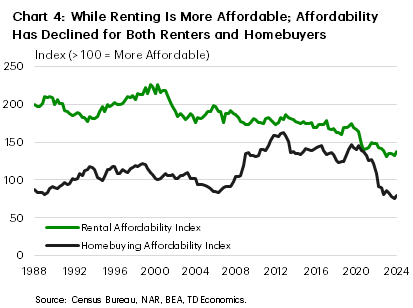
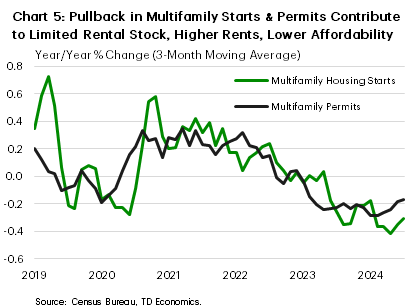
This leads to another point worth assessing in the current climate – the affordability of renting versus owning. Looking at our rental affordability index (RAI), which is constructed in a manner similar to the HAI, it is observed that over the available dataset, the RAI has been above the HAI indicating greater rental affordability relative to homebuying affordability (Chart 4).4 Between 2019 Q4 and 2024 Q1, however, the affordability of renting (as measured by the RAI) declined by over 18%. Even so, the RAI is currently 72% higher than the HAI, suggesting that while renting has not escaped the current affordability crunch, this segment is still relatively more affordable than ownership. Nonetheless, as noted above, a contributing factor to the recent decline in rental affordability has been the increase in demand from those who would have moved on to homeownership but currently cannot afford to do so. Rental demand has also been propped up by a notable rise in immigration to the U.S post-pandemic. On the other side, supply has not kept pace with the demand for rental housing. In fact, starts and completion for multifamily housing has barely grown since December 2019 (Chart 5).
Regional Impacts
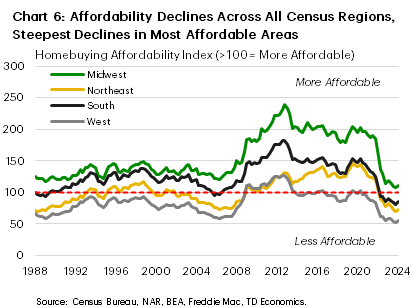
The decline in affordability at the national level is also fairly evident at the regional level. The West and Northeast have generally been the least affordable parts of the country but even so, affordability declined further by 44% and 49%, respectively, since the pandemic (2019 Q4 to present). The Midwest, generally the most affordable region in the U.S., saw a sizeable deterioration in its affordability as well (-44%). Of note, rates of home ownership in this region, though still the highest in the nation, experienced a statistically significant decline over the past year (between 2023 Q1 and 2024Q1) according to the Census Bureau.
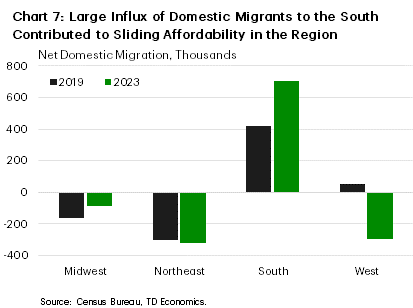
The usually affordable Southern region also experienced significant declines (-43%) in affordability post-pandemic (Chart 6). In fact, while the median family income is still more than sufficient to purchase the median priced home in the Midwest (despite the notable drop in the affordability index), that is no longer the case in the South, where the index currently sits below the 100-point threshold. This development likely reflects differing migration dynamics in the two areas (Chart 7). There was sizeable net domestic migration to several states in the South during and after the pandemic as the already high cost of housing in some states such as California, New York and Illinois helped to drive strong net migration from these areas into relatively more affordable southern states such as Tennessee, South Carolina, and Florida. In fact, net domestic migration between 2019 and 2023 for these states was up 68%, 54% and 39% respectively.
These population movements unfortunately, have for the most part negatively impacted affordability in many of the receiving states, without improving affordability in the leaving states. Between 2019 Q4 and 2024 Q1 for example, the homebuying affordability index for South Carolina declined from 155 to 72 as an influx of residents drove up prices, while for California it deteriorated from a highly unaffordable 74.6 to an even more unaffordable 41.5 points.
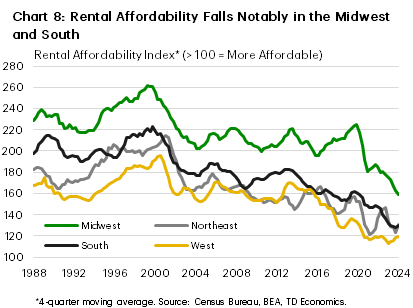
It is not just homebuying affordability that has declined regionally, but similar trends are apparent in the rental affordability index (Chart 8). Rental affordability has declined across all regions, with steep drops evident in the Midwest and South.
How Can Affordability be Restored?
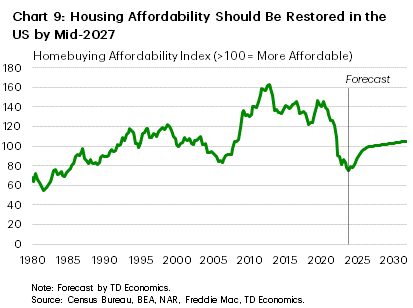
Given the recent decline in affordability, it’s natural to ponder what conditions could restore affordability to the housing market? Meaning, what conditions are necessary such that a household earning the median income can once again purchase the median priced home (assuming 20% down and monthly payments not exceeding 25% of income)? Perhaps the most natural assumption is that a significant drop in home prices commensurate with the run-up during the pandemic, would be necessary to trigger this development. Such a scenario however would likely require a U.S. recession and a nationwide spike in job losses accompanied by a swift and sizeable rate-cutting cycle. This combination is not our baseline for the years ahead. Nonetheless, affordability could be restored within a few years. In fact, in our base case scenario for interest rates, income growth and home price growth, affordability (i.e., the HAI = 100) would be restored by mid-2027 (Chart 9). Under this scenario, mortgage rates would fall only modestly from their current 7% to within the 5% – 5.5% range, median home prices would continue to grow modestly at about 3% annually and income would grow at an annual average rate of about 4.5%, in line with its historical rate.
This question could also be looked at in another way. If we wished to restore affordability right now, what would that mean for rates, prices, and income. Based on our analysis, holding the other two variables constant, mortgage rates would have to fall close to 300 basis points, prices would have to drop about 20% or incomes would have to rise just over 25%. While we don’t foresee any single one of these occurring, the path to restoring affordability will likely involve a contribution of all three as embedded in our base case.
Bringing it Home
Since the pandemic, the U.S. has seen a significant erosion in the affordability of housing nationwide. Recent election proposals put forward by the Democratic party in particular contained a number of policies aimed at reversing this trend. The jury is still out however on how these proposals might move the needle, given that the impacts of some of the policies could be mixed. Demand side measures in particular might have the unintended consequence of reducing affordability, while supply side measures could help, but much depends on their design and implementation.
Also noteworthy is that the phenomenon of dwindling affordability is not limited to just the homebuying segment but is also evident among renters, as a dearth of housing stock and rising demand, combined with significant price appreciation over a relatively short period of time has squeezed both market segments. Rising interest rates compounded the issue. While areas in the South and Midwest remain relatively more affordable than their counterparts in the West and Northeast, they too have not escaped the plunge in affordability. Despite the current situation, our base case forecast suggests that all is not lost. With moderate adjustments to interest rates and income, even with continued slight home price appreciation, affordability could be restored at the national level within 3 years. Of course, the situation in some cities and metros is likely to take longer, given that these are the areas where affordability is most stretched, but overall, the case for the restoration of housing affordability in the U.S. is within the realm of achievability.
End Notes
- The impact of existing low-rate mortgages on restricting the supply of homes for sale on the market (aka the lock-in effect) has been well documented. See FHFA Staff Working Paper Series (2024), The Lock-in Effect of Rising Mortgage Rates. Also see Federal Reserve Bank of New York, Mortgage Rate Lock‑In and Homeowners’ Moving Plans.
- See the Harvard Workforce Housing Report and the National Housing Conference’s Impact of Affordable Housing on Health.
- See the Federal Reserve Bank of New York’s Housing Price Growth Expectations Increase; Renters Express Concern for Ability to Own a Home.
- The rental affordability index is constructed by first computing the level of income that would make the median asking rent (as reported by the Census Bureau) represent exactly 30% of annual household income. This figure is referred to as the “affordable income threshold” and is equivalent to the “qualifying income” measure used in the HAI calculation. The rental affordability index is then set equal to 100 times the ratio of median household income to the affordable income threshold..
Disclaimer
This report is provided by TD Economics. It is for informational and educational purposes only as of the date of writing, and may not be appropriate for other purposes. The views and opinions expressed may change at any time based on market or other conditions and may not come to pass. This material is not intended to be relied upon as investment advice or recommendations, does not constitute a solicitation to buy or sell securities and should not be considered specific legal, investment or tax advice. The report does not provide material information about the business and affairs of TD Bank Group and the members of TD Economics are not spokespersons for TD Bank Group with respect to its business and affairs. The information contained in this report has been drawn from sources believed to be reliable, but is not guaranteed to be accurate or complete. This report contains economic analysis and views, including about future economic and financial markets performance. These are based on certain assumptions and other factors, and are subject to inherent risks and uncertainties. The actual outcome may be materially different. The Toronto-Dominion Bank and its affiliates and related entities that comprise the TD Bank Group are not liable for any errors or omissions in the information, analysis or views contained in this report, or for any loss or damage suffered.
Download
Share: