Highlights
- U.S. households are borrowing more cautiously as higher rates bite. Debt growth has lagged income, pushing leverage below its pre-pandemic level—even as credit continues to expand.
- Less leverage does not mean less financial strain. Higher borrowing costs and pricier homes and vehicles have brought debt-service costs close to pre-pandemic levels, and the pressure is increasing among highly indebted households.
- Household credit quality remains strained but broadly stable, supported by job gains, income growth and substantial wealth buffers. Yet those cushions are unevenly distributed, and rising early-stage mortgage delinquencies warrant attention as more borrowers take on higher-rate debt.
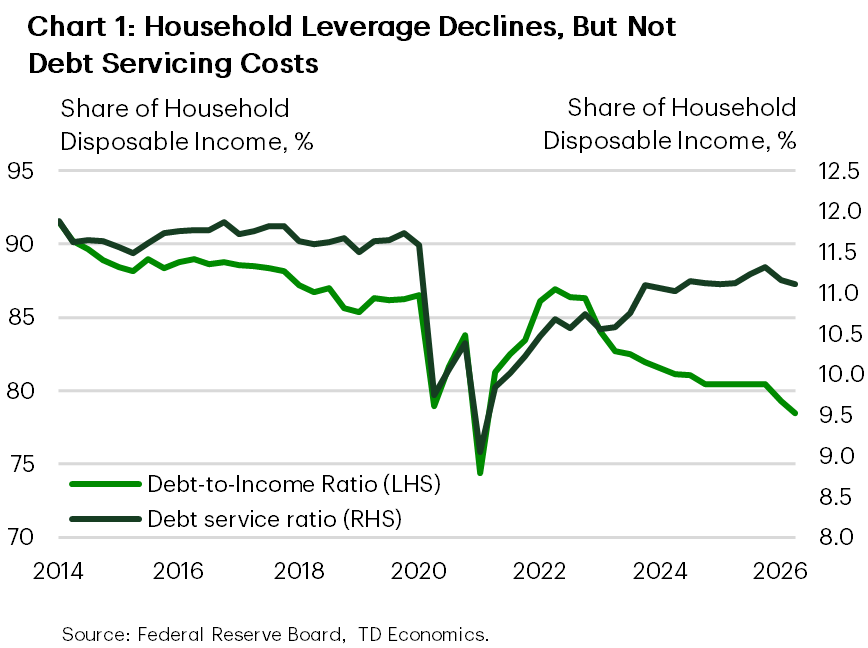 The era of cheap credit is over, and U.S. households are adapting. Elevated interest rates and higher prices for homes, vehicles, and other essentials have raised monthly costs and dampened demand for new credit. Borrowing has slowed relative to income pushing household debt-to-income ratio below its pre-pandemic level even as credit continues to expand (Chart 1).
Lower leverage, however, has provided limited relief from monthly payments. Debt-service costs have returned close to pre-pandemic levels, but the aggregate picture masks greater strain among highly indebted households. Delinquency rates remain elevated, but generally stable, supported by income growth, liquid assets, and substantial home equity. However, these buffers are not evenly distributed, and rising early-stage mortgage delinquencies suggest that households’ resilience will depend increasingly on continued labor market health and income growth as higher borrowing costs persist.
Higher-for-Longer Rates Weigh on Credit Demand
U.S. borrowing costs remain well above pre-pandemic norms and have risen further this year. The prime rate is 25 basis points higher than a year ago and roughly 2.5 percentage points above its 2015–2019 average, while the 30-year mortgage rate is up 1.1 percentage points from a year ago and more than 3 percentage points above its pre-pandemic average. Credit-card rates also remain elevated, with wider spreads over prime likely reflecting higher delinquency risk.
The Fed’s recent rate hike and higher long-term yields have dimmed hopes of near-term relief, and another hike expected by year-end would further raise borrowing costs (see report). This will be especially meaningful for prospective home buyers: for a median-priced home of $423,000, a 1 percentage-point increase in the mortgage rate adds about $220 to the monthly payment.
Higher financing costs have compounded the increase in major purchase and ownership costs. Since Q4 2019 both home prices and vehicle costs have risen significantly, as a result the average monthly mortgage payment has increased by 40%, while the payment on a newly originated mortgage for a median-priced home has more than doubled—both outpacing the 30% rise in consumer prices, as measured by the Consumer Price Index (CPI). The average amount financed on a new vehicle is up about 30%, while car insurance and household energy and utilities costs have risen 48% and 44%, respectively. Households therefore face higher costs to buy, finance, and maintain major assets.
Elevated interest rates have dampened U.S. households’ appetite for credit. Non-mortgage credit growth averaged just 3.4% at an annualized rate over the past 24 months, down from 6.2% before the pandemic. Even so, consumer spending has continued to grow faster than both consumer credit and disposable income (Table 1). This divergence suggests that households have increasingly relied on savings or wealth gains, rather than new borrowing, to support consumption. This is also reflected in the decline in the personal saving rate, which fell from 7.2% in January 2024 to 3.8% in September, its lowest level in four years.
Table 1: Growth in Household Credit
| Consumer Spending | Disposable Income | Non-mortgage Credit (Excl. Student Debt) | Mortgage | |
| Pre-pandemic | 4.0 | 4.3 | 6.2 | 2.8 |
| Pandemic | 7.0 | 6.9 | 4.5 | 6.4 |
| The last two years | 5.7 | 4.4 | 3.4 | 2.6 |
Mortgage credit has followed a somewhat different pattern, with growth remaining close to its pre-pandemic pace even though home sales are about 20% lower. Fewer transactions have reduced the number of new mortgages, but higher home prices have raised the dollar value of originations. Taken together, these trends point to slower borrowing rather than a broad retreat from credit—and underscore the distinction between how much debt households carry relative to their income versus how costly that debt has become to service.
Leverage Down, but Debt Service Costs Stay Elevated
Household leverage has gradually declined as credit growth has lagged income growth, pushing the debt-to-disposable-income ratio well below its pre-pandemic level (Chart 1). Yet lower leverage has not translated into lighter payment burdens. Debt-service costs have returned close to pre-pandemic levels, although disposable income growth has kept pace with debt payments, holding the aggregate debt-service ratio—the share of disposable income devoted to debt payments—relatively stable since 2023.
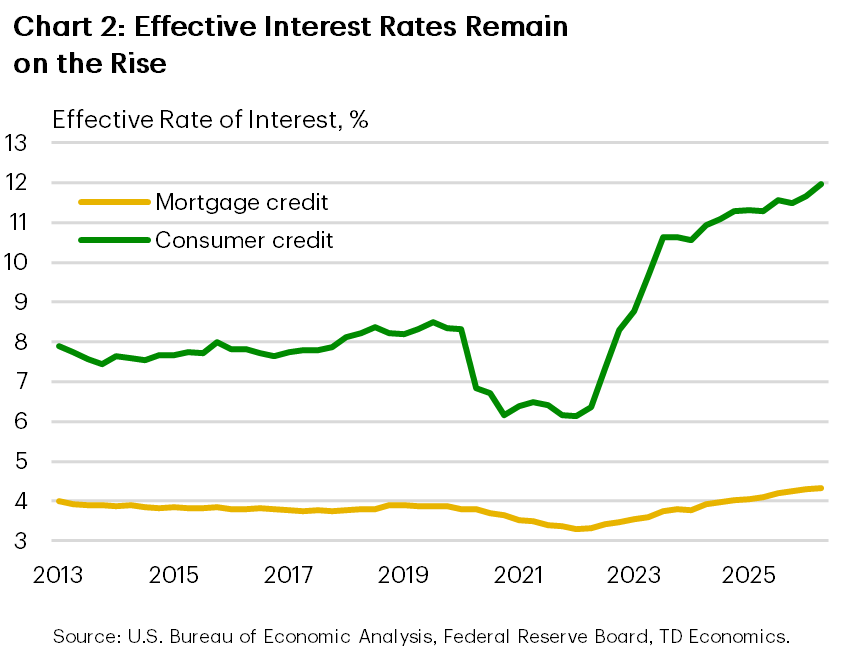
Looking ahead, income will need to continue growing at a solid pace to prevent the debt-service ratio from rising as borrowing costs increase and more debt reprices at higher rates. This repricing is already evident across both consumer and mortgage credit, where effective interest rates have moved steadily higher (Chart 2). Looking specifically at mortgages, 33.3% of outstanding mortgage debt carried rates of 5% or higher as of Q1 2026, up from 28.7% a year earlier and just 14.5% in 2022.
Adjustable-rate mortgages (ARMs) will also add upward pressure to debt-service costs as introductory fixed-rate periods expire and existing loans reset at higher rates. However, they remain a limited source of systemic risk, accounting for just 4.3% of outstanding mortgages. Still, some of these borrowers could see steep increases in their monthly payments. Approximately 180,000 ARMs are scheduled for their first reset next year, equivalent to about 0.35% of all outstanding mortgages.1 Among next year’s resets, about 40% of borrowers with seven-year ARMs originated in 2020 are expected to face a large increase in their monthly mortgage payments, with a median increase of approximately $1,066.2
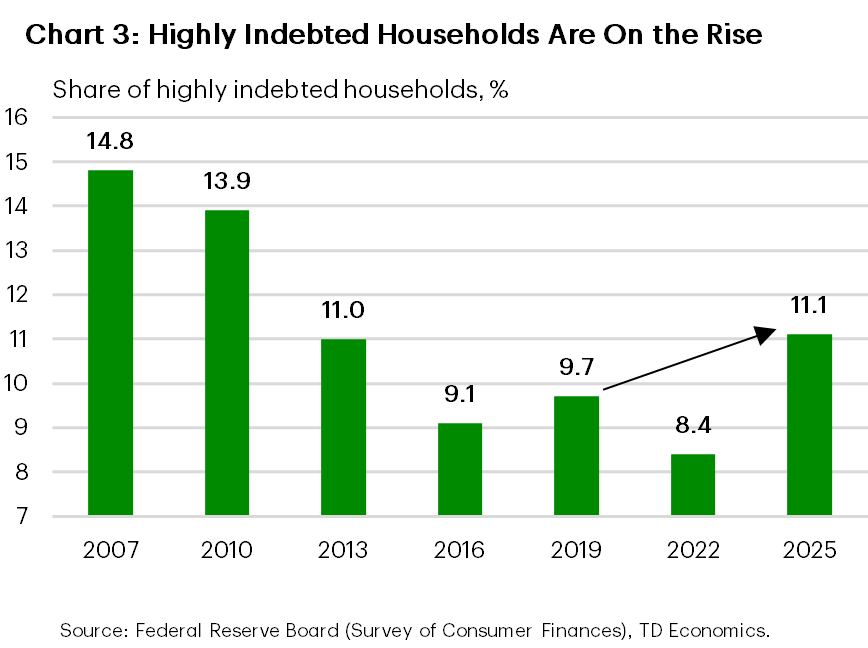
While the aggregate debt service ratio remains relatively benign, this masks mounting pressure among highly indebted households. Among families with debt, the share devoting at least 40% of disposable income to debt payments, indicative of a high debt-service burden, rose from 8.4% in 2022 to 11.1% in 2025, its highest level in more than a decade (Chart 3).
Among homeowners, the share with similarly high debt-service burdens increased from 10.5% to nearly 14% over the same period. Although still below the 18% reached during the Global Financial Crisis, this was also the highest reading in more than a decade. Households in the bottom income quintile show a similar pattern, while older households appear particularly exposed. In 2025, 14.5% of indebted families headed by someone aged 75 or older devoted more than 40% of disposable income to debt payments, the highest share since 2001.
Debt Payments Manageable For Most, but Not Everyone
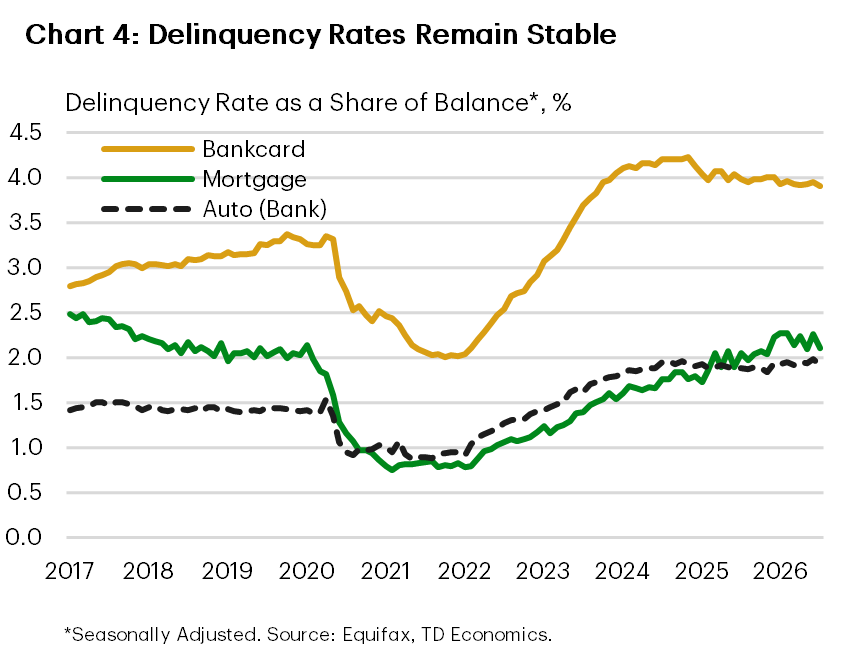
Although aggregate payment burdens remain stable, higher interest rates have weakened credit quality. Delinquency rates on credit cards and auto loans remain somewhat stable but well above their pre-pandemic averages, while mortgage delinquencies have recently surpassed their 2019 level (Chart 4).
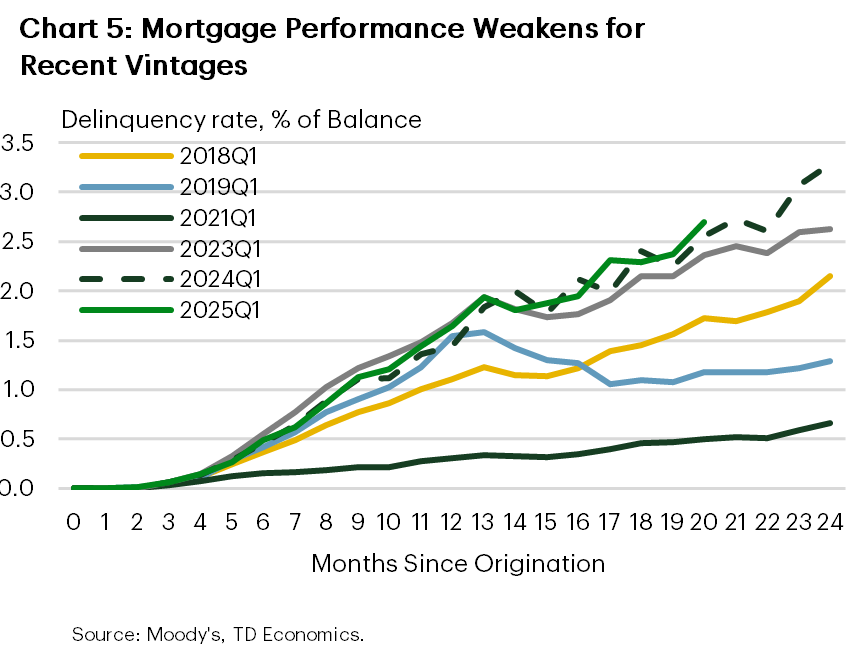
Credit performance by the year of origination tells a similar story: mortgage credit vintages originated before the pandemic or during the low-rate pandemic period recorded substantially lower delinquency rates in the first 24 months than those originated later at higher rates (Chart 5). A similar pattern holds for credit-card vintages.
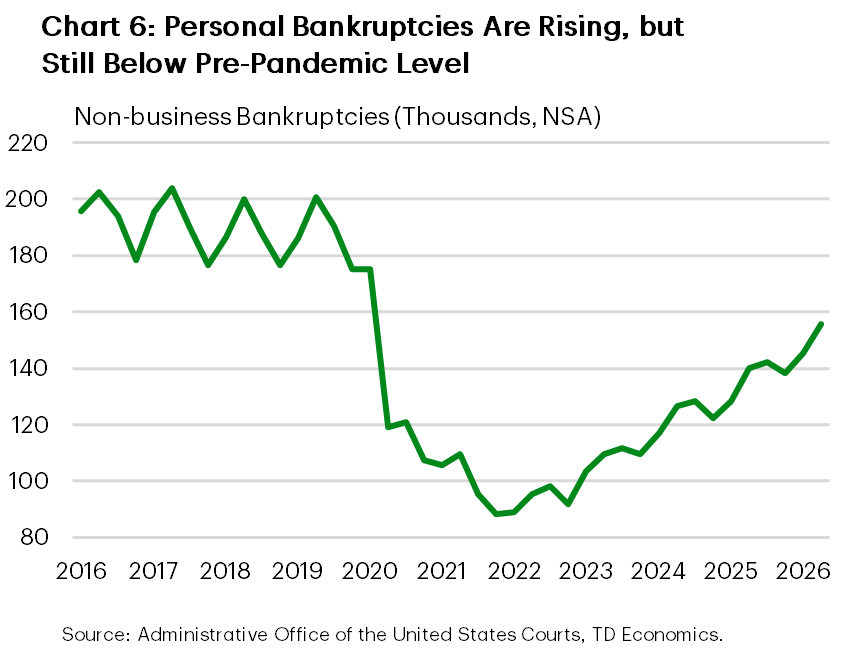
There is little evidence that consumer credit quality is deteriorating further. Early-stage 30-day delinquency rates—a useful indicator of emerging financial stress—remain stable for credit cards and auto loans. Credit card payment behaviour also shows few signs of worsening: utilization rates have declined from a year ago across all credit-score bands, rather than rising as would be the case if households were reducing monthly payments and accumulating balances. Personal bankruptcies are increasing but remain about 20% below their pre-pandemic level (Chart 6). Taken together, these indicators suggest that consumer credit quality remains strained but broadly stable.
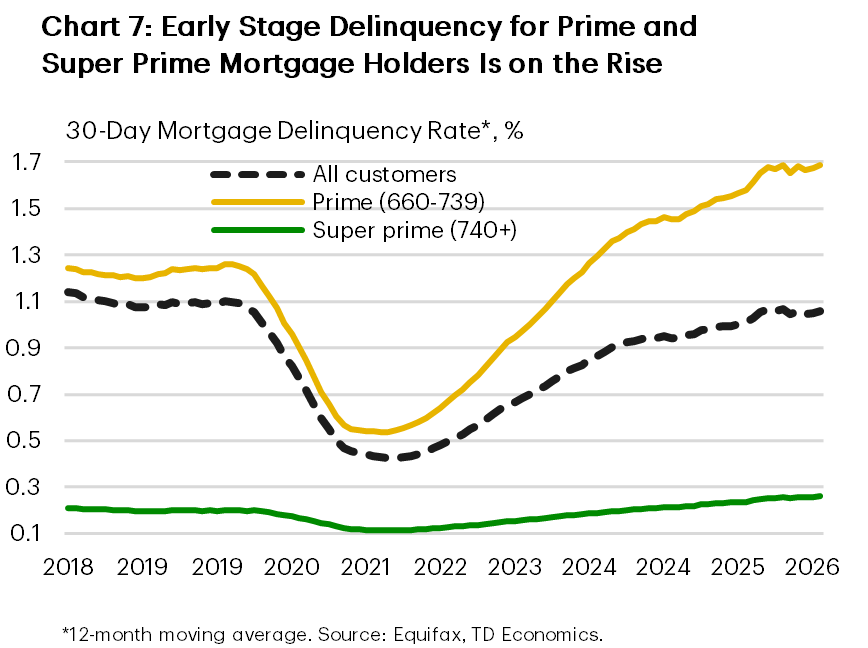
Mortgage credit, however, warrants closer attention as more borrowers become exposed to higher rates. Early-stage delinquencies among prime and super-prime borrowers—which account for 90% of outstanding mortgage credit—have continued to edge higher and now stand notably above pre-pandemic levels (Chart 7). Although the deterioration remains modest, its emergence across such a large segment of the market makes it an important early warning signal.
Do Households Have Enough Financial Cushion?
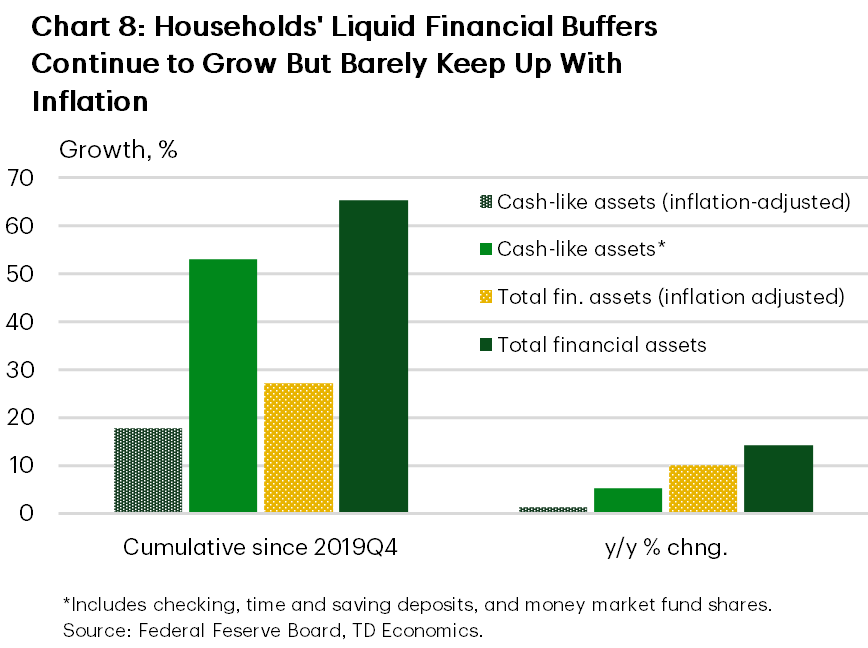
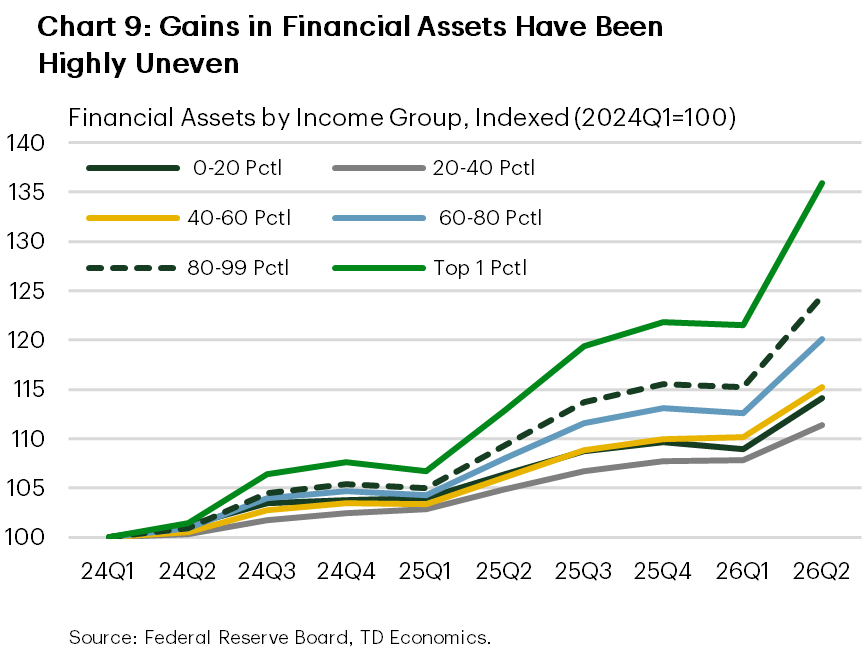
The good news is that households enter the higher rate environment with generally strong balance sheets and meaningful financial buffers. Aggregate household wealth is up 12% from a year earlier, largely on higher equity valuations. Because equity values can fluctuate, however, liquid assets provide a more reliable cushion against financial shocks. Balances on deposit and money market fund shares remain 53% above their pre-pandemic level in nominal terms and 18% higher after adjusting for inflation (Chart 8). Although growth in liquid assets has slowed as households shifted funds toward higher-return investments this year, balances have continued to rise. Detailed data on the distribution of these liquid assets across income segments are limited, but broader measures of financial wealth point to a widening divide between households in the bottom 60% of the income distribution and those with higher incomes (Chart 9).
Homeowners also benefit from a substantial equity cushion. Equity in residential real estate totals about $36 trillion, equivalent to 18% of household wealth. With high mortgage rates making refinancing unattractive, home equity lines of credit (HELOCs) offer an alternative source of funds for renovations, debt consolidation, and other large expenses. Use of this buffer is increasing: revolving HELOC balances at banks rose 6% from a year earlier and 13% from 2024, while utilization climbed from 41% to 43% as of Q2.
The labour market remains another important source of resilience. The economy continues to add jobs, unemployment remains low, and hiring is more broad-based across industries than it was last year. Wage growth for job switchers is once again running more than 1 percentage point above that of job stayers, giving workers greater scope to secure a raise. Our forecast assumes that nominal disposable income will grow at around a 5% pace and that the labour market will continue to generate jobs, helping most households absorb higher borrowing costs. Lower-income households with fewer liquid assets remain more vulnerable, however, particularly as higher gasoline prices add to essential expenses. Overall, household financial buffers remain substantial—but they are far from evenly distributed.
Bottom Line
Higher interest rates have not triggered a broad household debt crisis, but they are reshaping how Americans borrow, spend, and build wealth. Households are borrowing more cautiously as interest rates and debt-service costs remain elevated, pushing leverage below its pre-pandemic level. Credit quality has weakened from its pandemic-era strength and shows some signs of strain but is broadly stable, supported by continuous job gains, income growth, liquid assets, and substantial home equity. These buffers, however, are concentrated among higher-income households and homeowners with significant equity, leaving lower-income, recent homebuyers and older households more exposed higher interest rates and further increases in essential expenses. Rising early-stage mortgage delinquencies also bear watching as more borrowers take on mortgages at higher rates. The most lasting effect of this higher-rate cycle may therefore be a slower and more uneven path for consumption, home ownership, and wealth accumulation.
End Notes
- https://www.fhfa.gov/data/dashboard/nmdb-outstanding-residential-mortgage-statistics
- https://ir.theice.com/press/news-details/2026/ICE-Mortgage-Monitor-ARM-Demand-Hits-Nearly-Four-Year-High-on-Rising-Mortgage-Rates/default.aspx
Disclaimer
This report is provided by TD Economics. It is for informational and educational purposes only as of the date of writing, and may not be appropriate for other purposes. The views and opinions expressed may change at any time based on market or other conditions and may not come to pass. This material is not intended to be relied upon as investment advice or recommendations, does not constitute a solicitation to buy or sell securities and should not be considered specific legal, investment or tax advice. The report does not provide material information about the business and affairs of TD Bank Group and the members of TD Economics are not spokespersons for TD Bank Group with respect to its business and affairs. The information contained in this report has been drawn from sources believed to be reliable, but is not guaranteed to be accurate or complete. This report contains economic analysis and views, including about future economic and financial markets performance. These are based on certain assumptions and other factors, and are subject to inherent risks and uncertainties. The actual outcome may be materially different. The Toronto-Dominion Bank and its affiliates and related entities that comprise the TD Bank Group are not liable for any errors or omissions in the information, analysis or views contained in this report, or for any loss or damage suffered.